Wrong guess method
1. Method introduction
1. Definition: based on experience and intuition to speculate on all possible errors in the program, so as to design test cases in a targeted manner.
2. The basic idea of the wrong speculation method:
Enumerate all possible errors in the program and special situations that are prone to errors, and select test cases based on them.
1) For example, the input data and output data are 0; the input form is blank or the input form has only one line. These are all error-prone situations. The examples in these situations can be selected as test cases.
2) For example, in the program of the score report in the previous example, some test cases can be supplemented by adopting the error speculation method:
I. Does the program respond with spaces?
II. There are standard answer records mixed in the answer records
III. In addition to the title record, there are some records where the last character is neither 2 nor 3
IV. Two students have the same student ID
V. The number of questions is negative.
3) For another example, to test a program that sorts a linear table (such as an array), it can be speculated to list the following conditions that require special testing:
I. The input linear table is empty;
II. There is only one element in the table;
III. All elements in the input table have been sorted;
IV. The input table has been sorted in reverse order;
V. Some or all elements in the input table are the same.
2. Actual combat exercises
Causality diagram method
1. Method introduction
1. Definition: It is a method of using graphical method to analyze various combinations of inputs, thereby designing test cases. It is suitable for checking various combinations of program input conditions.
2. The background of the causality diagram:
The equivalence class division method and the boundary value analysis method both focus on the input conditions, but do not consider the various combinations of the input conditions and the mutual constraints between the input conditions. In this way, although various input conditions may be wrong have been tested, but the combination of multiple input conditions may be wrong has been ignored.
If various combinations of input conditions must be considered during the test, the number of possible combinations will be astronomical. Therefore, a form suitable for describing a combination of multiple conditions and correspondingly generating multiple actions must be considered for the test case. Design, which requires the use of cause and effect diagrams (logical models).
3. Introduction to cause and effect diagram
1) The 4 types of symbols respectively indicate the 4 types of causality in the specifications.
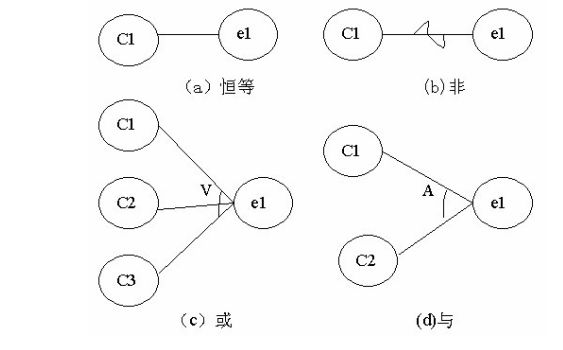
2) Simple logical symbols are used in the cause and effect diagram, connecting the left and right nodes with a straight line. The left node represents the input state (or reason), and the right node represents the output state (or result).
3) Ci represents the cause and is usually placed on the left of the figure; ei represents the result, usually on the right of the figure. Both Ci and ei can take the value 0 or 1. 0 means that a certain state does not appear, and 1 means that a certain state appears.
4. Causality Diagram Concept
1) Relationship
① Identity: If ci is 1, then ei is also 1; otherwise, ei is 0.
②Non: If ci is 1, then ei is 0; otherwise, ei is 1.
③Or: If c1 or c2 or c3 is 1, then ei is 1; otherwise, ei is 0. "Or" can have any number of inputs.
④ And: If both c1 and c2 are 1, then ei is 1; otherwise, ei is 0. "And" can also have any number of inputs.
2) Constraints
There may also be some dependencies between the input states, which are called constraints. For example, it is impossible for certain input conditions to appear at the same time. There are often constraints between output states. In the cause and effect diagram, these constraints are marked with specific symbols.
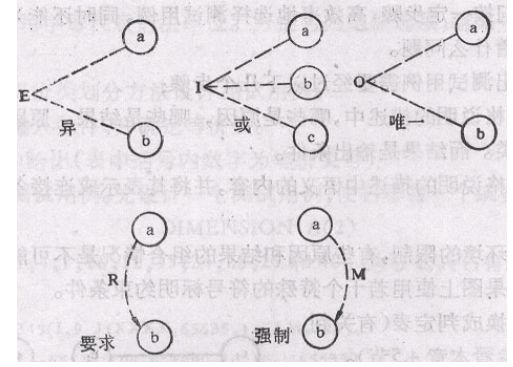
A. There are four types of constraints on input conditions:
① E constraint (exclusive): at most one of a and b may be 1, that is, a and b cannot be 1 at the same time.
② I constraint (or): at least one of a, b, and c must be 1, that is, a, b, and c cannot be 0 at the same time.
③ O constraint (unique); there must be one of a and b, and only one is 1.
④R constraint (requirement): when a is 1, b must be 1, that is, it is impossible for b to be 0 when a is 1.
B. Output condition constraint type
The constraint of the output condition is only M constraint (mandatory): if the result a is 1, the result b is forced to 0.
5. Steps to design test cases using the causality diagram method:
1) In the analysis software specification description, those are causes (that is, input conditions or equivalent classes of input conditions), and those are results (that is, output conditions), and an identifier is assigned to each cause and result.
2) Analyze the semantics in the software specification description, find out the corresponding relationship between the cause and the result, and between the cause and the cause, and draw a cause-effect diagram based on these relationships.
3) Due to grammatical or environmental constraints, it is impossible to combine some causes and causes, and between causes and effects. In order to show these special situations, some signs are used to indicate constraints or restrictive conditions on the cause and effect diagram.
4) Convert the cause and effect diagram into a judgment table.
5) Take out each column of the judgment table as a basis to design test cases.
2. Actual combat exercises
1. A software specification contains such a requirement: the first column of characters must be A or B, and the second column of characters must be a number. In this case, modify the file, but if the first column of characters is incorrect, give Output information L; if the second column of characters is not a number, then information M is given.
answer:
1) According to the meaning of the question, the reasons and results are as follows:
the reason:
1-The first column of characters is A;
2-The first column of characters is B;
3-The second column of characters is a number.
result:
21—Modify the file;
22 —— Give information L;
23-Give information M.
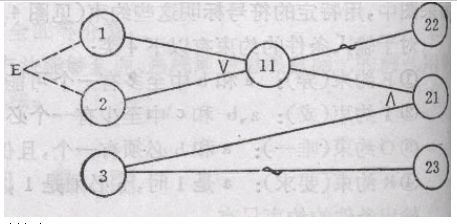
2) The corresponding cause and effect diagram is as follows:
11 is an intermediate node; considering that cause 1 and cause 2 cannot be 1 at the same time, the E constraint is imposed on the causality graph.
3) Establish a judgment table based on the cause and effect diagram.
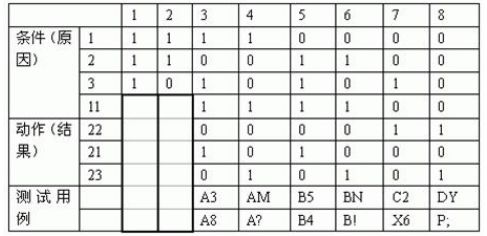
In the left two columns of the eight situations in the table, cause ① and cause ② are both 1. This is impossible, so these two situations should be excluded. The bottom column of the table shows the test cases for 6 cases, which are the data we need.
2. There is a design of a test case for a vending machine software that deals with drinks with a unit price of 5 cents. The specifications are as follows: if you put in a 5 dime or 1 yuan coin and press the button of [Orange Juice] or [Beer], the corresponding drink will be delivered. If there is no change in the vending machine, a red light showing "finished change" is on. At this time, after inserting a 1 yuan coin and pressing the button, the drink is not delivered and the 1 yuan coin is also withdrawn; The red light indicating [finished change] is off, and the 5 dime coin will be refunded when the drink is delivered.
1) Analyze this description and list the reasons and results
the reason:
1. There is change in the vending machine
2. Put in a 1 yuan coin
3. Put in a 5 dime coin
4. Press the orange juice button
5. Press the beer button
result:
21. Vending machine [finished change] light is on
22. Refund of 1 yuan coin
23. Refund of 5 dime coins
24. Give out orange juice drinks
25. Give out beer and beverages
2) Draw a cause and effect diagram, as shown in the figure. All cause nodes are listed on the left, and all result nodes are listed on the right. Establish an intermediate node to indicate the intermediate state of processing. Intermediate node:
11. Put in a 1 yuan coin and press the drink button
12. Press the button of "Orange Juice" or "Beer"
13. You should get 5 cents of change and there is change in the vending machine
14. The money has been paid
3) Converted into a judgment table:

4) In the judgment table, the shaded part indicates the impossible situation due to the violation of the constraint conditions, so delete it. The 16th and 32nd columns were deleted because they did not do anything. Finally, the remaining 16 columns can be used as the basis for determining test cases.
Software testing exchange group: 785128166
WeChat public account: Programmer Erhei; After paying attention, you can receive a set of video resources for free; explain in detail: python automated testing, web automation, interface automation, mobile terminal automation, interview experience and other related content, the value of learning resources depends on you Action, don’t be a "collector"
Here is a collection of selected dry goods articles for functional testing: