product description
MeterSphere is a one-stop open source continuous testing platform, covering test tracking, interface testing, performance testing, team collaboration and other functions, compatible with open source standards such as JMeter, effectively helping development and testing teams make full use of cloud elasticity to conduct highly scalable automated testing and accelerate Delivery of high-quality software.
Quick install
Hardware requirements
| operating system | Any Linux x64 that supports Docker, Centos 7.5+ is recommended |
|---|---|
| CPU and memory | 4 core 8G |
| disk space | 20G |
| Network requirements | Internet access |
A key installation
The command is as follows:
[root@docker ~]# mkdir -p /opt/install/metersphere && cd /opt/install /metersphere
[root@metersphere ~]# curl -sSL https://github.com/metersphere/metersphere/releases/latest/download/quick_start.sh | sh
Note: The installation script uses the /opt/metersphere directory as the installation directory by default, and the configuration files, data and logs of MeterSphere are stored in the installation directory
The general flow of the installation program is as follows: Go to Github to download the installation script → execute the installation script (download the container layout file) → install docker, install docker-compose (skip if it is already installed) → pull the product image of each module → start the container
Sign in and use
After the installation is successful, visit the following page to log in to MeterSphere through a browser (Chrome is recommended):
| address | http://target server IP address:8081 |
|---|---|
| username | admin |
| password | metersphere |
Note: If you can't access it, please turn off the system firewall, refer to the following command: systemctl stop firewalld & systemctl disable firewalld
System Configuration
After logging in to the system, select system settings-system-system parameter settings-basic configuration
Configure the current site URL to the address and port of the server you deployed, as shown in the following figure:
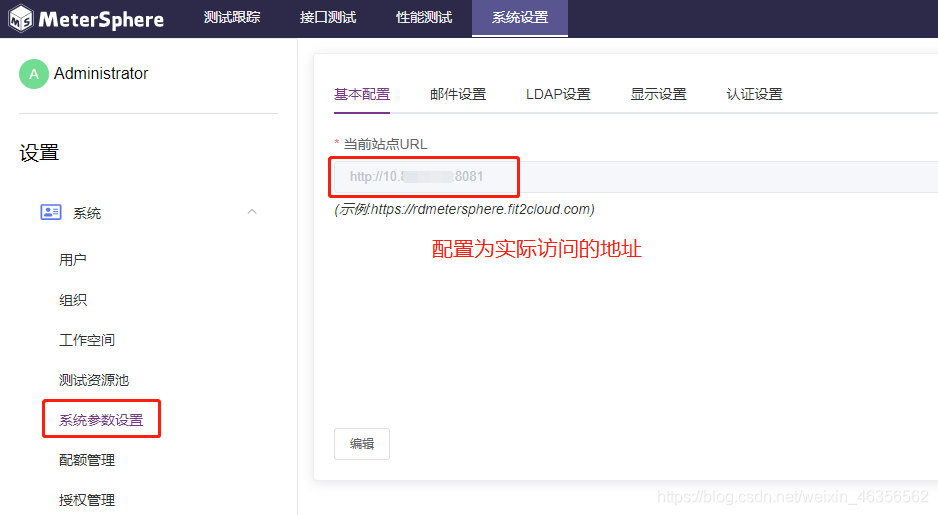
At this point, the MeterSphere environment is ready, it is quite simple, let's start to enter the topic below.
background
In actual projects, most of the interfaces in our software products or business systems require the user to log in in advance, and the interface will return corresponding information based on the information of the logged in user. For example, the interface for querying menus in a management platform will display different menus according to the permissions of the current user. It is possible that the administrator can see 10 menus when logging in, while ordinary users can only see 2 menus when logging in. At this time, the interface for querying the menu list requires user login information before it can return normally. In such a scenario, what should we do when we do interface testing?
Ideas and goals
Login is actually equivalent to the "prerequisite" when we write functional test cases. Our business interface requires a prerequisite of "login". Then can we configure the login interface before the business interface and combine these two Just put all interfaces in the same session environment?
Then let's use the scene automation function of MeterSphere to complete an interface test that requires login.
Steps
The Metersphere platform used in this document is v1.7.3.

Interface information preparation
The interface information can be obtained from the interface document of the software, or you can go to the Chrome browser and use F12 to view it. The following is an example interface:
Login interface
Request address: POST /login
Request parameters:
| Field | Description | Types of | Is it required | Remarks |
|---|---|---|---|---|
| username | username | String | Yes | |
| password | Password corresponding to username | String | Yes |
Return code: 302
Return information: None, but will be redirected to the homepage address.
Get the menu list interface
Request address: POST /PF1210/getMenuAsync
Request parameters:
| Field | Description | Types of | Is it required | Remarks |
|---|---|---|---|---|
| _REQTYPE | Request type | String | Yes | Default: ajax |
| _laccid | laccid | String | Yes | Default: 1 |
Normal return parameters:
| Field | Description | Types of | Is it required | Remarks |
|---|---|---|---|---|
| id | ID of the menu | String | Yes | |
| state | String | Yes | ||
| text | The title text of the menu | String | Yes | |
| attributes | Other parameters | Object | Yes |
Exception return parameters:
| Field | Description | Types of | Is it required | Remarks |
|---|---|---|---|---|
| ExceptionMessage | Exception information | String | Yes | |
| ERROR | error | String | Yes | |
| FUNCTION | method | String | Yes |
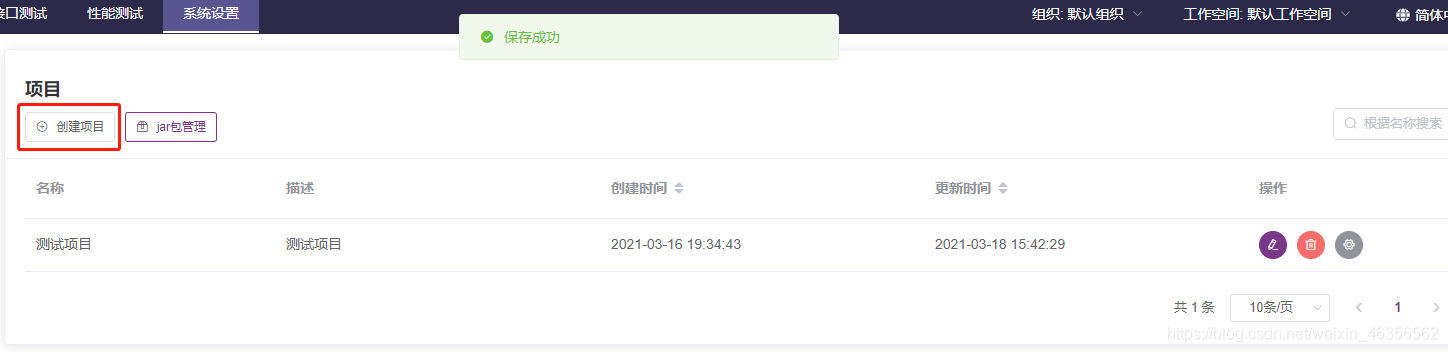
Create a test project
Open MeterSphere, first create a project, enter the system settings-project management in turn, create a new test project, as shown below:
Input interface definition and debug
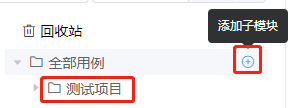
After creating the project, enter "Interface Test"-"Interface Definition" one by one. In the module tree on the left, create a module, which is called "Test Module" for the time being, or you can create and divide it according to the actual module.
Announce my understanding of "interface definition": there are many modules in a system, and each module has many business interfaces. The interface definition is to let us combine the basic information of the interface (address, request parameters, etc.) with the associated information in the platform (Which module it belongs to, who is responsible, description information, etc.) Maintained in a list, we can use this one interface to write its corresponding test case (CASE), and follow-up can also be completed according to the business combination of these interfaces or use cases The test of the scene.
Create the first interface (login)
Choose to create an interface:
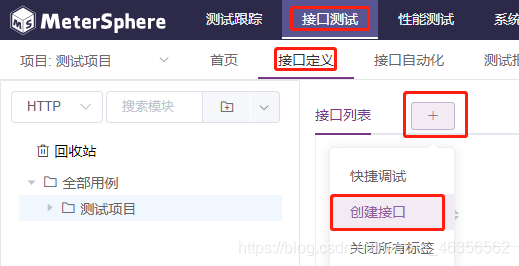
Complete the entry according to the above interface information, as shown in the figure below:
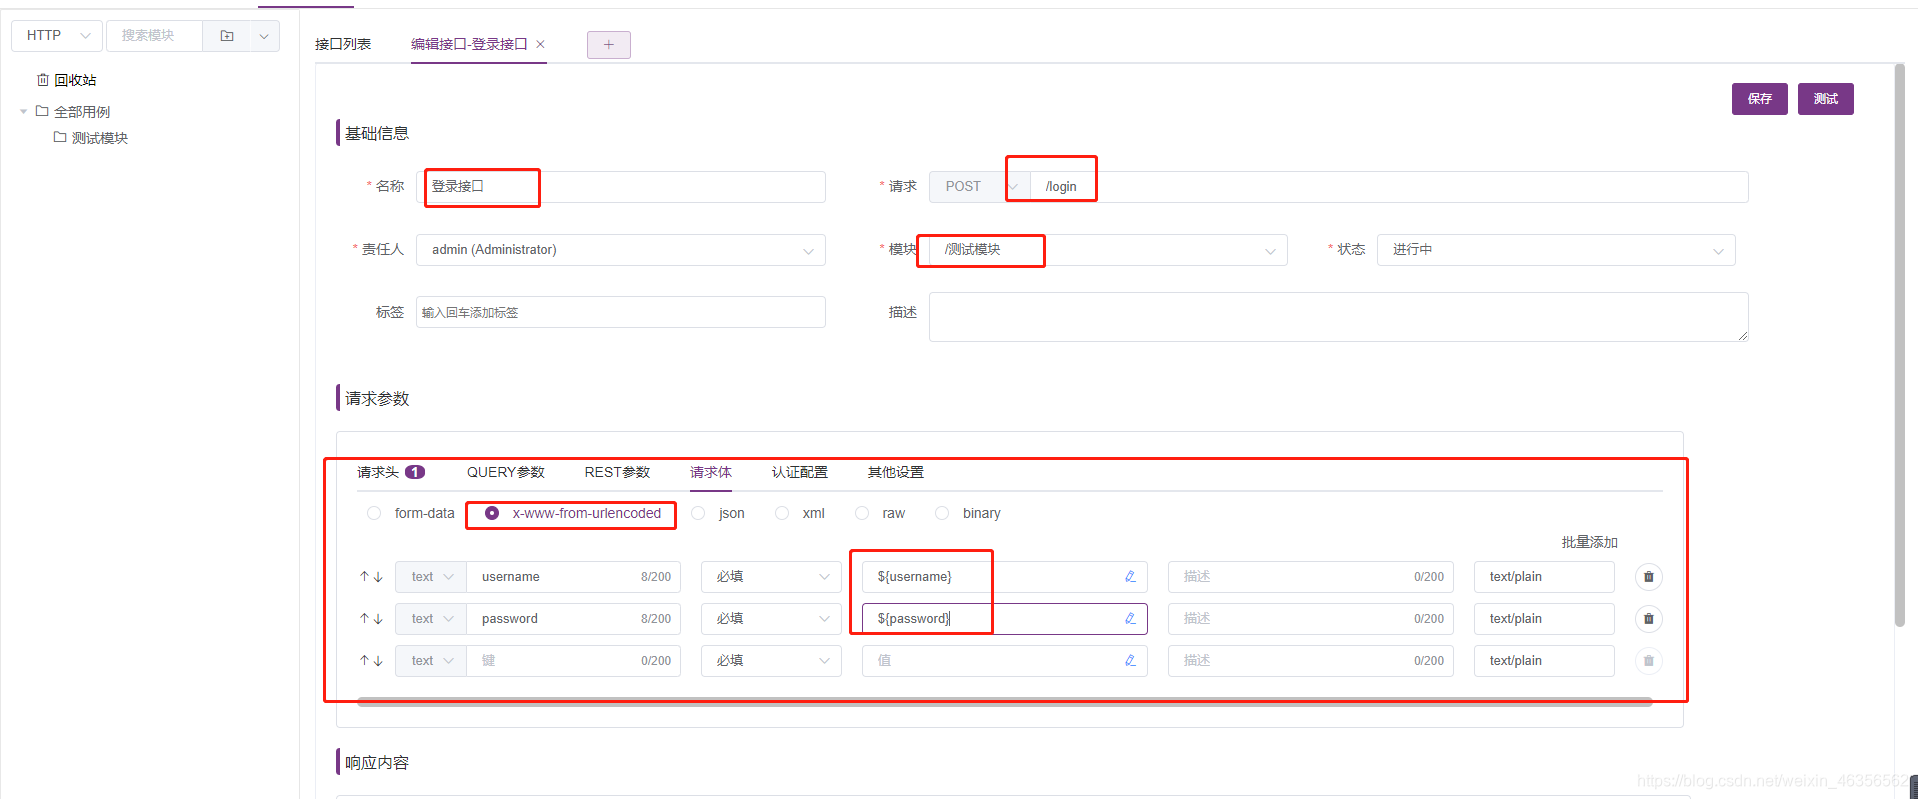
After entering the information as shown above, click Save.
Note: For the values of username and password, I used ${} as a placeholder here (equivalent to making two variables, also called parameterization). In order to deal with subsequent interface tests, different users may log in , Then you can use other methods (global variables, scene variables, CSV Data, etc.) to pass in here instead of directly writing in the interface definition.
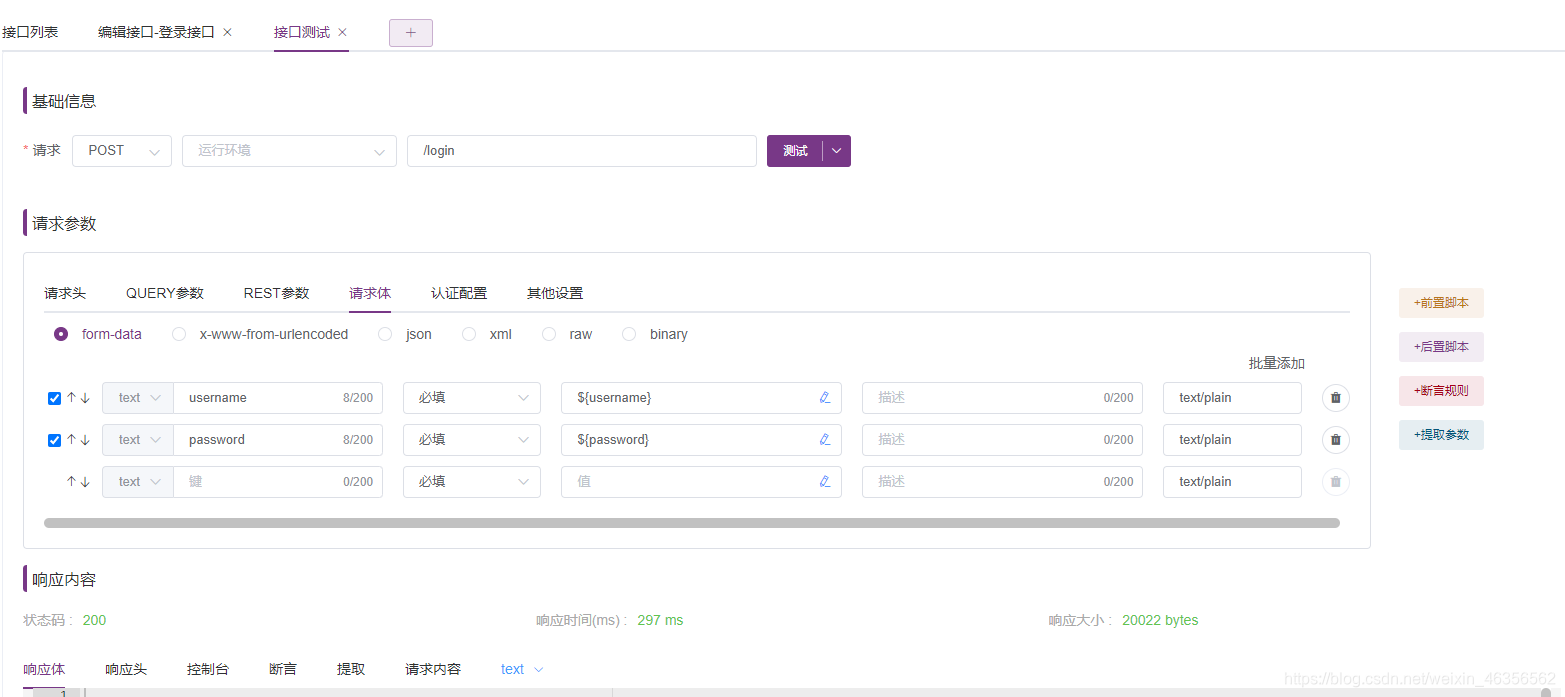
Enter the debugging page and prepare for debugging:
After saving, click the "Test" button in the upper right corner to enter the interface debugging interface:
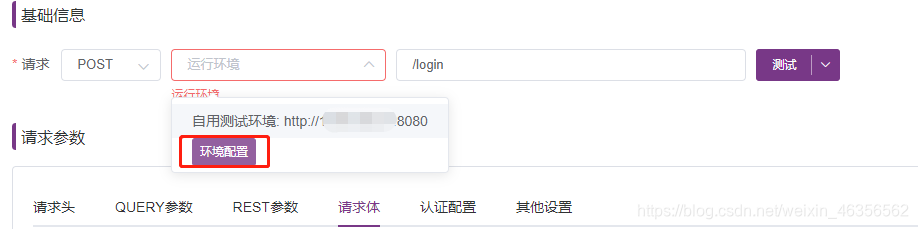
Configure a running environment:
Click the drop-down box of the operating environment and select the environment configuration:
Operating environment: We may have multiple environments for the same application in the actual project, such as development environment, test environment, pre-release environment, production environment, etc. As long as these environments have the same code, the basic information of the interface is the same. Separating the HOST and PATH in the interface address is also for running in different environments without frequent modification of the interface definition.
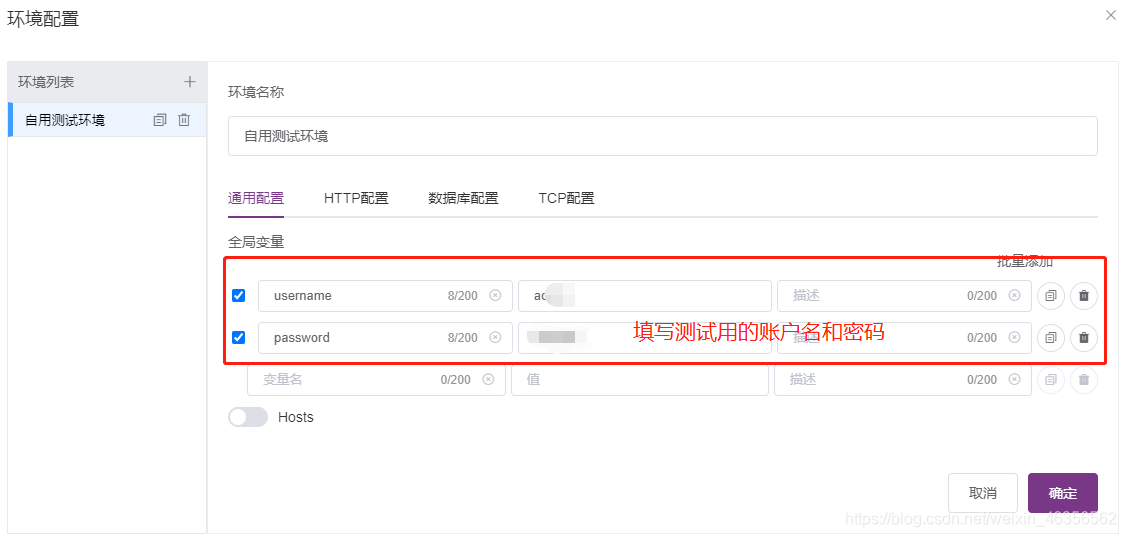
The global variables in the general configuration are a way to enter parameters, corresponding to the two variables we configured in the interface definition.
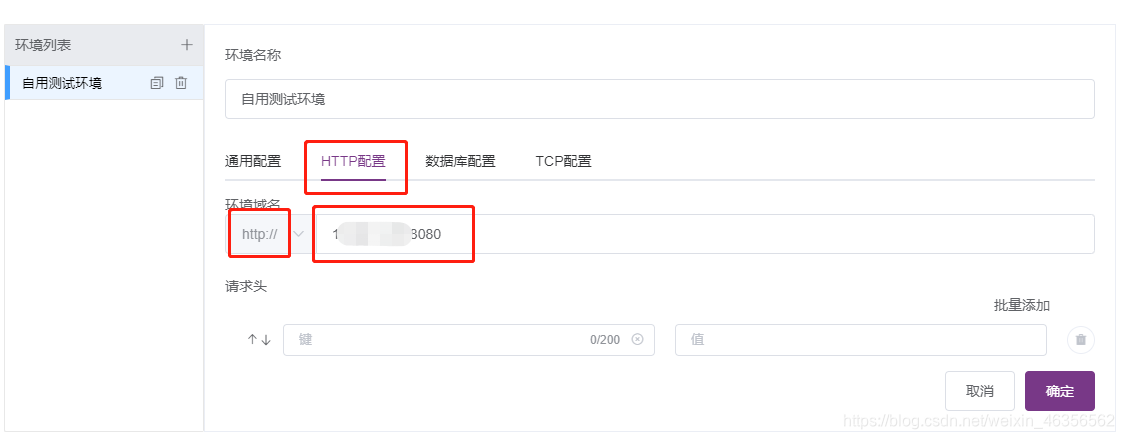
HTTP configuration is the domain name or IP port of the environment, database configuration and TCP configuration, which are not introduced in this chapter.
Perform interface debugging:
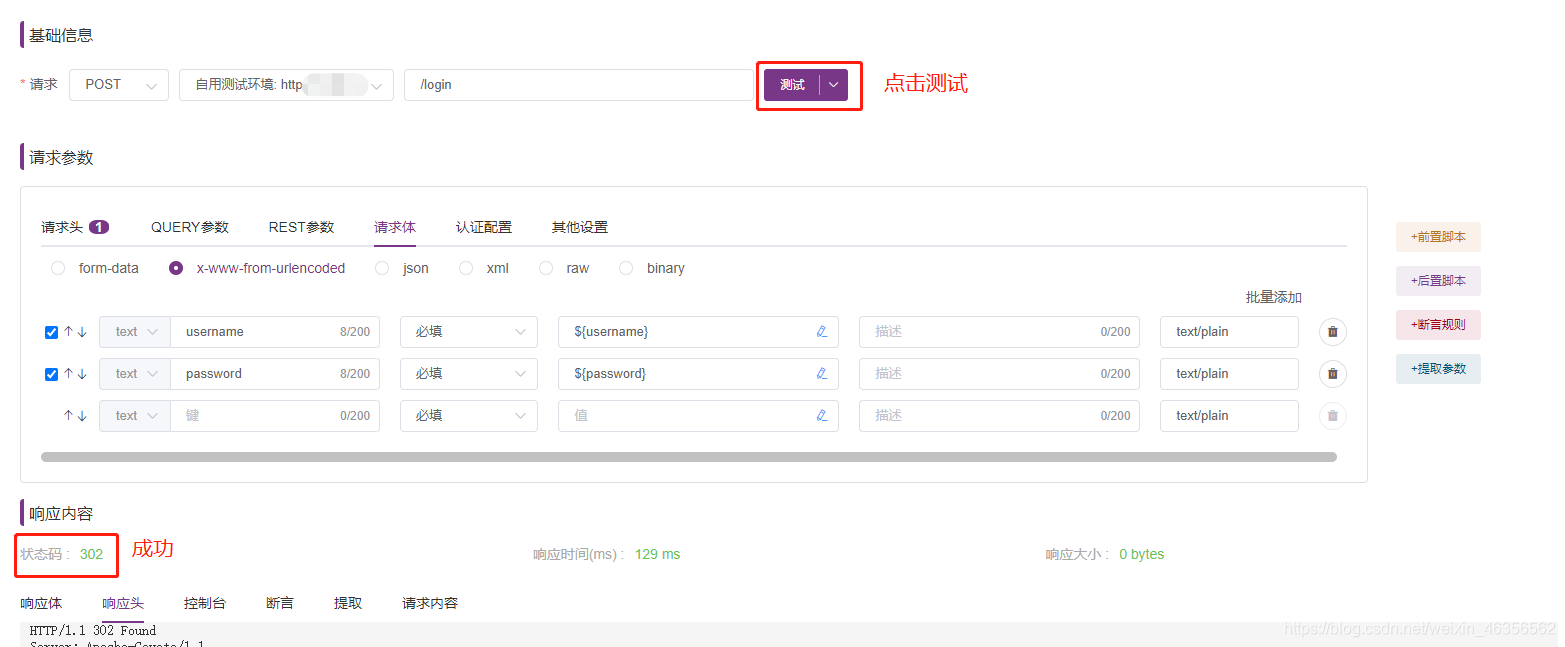
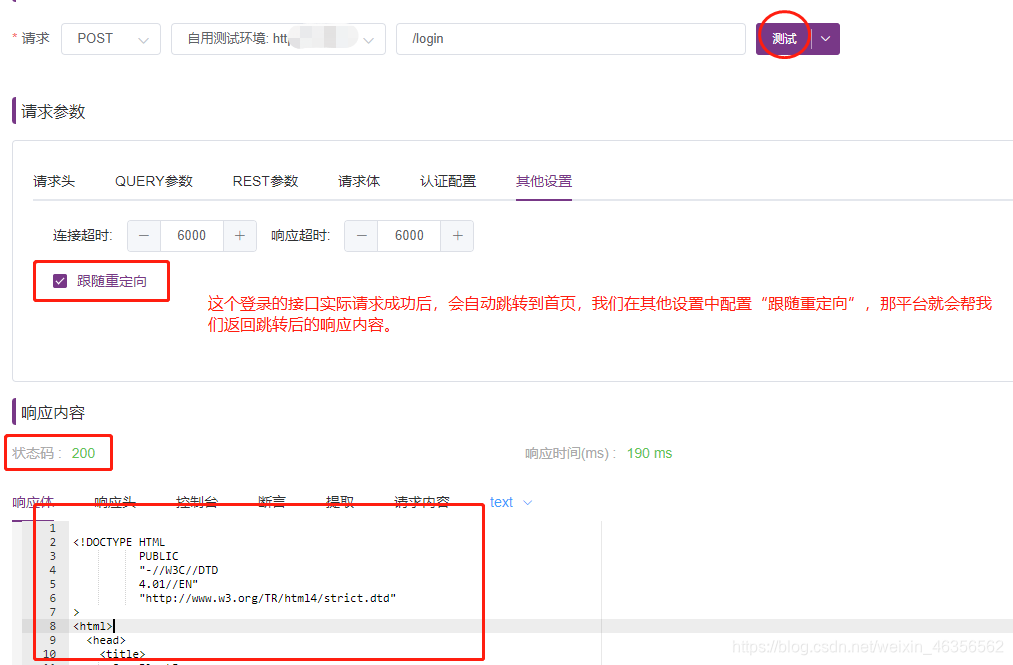
Here is 302, indicating that this interface will automatically jump after a successful response, so is there any way to make its response content the content after the jump? as follows:
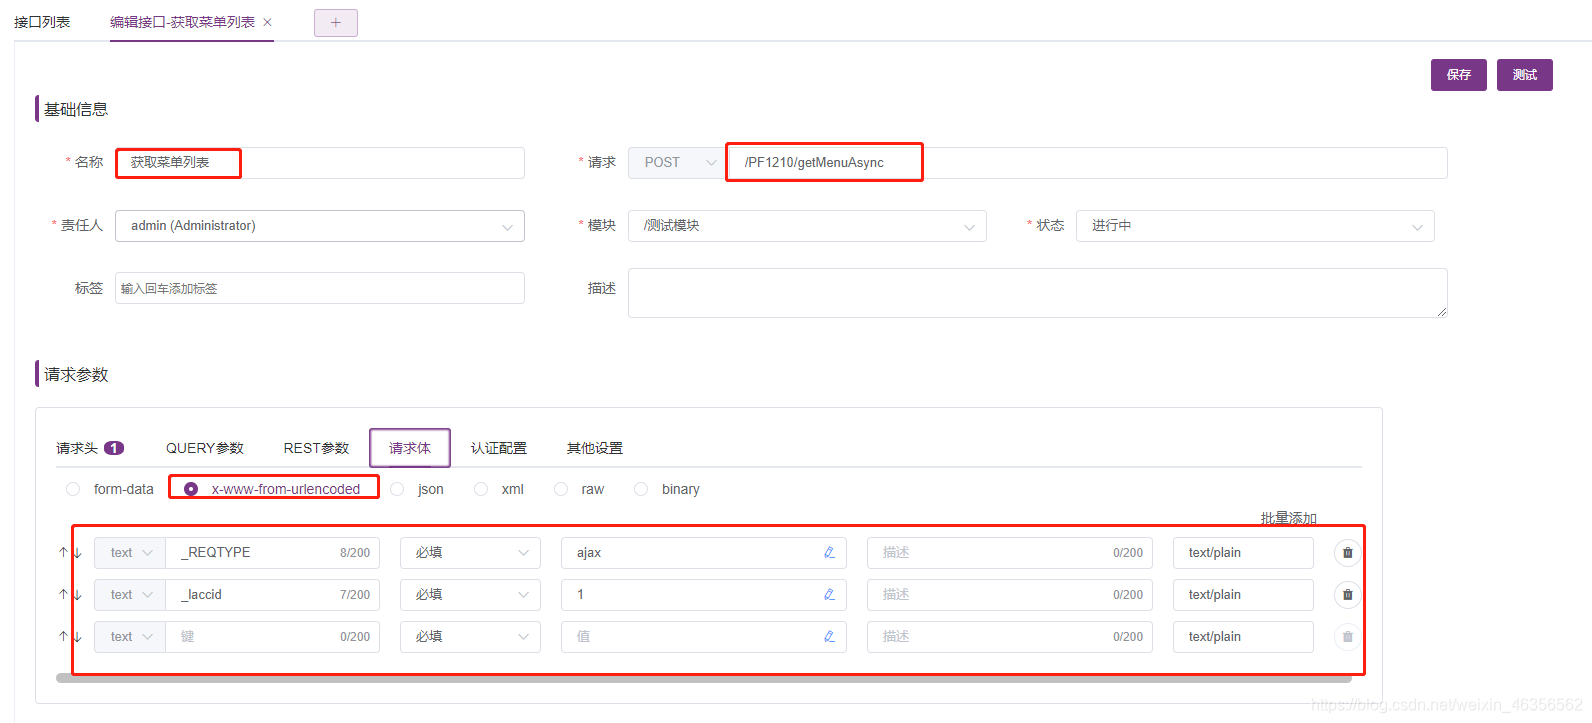
Create the second interface (get the menu list)
Refer to the first interface, and then enter the second business interface according to the interface information, as shown in the figure below:
After creating it, let's debug this interface as well:
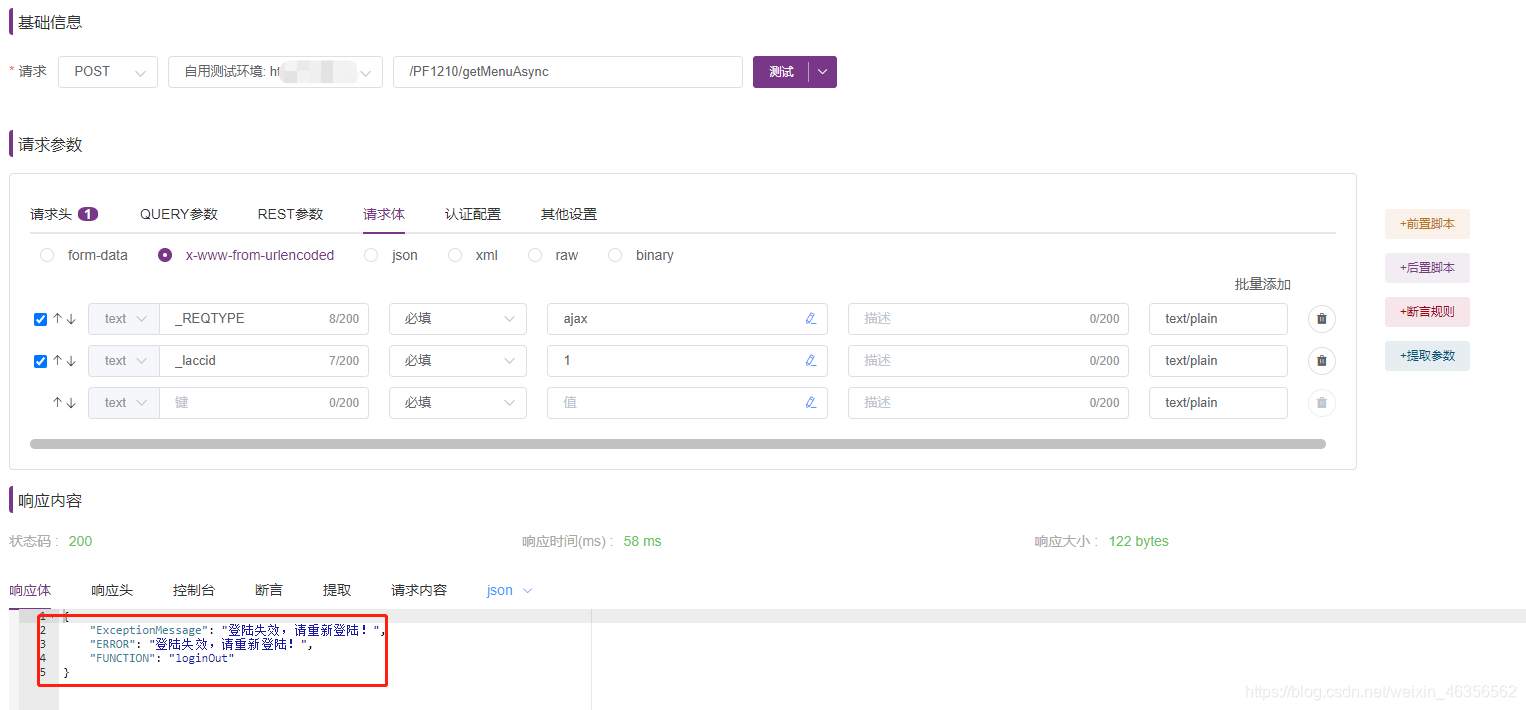
At this time, we directly access this interface, and it returns that I am not logged in, so if we want to test this interface, we need a prerequisite, that is, login.
Scenario-based interface testing
The above example is actually a simple scenario-"After logging in, get the menu list of the currently logged in user", we can use the interface automation in Metersphere to test the scenario.
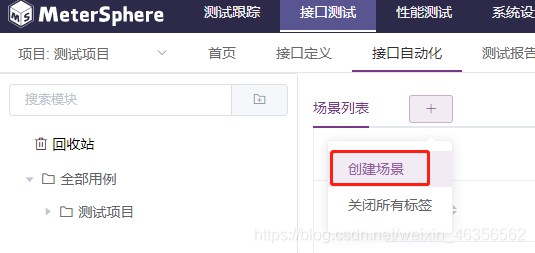
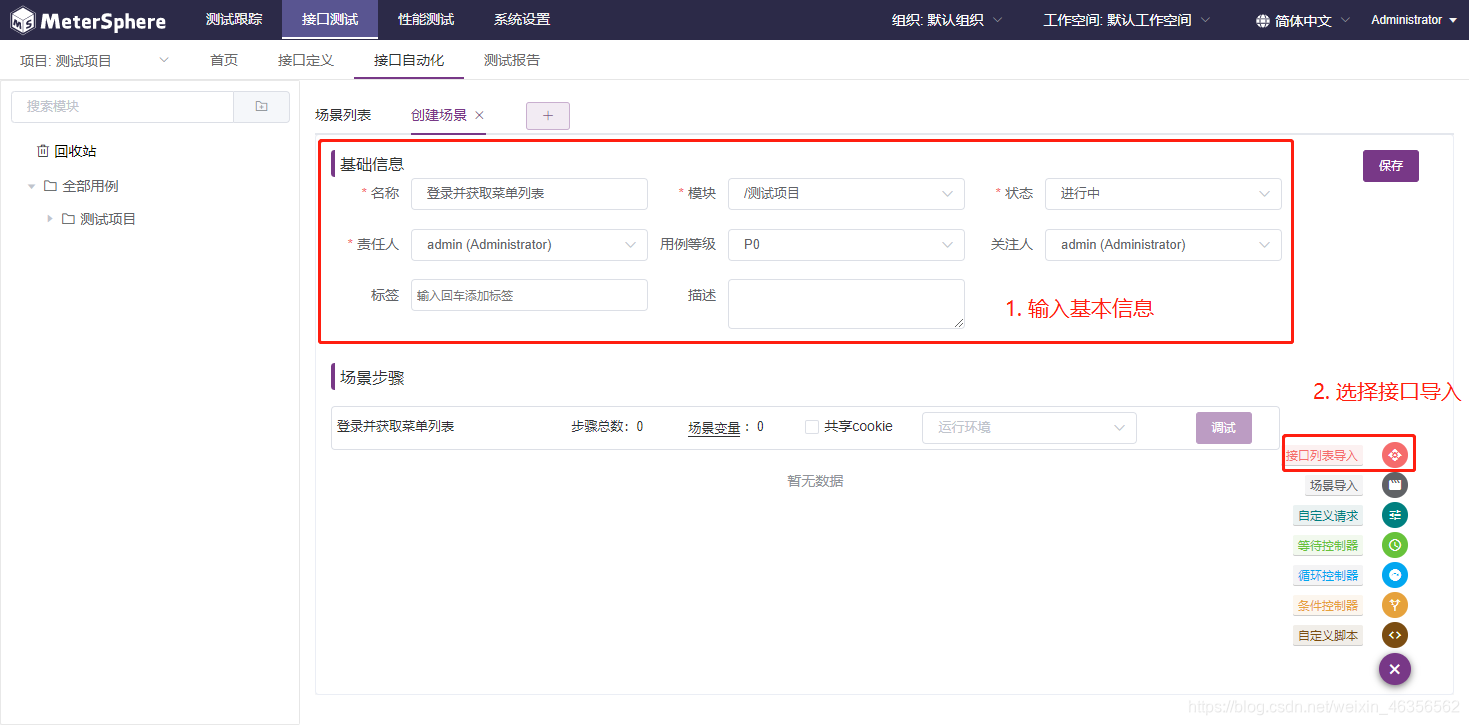
As shown in the figure below, create a scene:
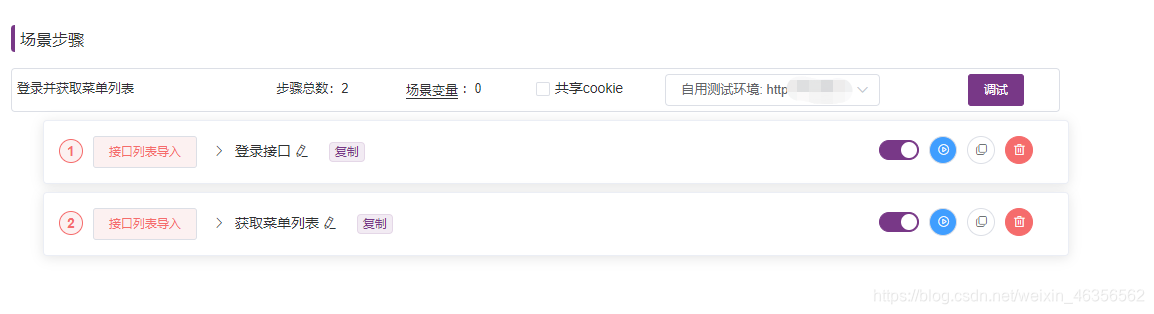
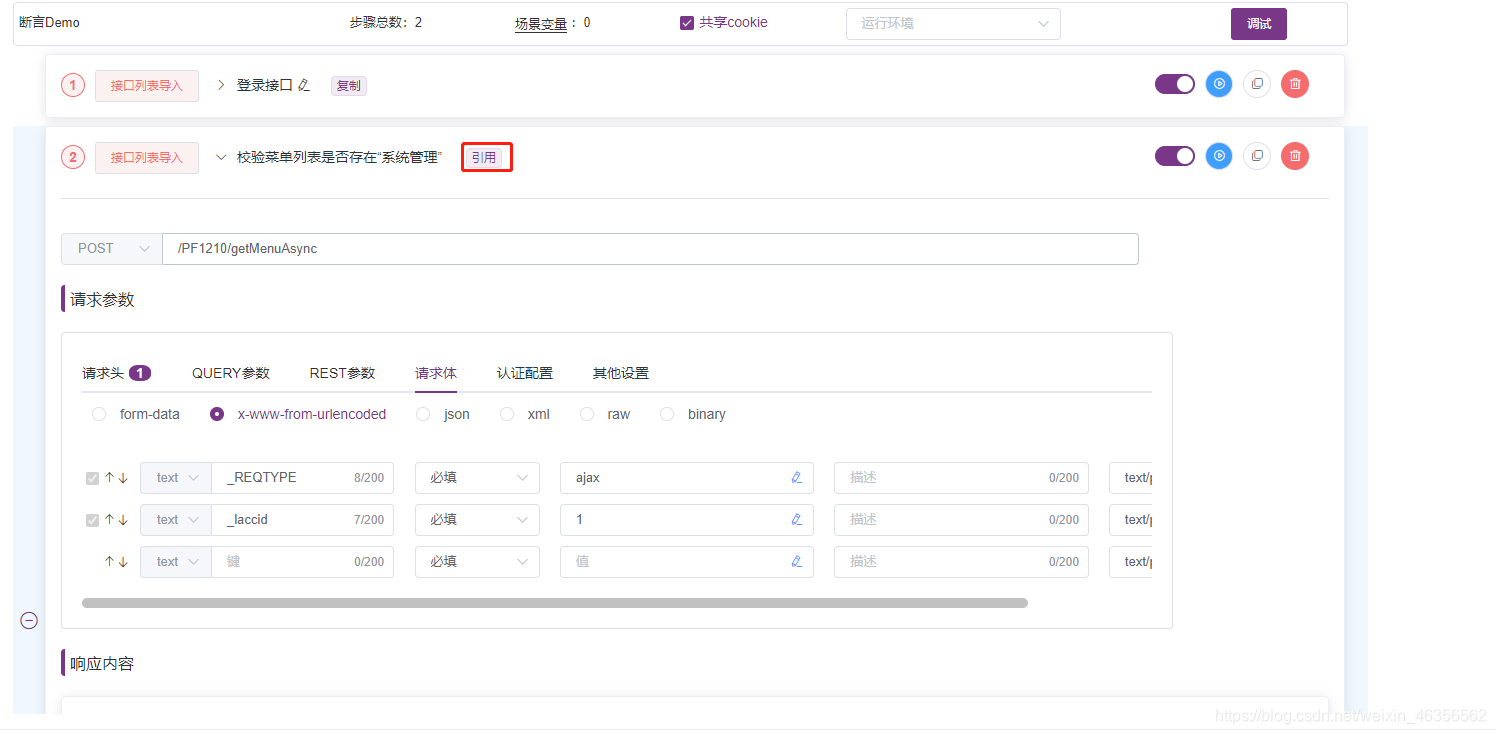
Configure the scene, select the interface list to import:
In the interface definition, select the interface related to the scene and copy:
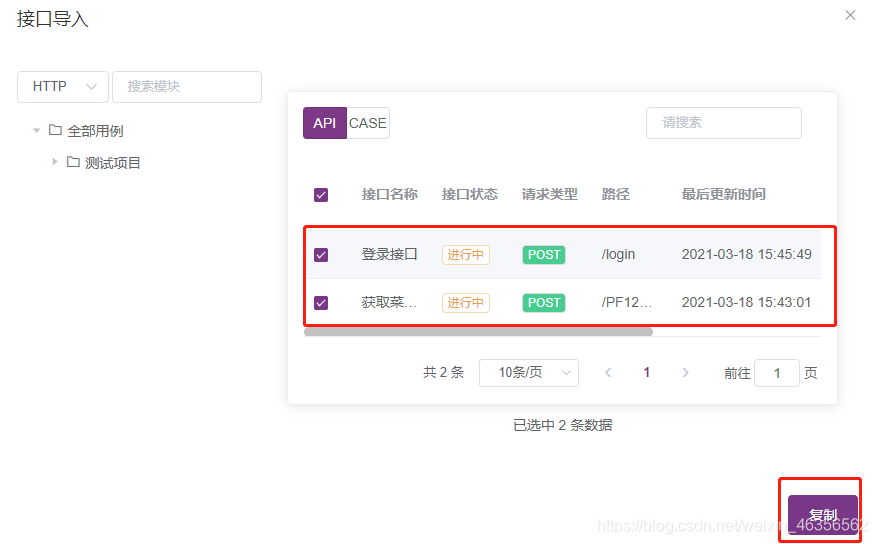
The copied interface is as shown in the figure below, you can see that the interface has been added to the scene steps:
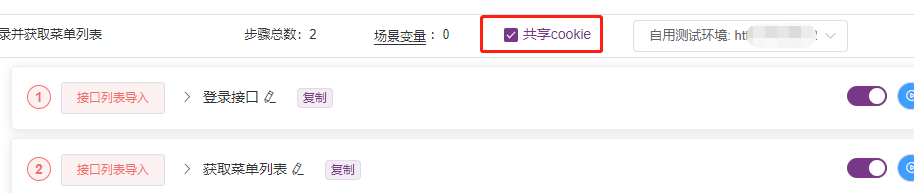
Check "Share cookie" to make these two interfaces use the same cookie:
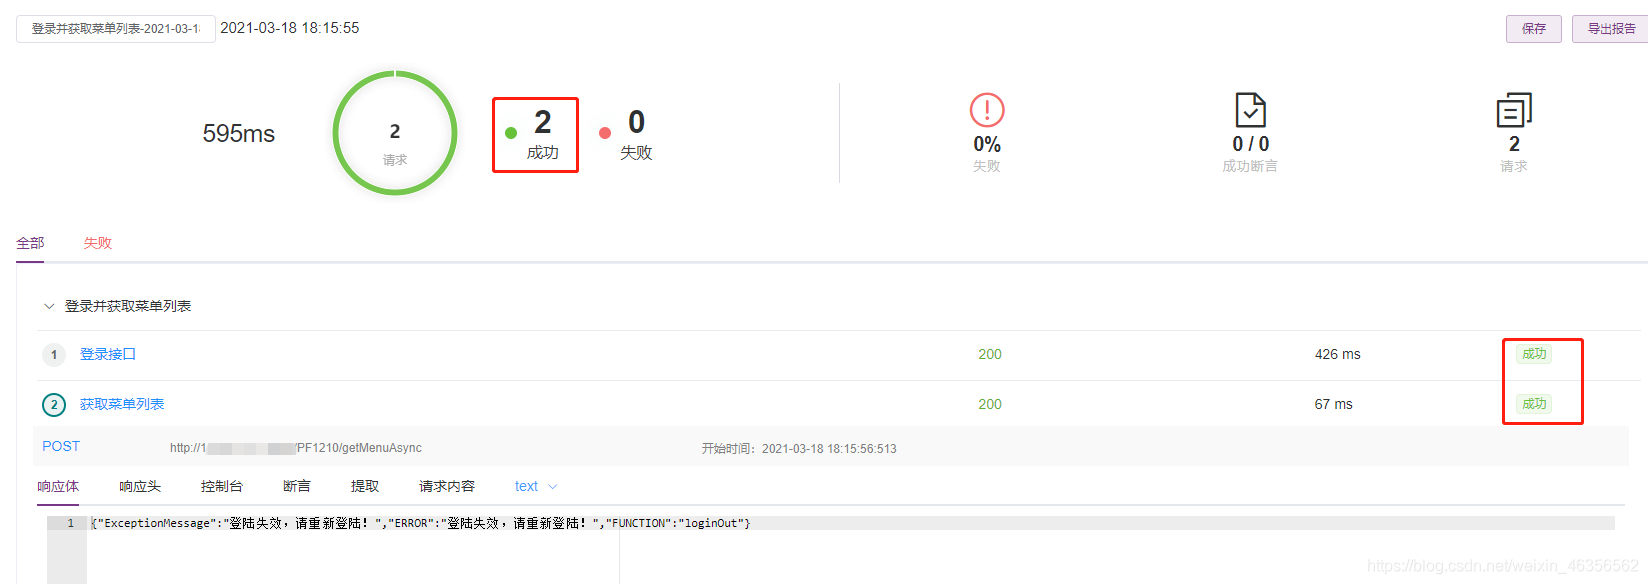
Now you can debug this scene:
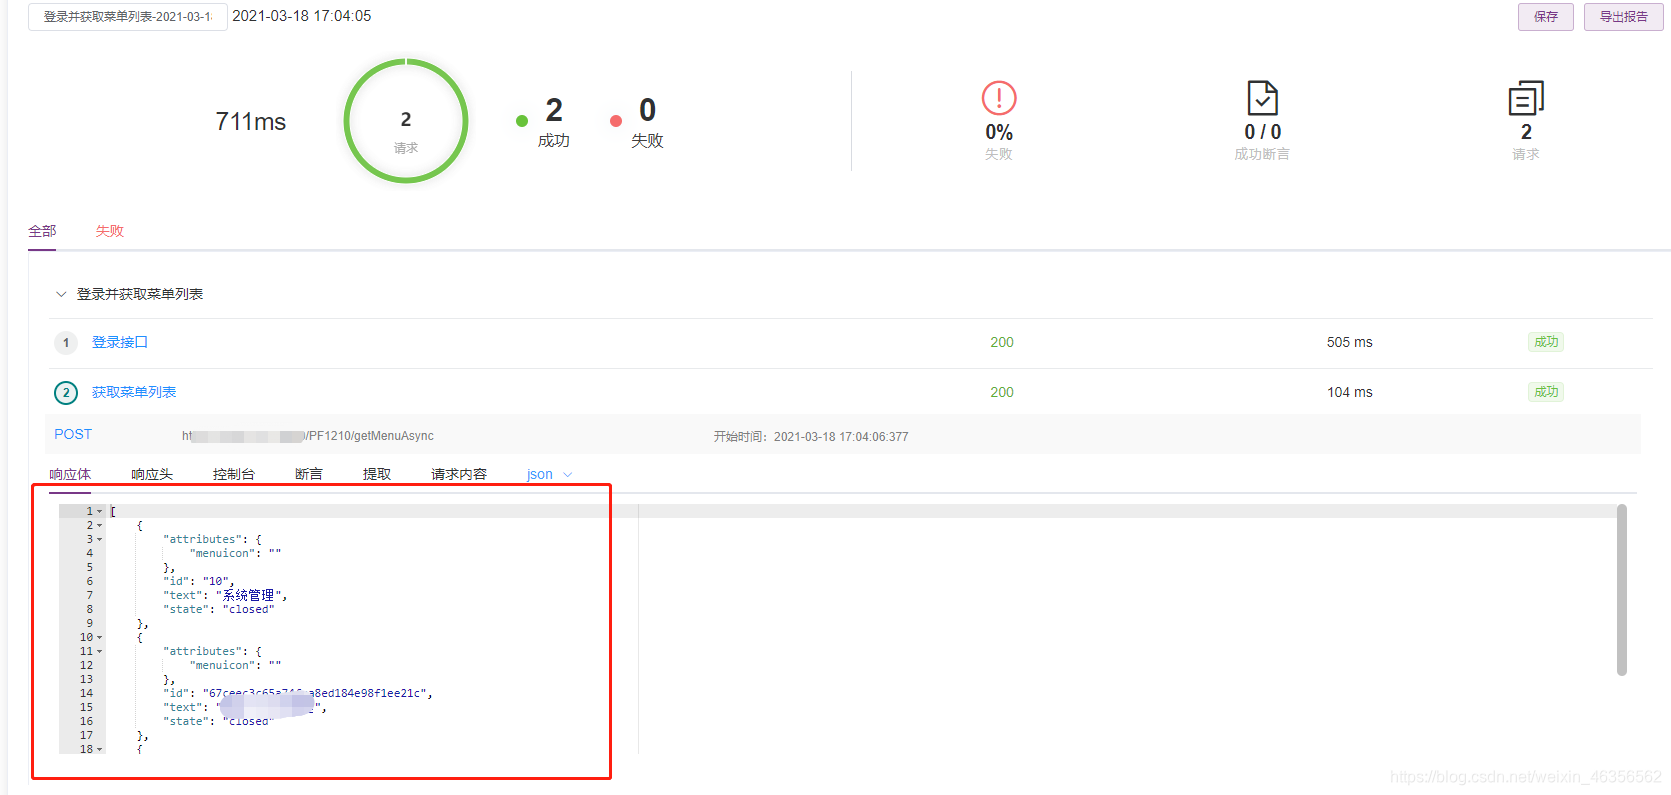
You can see that the menu information is returned correctly, instead of the login failure! !
Let's make a summary
At this point, we have completed a simple scenario test. but! This is not enough! why? When we listed the interface information earlier, we found that the interface is abnormal.
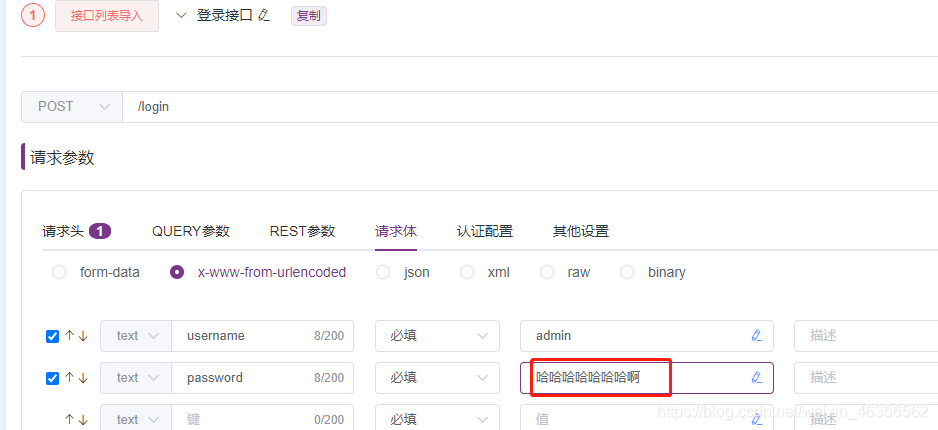
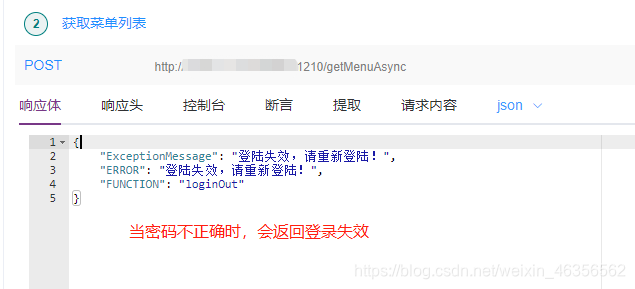
Example of abnormal situation: the login password is incorrect
When our login password is incorrect, perform this interface test again to see what the effect will be. First, change the password casually, just change it to "haha":
Executing this scenario, the results are as follows:
-
Question 1: It is obvious that my interface is reporting an exception, why the test result is still successful?
Answer: In MeterSphere, there is only one judgment for the execution result of the interface, and that is the response code. When the response code is 2xx or 3xx, Metersphere considers it to be successful.
-
Question 2: How can I make the test result judge the success or failure based on the return value?
Answer: Of course it is an assertion!
Add assertion
Let me first ask: what is an assertion?
Answer: It is used to check whether the response data obtained in the test meets expectations, to ensure that the data interaction during the test is consistent with expectations. Simply put: it is to compare the actual output with the expected result. The actual result is requested by MeterSphere, and the expected result is given by ourselves (interface documents, etc.).
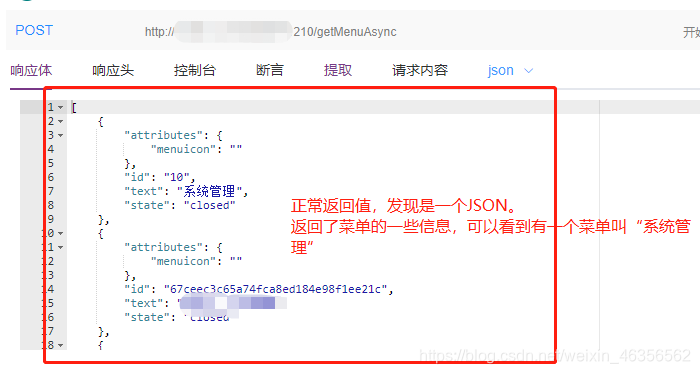
Let's take a look at the normal and abnormal return values of our business interface (getting the menu):
normal:
abnormal:
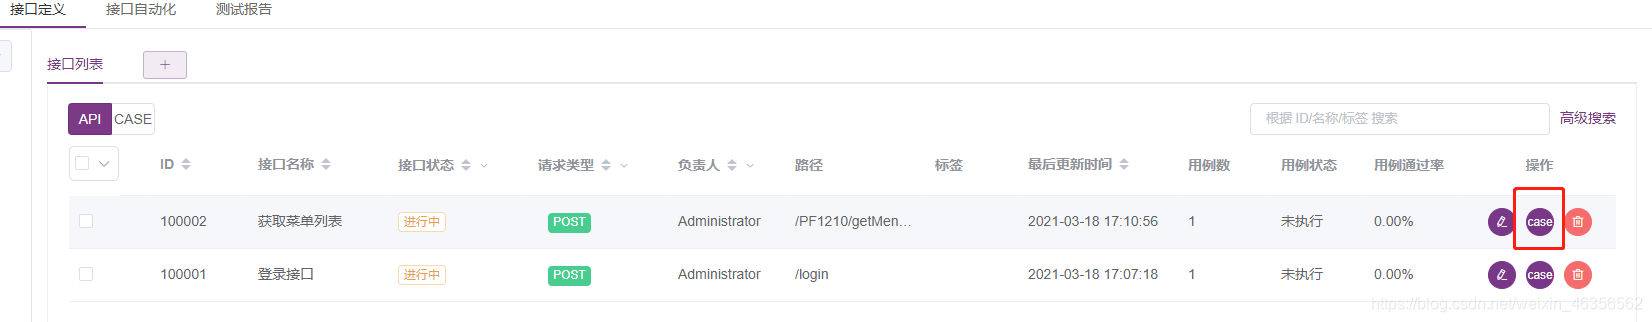
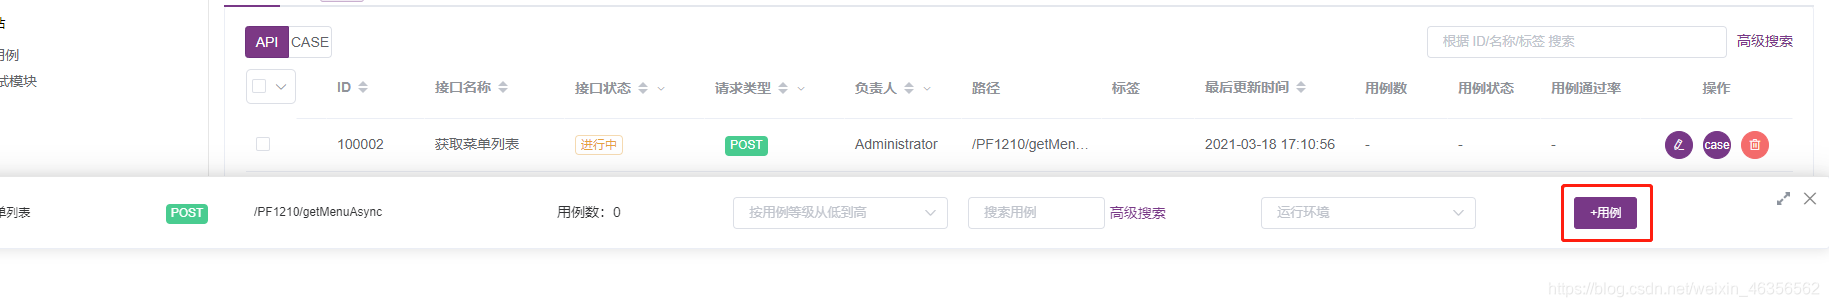
After knowing the normal and abnormal return information, we can judge the correctness of the interface response based on the phenomenon. Before using the assertion, we can create an interface use case, as follows:
Click the case icon on the right:
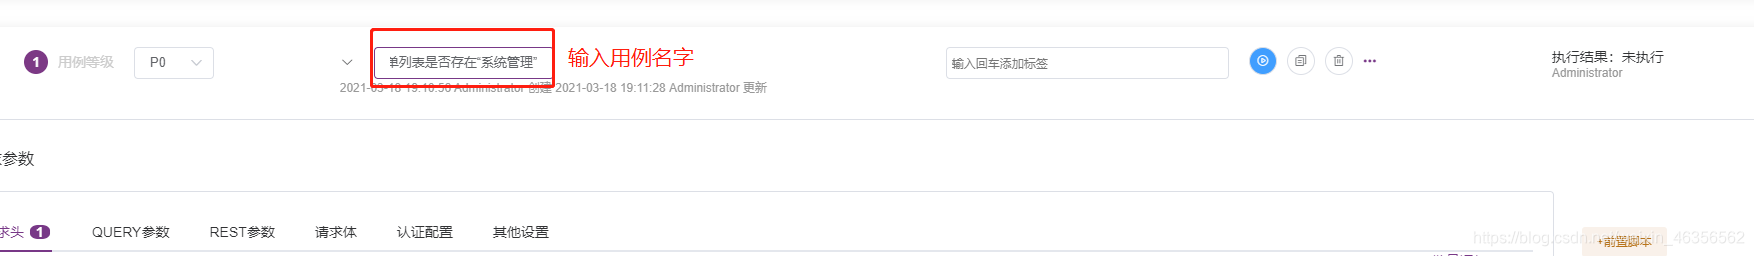
On the small pop-up form, click + Use Case, and enter the name of the use case "Verify whether there is "System Management" in the menu list":
After the use case is prepared, you can configure the assertion. The following describes the commonly used assertion methods.
1. JSONPath Assertion
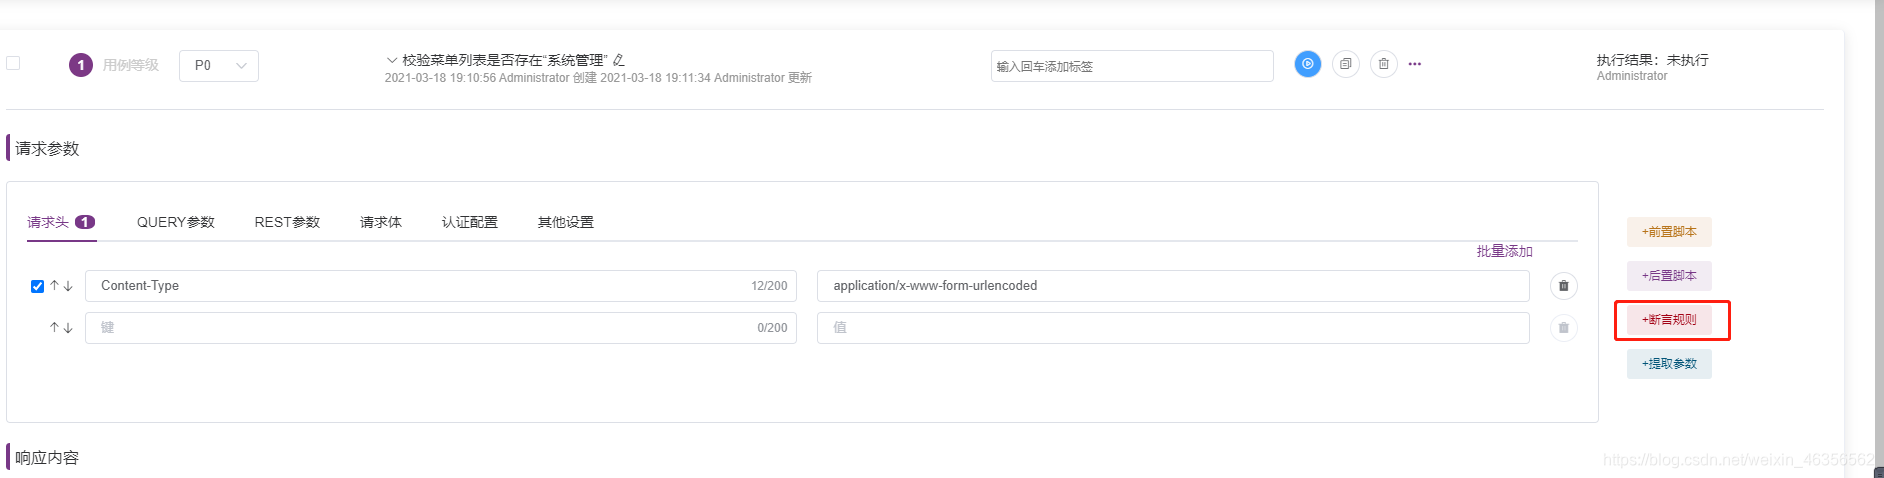
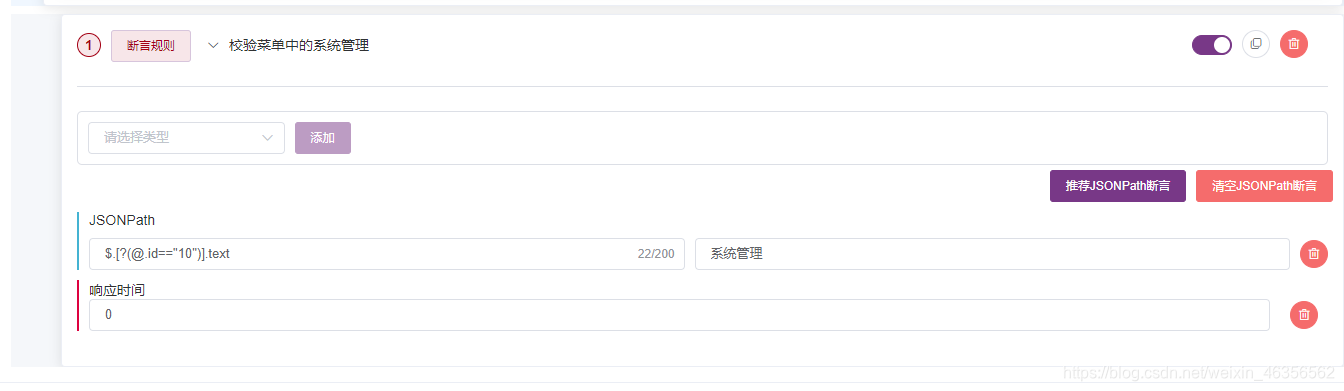
Then edit the use case and click "+Assertion Rule" in the figure below:
Then scroll down the mouse wheel and edit this assertion rule as follows:
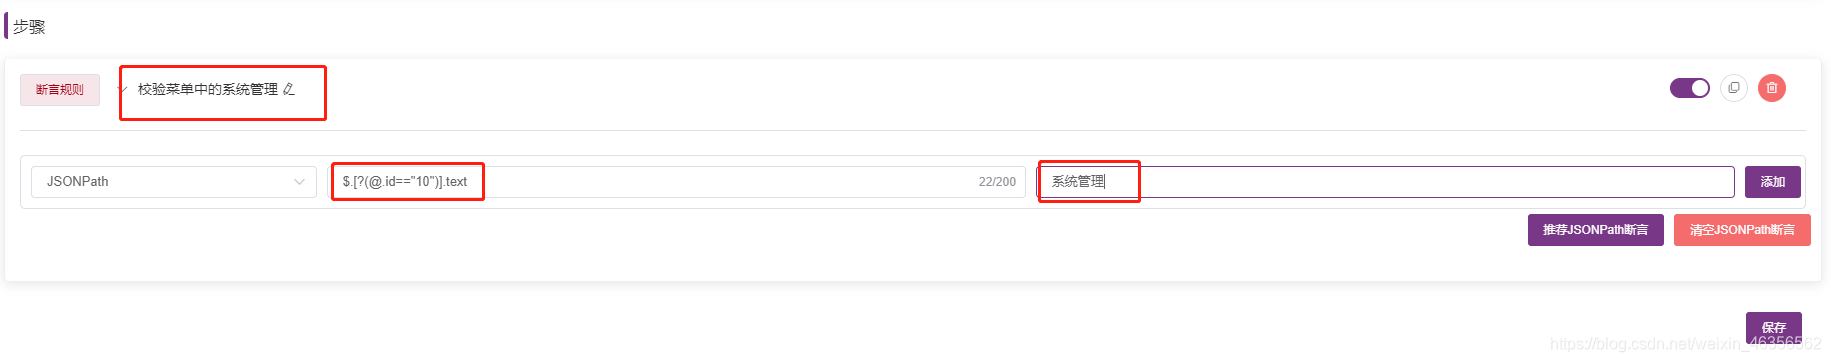
Explanation: The object of the assertion rule is the content of the response after the interface is executed. As shown in the normal return value diagram demonstrated at the beginning of this section, the return value is exactly a string of json. When developing programs for normal R&D, JSON strings need to be converted into json objects, and then methods such as fastjson tools can be called to get the fields in the json object. And MeterSphere provides a jsonpath gadget here, which can achieve the effect of parsing json by writing a small series of expressions. The expression in the above figure [$.[?(@.id==“10”)].text] means to extract the text value of the record with id 10 in the response result json, and then we give him an expected value, if If the expected value matches the actual value, the assertion is successful.
Supplement: JsonPath grammar reference: Use JSONPath to parse JSON full content detailed explanation
Then let's create a new scenario to test in interface automation:
Introduce the use case just created in the scene, click the small + sign on the left, and scroll down to see the assertion rules:
Execute the scene and take a look at the result, as shown in the figure below:
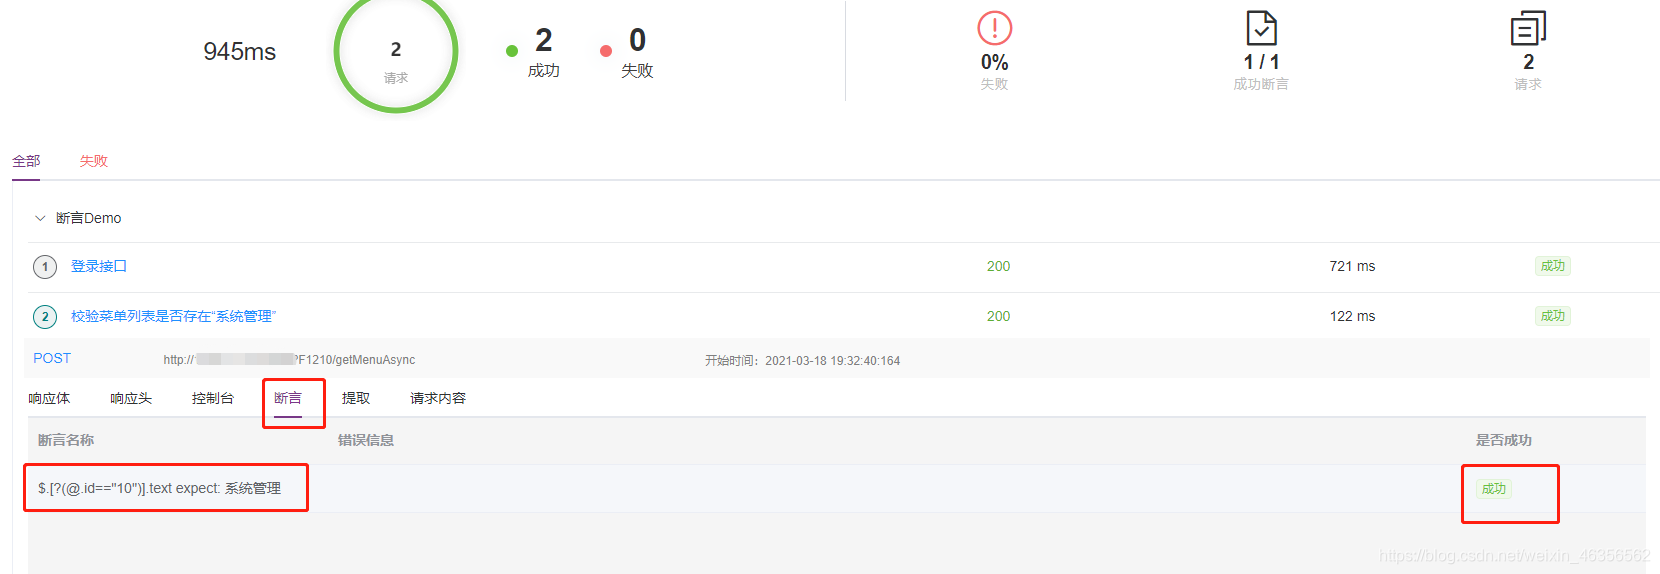
You can see that the assertion was successful. If we deliberately write the assertion result incorrectly (for example, change "system management" to "haha"), let's take a look at the result:
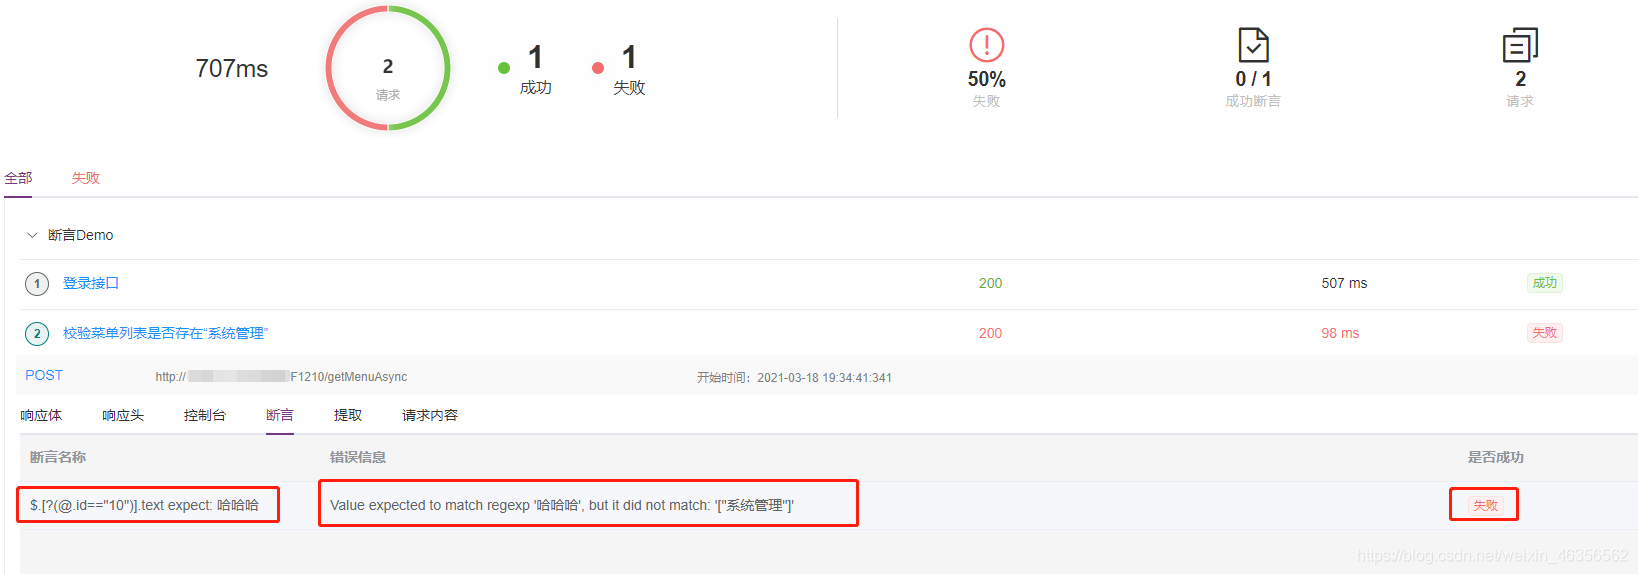
At this time, the assertion fails, that is, the interface does not meet the expected result.
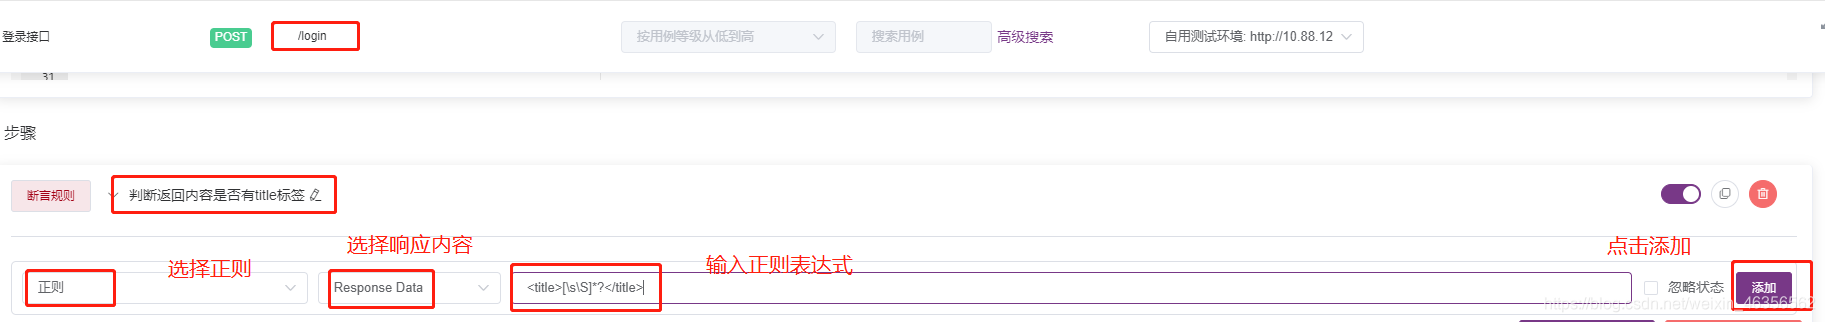
2. Regular expression assertions
Refer to the above steps to add a use case to our login interface, and add assertion rules! There is no need to re-demonstrate how to add use cases, Orz...

Let’s get back to the subject: We choose the regular expression assertion this time. We know that if the login interface is successful, it will automatically jump to the home page (the return value is a large string of html text). We can determine that there is a <title> tag in the return value. Think that the login is successful.
Example of regular matching <title> tag: <title>[\s\S]*?</title>
Regular expression reference article: Java regular expression
Execute the use case and see the result:
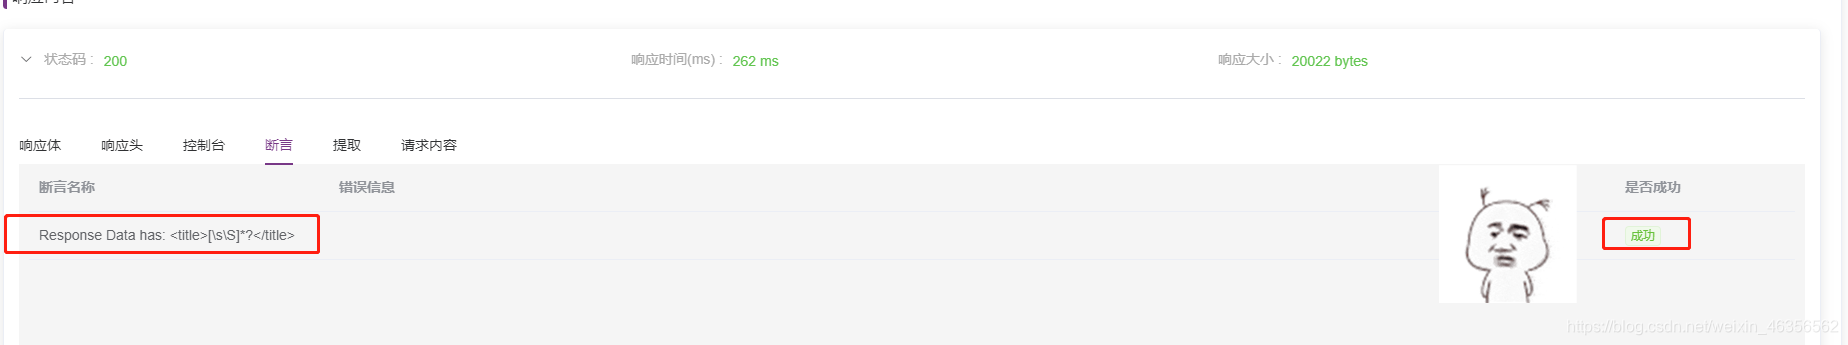
As you can see in the above figure, the assertion is successful. We can turn off follow redirection to simulate not returning to the homepage and see if this assertion can take effect:
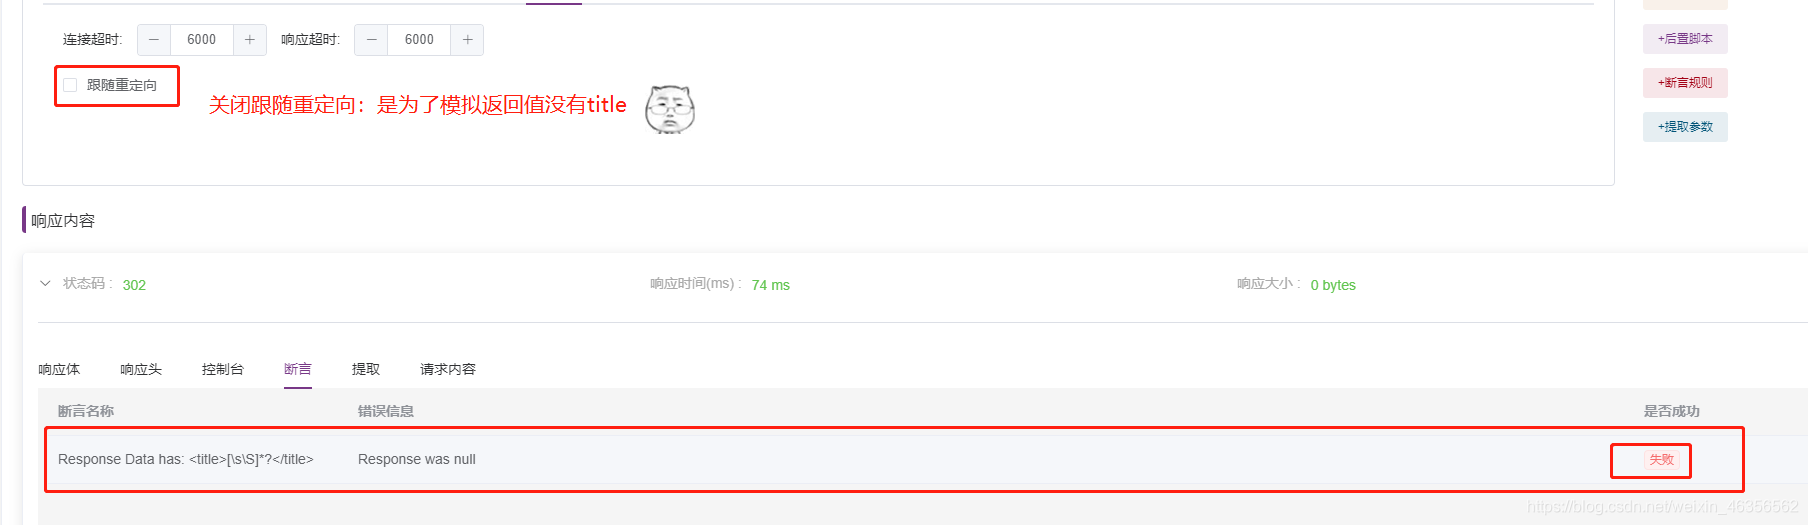
As you can see in the above figure, because the interface response value is empty, it can't find the title, so the assertion fails!
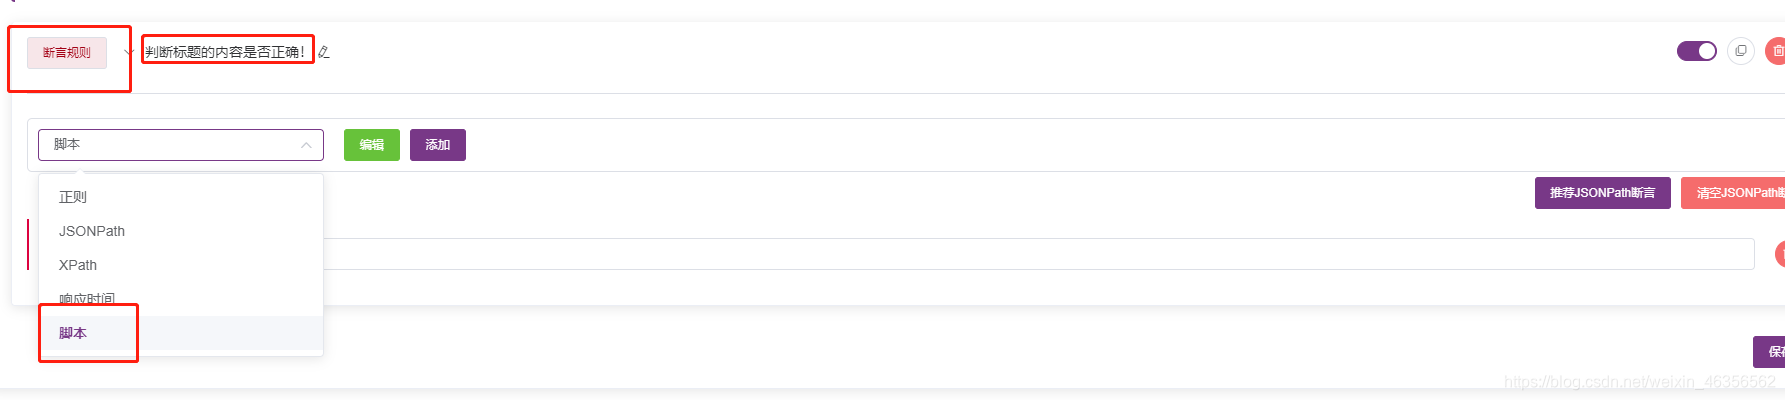
3. Custom script assertion
Ahem, come on, let's continue to polish our login interface!
Just now we used regular expressions to determine whether the returned content has the title tag, but we did not verify whether the title is correct (in case it does not match the expected result, do you say it), this should be possible with regular expressions, but I Just use a custom script for a demonstration.
Add an assertion rule, the title is called "Judging whether the content of the title is correct", select the script:
Then click the edit button to enter a code editor as shown below:
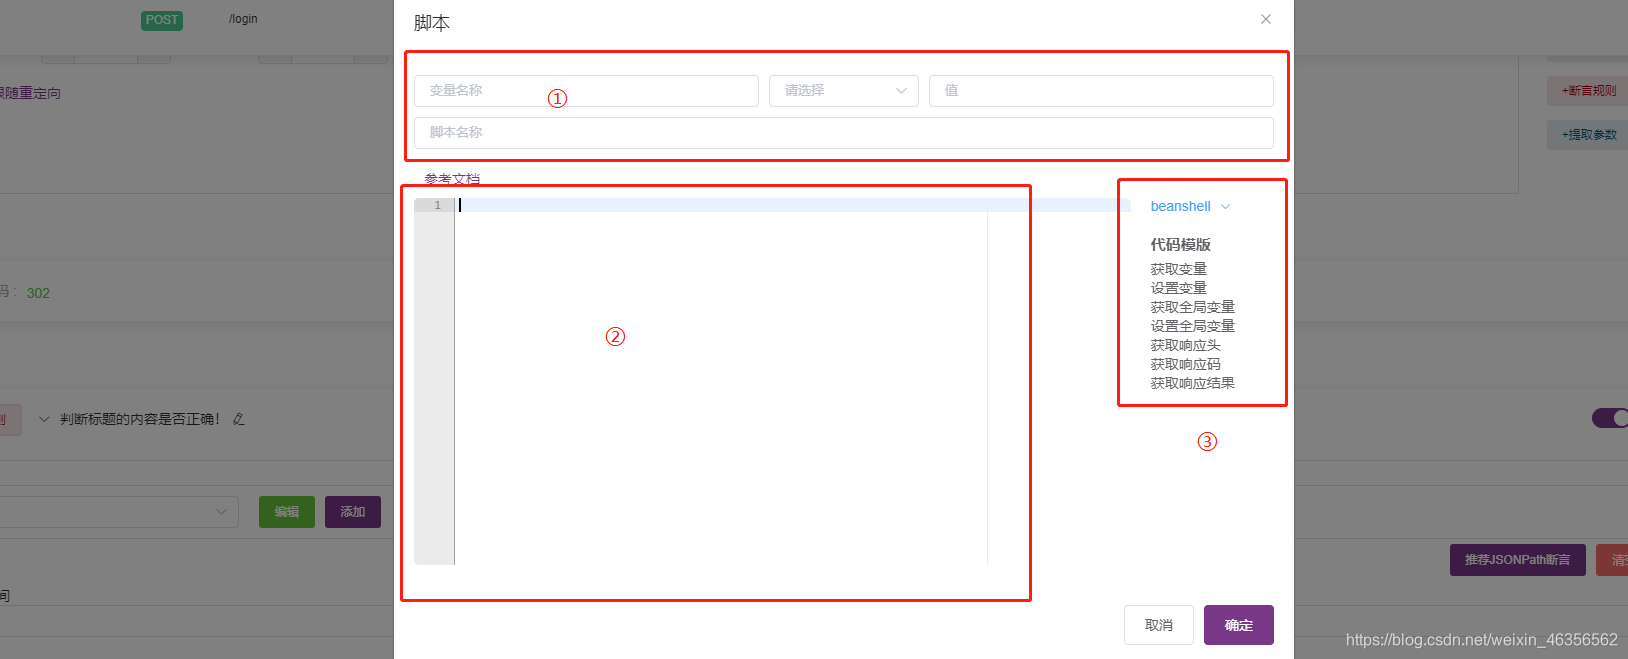
Figure ①: After researching, I found that the first line was originally a small code generation tool. Fill in some parameters. The following ② will help you generate sample code. I have to make a spit here. The official at least gives a hint (for example, a question mark in the upper right corner...), what configuration item I thought it was. The second line is the script name, just for display.
Figure ②: Code window, nothing to say.
Figure ③: It is also a code generator, click to generate a small sentence of code.
We enter the following code in the script window ②:
//获取当前请求的响应内容(以字符串形式返回)
String responseData = prev.getResponseDataAsString();
//titleHtml是我的预期值
String titleHtml = "<title>SyncPlant5</title>";
//判断响应的内容是否包含我的预期值
if(!responseData.contains(titleHtml)){
msg = "哇,竟然断言失败了,返回的内容没有包含:"+ titleHtml;
//AssertionResult是Jmeter提供的断言对象
AssertionResult.setFailureMessage(msg);
AssertionResult.setFailure(true);
}else{
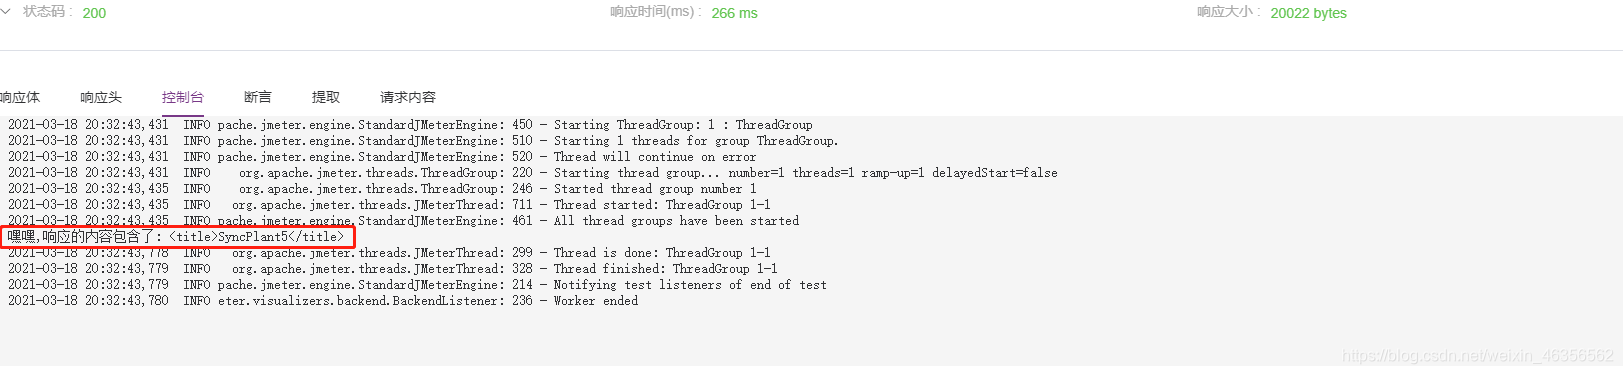
//控制台打印一行内容,断言成功,可以在控制台看到哦
System.out.println("嘿嘿,响应的内容包含了: "+titleHtml);
}
The above script is beanshell syntax, which is actually java code. Beginners may be wondering how I know that prev.getResponseDataAsString() can get the response content. In fact, the work of performing interface testing at the bottom of MeterSphere is handed over to Jmeter. As long as Jmeter supports it, it will support it. At this time you have to ask again, what encapsulated objects or methods does jmeter have for us to use?
Commonly used built-in objects are: ctx (context information), vars (JMeterVariables, manipulate jmeter variables, this variable actually refers to the local variable container in the JMeter thread), AssertionResult (assertion related objects), prev (get the previous sample returned Information), log (print log, write information to jmeber.log file)
ctx address: http://jmeter.apache.org/api/org/apache/jmeter/threads/JMeterContext.html
vars address: http://jmeter.apache.org/api/org/apache/jmeter/threads/JMeterVariables.html
prev address: http://jmeter.apache.org/api/org/apache/jmeter/samplers/SampleResult.html
AssertionResult address: https://jmeter.apache.org/api/org/apache/jmeter/assertions/AssertionResult.html
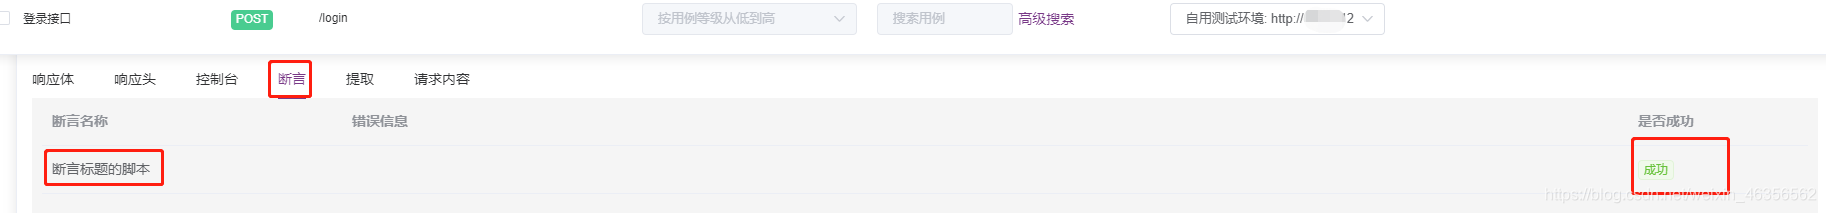
Finally we execute the test case:
Take another look at the console, there is a print!
to sum up
MeterSphere is so pleasant to use! That's it for today, there will be more to follow! Stay tuned!

Relevant information:
Official document: https://metersphere.io/docs/index.html
Official website: https://www.fit2cloud.com/metersphere/index.html
Open source project address: https://github.com/metersphere/metersphere/