1. Whole machine: top, uptime, simplified version of system performance commands
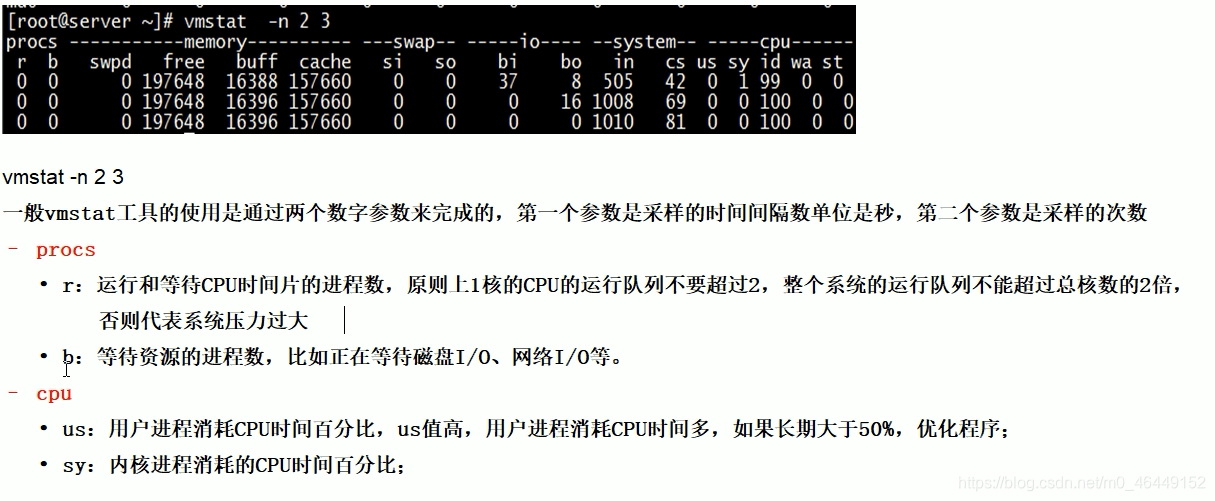
2. CPU: vmstat
view cpu

view all CPU core information
mpstat -P ALL 2
usage breakdown information of cpu used by each process
pidstat -u 1 -p process number
3. Memory: free
pidstat -p process number -r sampling interval in seconds
4. Hard disk: df
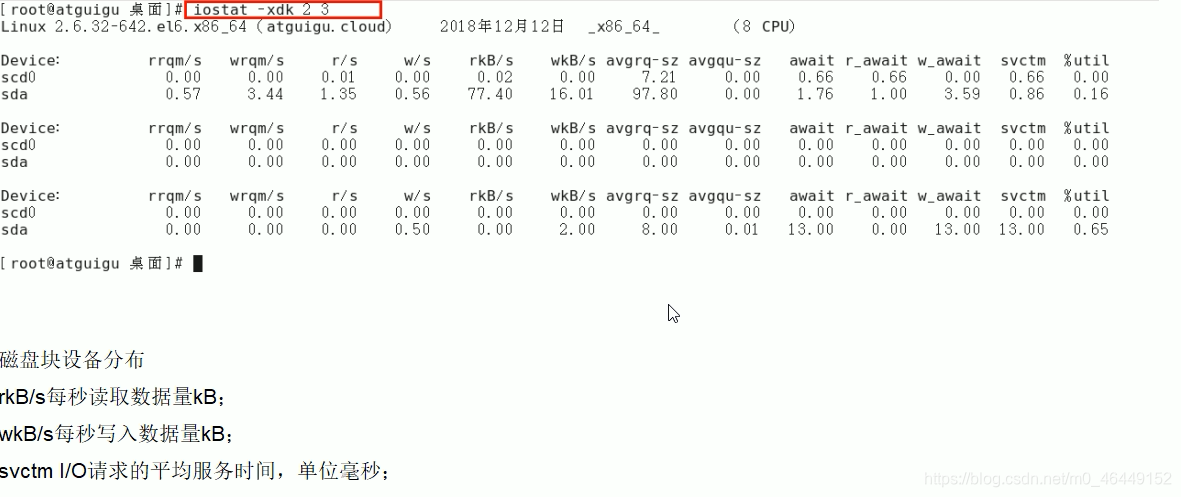
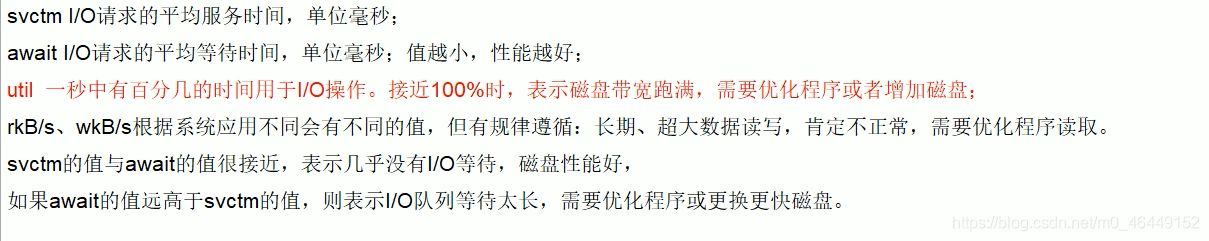
5. Disk IO: iostat
disk I/O performance evaluation.
View extra: pidstat -d sampling interval in seconds -p process number
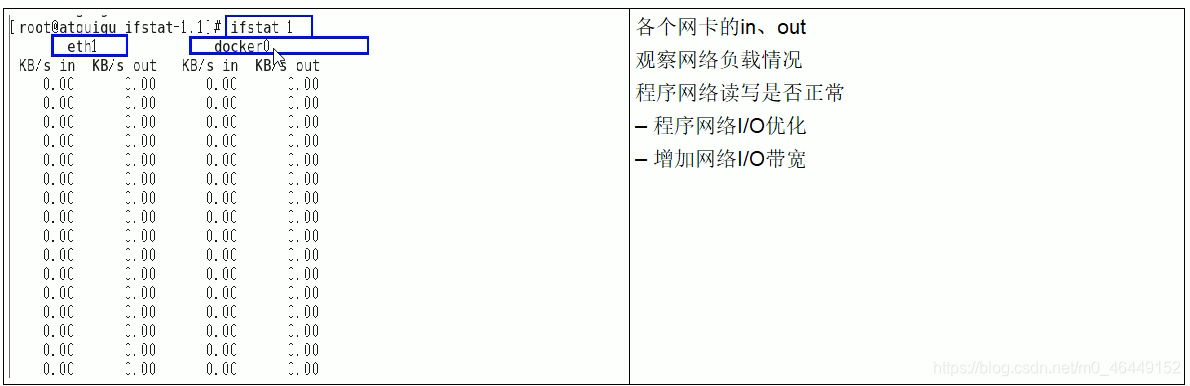
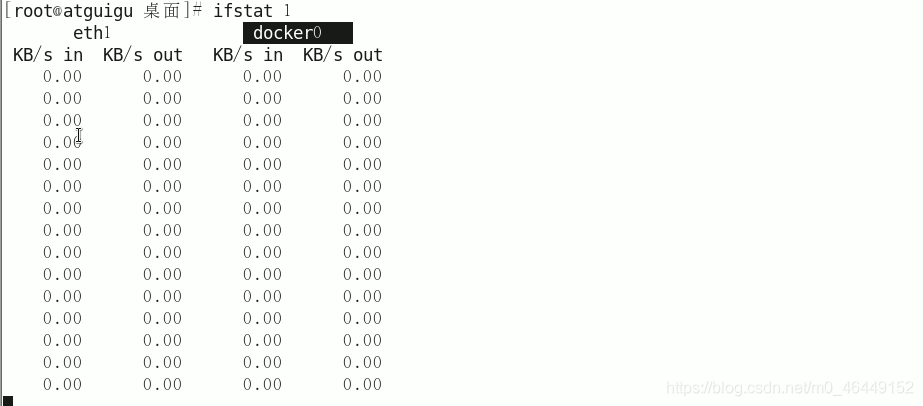
6. Network IO: ifstat
CPU usage is too high, please talk about your analysis ideas and positioning
- First use the top command to find the CPU with the highest proportion
- ps -ef or jps further locates and knows what kind of background program it is
- Locate a specific thread or code
ps -mp process -o THREAD, tid, time
-m display all threads
-p pid process using cpu time
-o after this parameter is a user-defined format - Convert the required thread ID to hexadecimal format (English lowercase format)
printf “%x\n” The thread ID in question - jstack process ID | grep tid (hexadecimal thread ID lowercase English) -A60
JDK comes with JVM monitoring and performance analysis tool
jps (virtual machine process status tool)
jinfo (Java configuration information tool)
jmap (memory imaging tool)
jstat (statistical information monitoring tool)