Dry goods|The principle and implementation of Kafka flow monitoring
Dean Lang Langjian talks about big data
Engineering capability
As an excellent developer, the reliability of the monitoring and warning system in the process of project development can reflect a person's engineering management ability. An excellent monitoring and warning system can save a lot of energy consumption, such as maintenance, fault prediction, timely and accurate fault notification, fault location and troubleshooting.
You can imagine how terrible such a black box is if there is no monitoring and warning system after the project goes online.
For big data projects, data generally needs to enter a message queue, such as kafka, and then separate the line and decouple the data in real time for real-time processing and offline processing. The benefits of message queues:
-
The subscribers of the message queue can be expanded at any time as needed, which can well expand the data consumers.
-
The horizontal expansion of message queues to increase throughput is still very simple. It is still very troublesome to use a traditional database, sub-database and sub-table.
- Due to the existence of message queues, it can also help us to resist peaks and avoid excessive back-end processing pressure during peak periods and the entire business processing downtime.
Kafka plays an important role in big data projects, so its monitoring alarms are very important. We are mainly talking about monitoring alarms for Kafka traffic. Its purpose is also very obvious to help us understand the overall situation and fluctuations of the data. Circumstances to adjust the processing backend, such as spark streaming, flume, etc.
There are many kafka monitoring tools, the common ones are kafka manager, KafkaOffsetMonitor, kafka eagle, kafka tools, etc. The most frequently used by Wavetip is kafka manager. It is also recommended that you use this tool, which not only has monitoring functions but also management functions. For specific usage methods, please refer to:
Kafka management artifact -kafkamanager
Monitoring indicators
Kafka's indicator server and client have both. For specific index content, please refer to kafka official website:
http://kafka.apache.org/0102/documentation.html#monitoring
The easiest way to view the available metrics is to start jconsole and point it to a running kafka client or server; this will allow browsing all metrics using JMX.
Friends who are familiar with Kafka manager should have seen broker-related information, such as the number of incoming messages per second, the size of incoming messages per second, and the size of outgoing messages.
It is very convenient to use kafka manager. However, this actually does not allow us to discover data flow fluctuations in time, or we want to draw a curve to compare historical flows in detail, which is impossible. Therefore, we have to find a way to obtain these indicators, and then do our own display. Another point is the traffic fluctuation warning.
Langjian only made the interface of a few indicators in the figure:
def getBytesInPerSec(kafkaVersion: KafkaVersion, mbsc: MBeanServerConnection, topicOption: Option[String] = None) = {
   getBrokerTopicMeterMetrics(kafkaVersion, mbsc, "BytesInPerSec", topicOption)
 }

 def getBytesOutPerSec(kafkaVersion: KafkaVersion, mbsc: MBeanServerConnection, topicOption: Option[String] = None) = {
   getBrokerTopicMeterMetrics(kafkaVersion, mbsc, "BytesOutPerSec", topicOption)
 }

 def getBytesRejectedPerSec(kafkaVersion: KafkaVersion, mbsc: MBeanServerConnection, topicOption: Option[String] = None) = {
   getBrokerTopicMeterMetrics(kafkaVersion, mbsc, "BytesRejectedPerSec", topicOption)
 }

 def getFailedFetchRequestsPerSec(kafkaVersion: KafkaVersion, mbsc: MBeanServerConnection, topicOption: Option[String] = None) = {
   getBrokerTopicMeterMetrics(kafkaVersion, mbsc, "FailedFetchRequestsPerSec", topicOption)
 }

 def getFailedProduceRequestsPerSec(kafkaVersion: KafkaVersion, mbsc: MBeanServerConnection, topicOption: Option[String] = None) = {
   getBrokerTopicMeterMetrics(kafkaVersion, mbsc, "FailedProduceRequestsPerSec", topicOption)
 }

 def getMessagesInPerSec(kafkaVersion: KafkaVersion, mbsc: MBeanServerConnection, topicOption: Option[String] = None) = {
   getBrokerTopicMeterMetrics(kafkaVersion, mbsc, "MessagesInPerSec", topicOption)
 }
jmx client
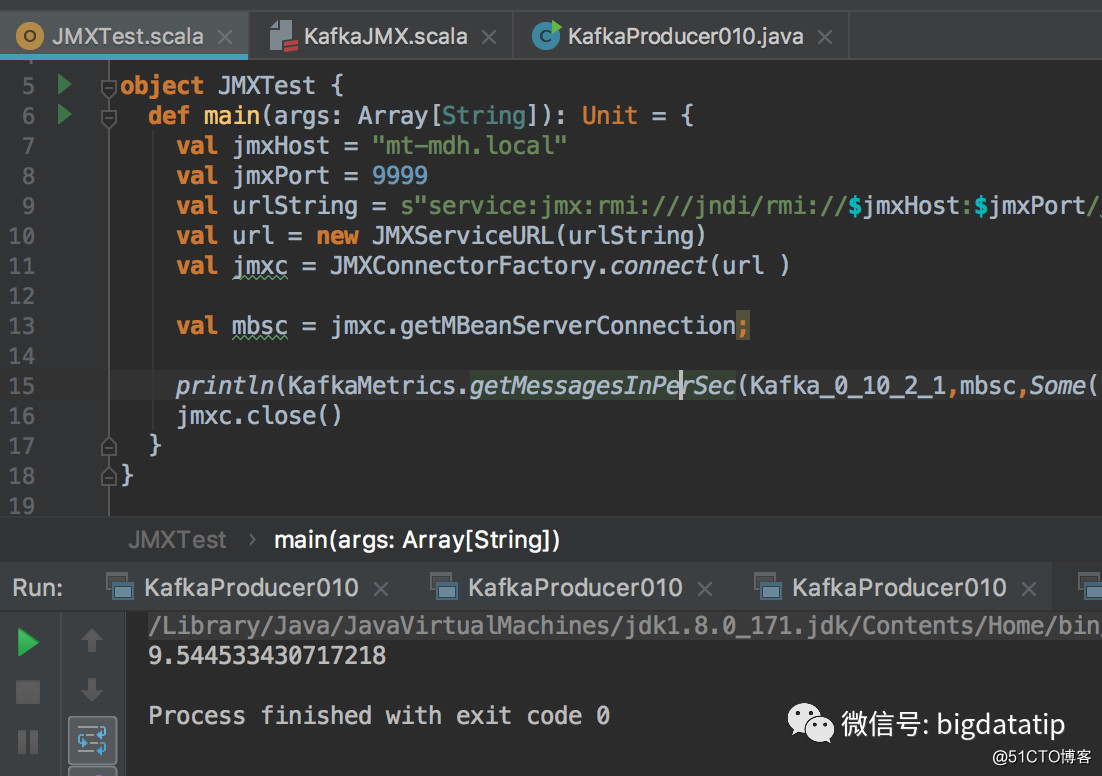
The jmx server can use jconsole, but it cannot meet our needs. Therefore, we use JMXConnectorFactory to connect to jmx. When using JMXConnectorFactory to link jmx, the parameter url of JMXServiceURL must be connected using the service:jmx method. The specific link creation method is very simple, just a few lines of code, as follows:
val jmxHost = "hostname"
val jmxPort = 9999
val urlString = s"service:jmx:rmi:///jndi/rmi://$jmxHost:$jmxPort/jmxrmi"
val url = new JMXServiceURL(urlString)
val jmxc = JMXConnectorFactory.connect(url )

val mbsc = jmxc.getMBeanServerConnection;

println(KafkaMetrics.getMessagesInPerSec(Kafka_0_10_2_1,mbsc,Some("test")).fifteenMinuteRate)
jmxc.close()
Open the jmx port of kafka
Kafka's jmx service is turned off by default. It is very simple to turn it on. You only need to add a line of code to the startup script kafka-server-start.sh of the kafka server, with the content export JMX_PORT="9999", and the added location is as follows:
if [ "x$KAFKA_HEAP_OPTS" = "x"]; then

  export KAFKA_HEAP_OPTS="-Xmx1G -Xms1G"

  export JMX_PORT="9999"
    fi
test
My test here is relatively simple, mainly to print out the number of messages, you can adjust according to your needs, for example, the average value is greater than the threshold to send SMS alerts.
This article is the second article to implement the Kafka monitoring system by myself. The previous article talked about getting the offset submitted by the consumer from the Kafka broker. For details, you can read:
How to get the consumer information saved by the Kafka broker?
A complete set of Kafka monitoring, including:
- Consumer monitoring is mainly for survival alarms and consumption lagging alarms.
- Producer monitoring is mainly for survival alarms, and for producers to consume upstream data capacity alarms.
- Broker monitoring mainly includes survival alarms, traffic alarms, isr lists, topic exception alarms, and control transformation alarms.
There is a lot of content, and articles will be published one after another. Of course, the entire project will eventually be placed on the planet.