1- JVM memory management
1.1 JVM overall architecture
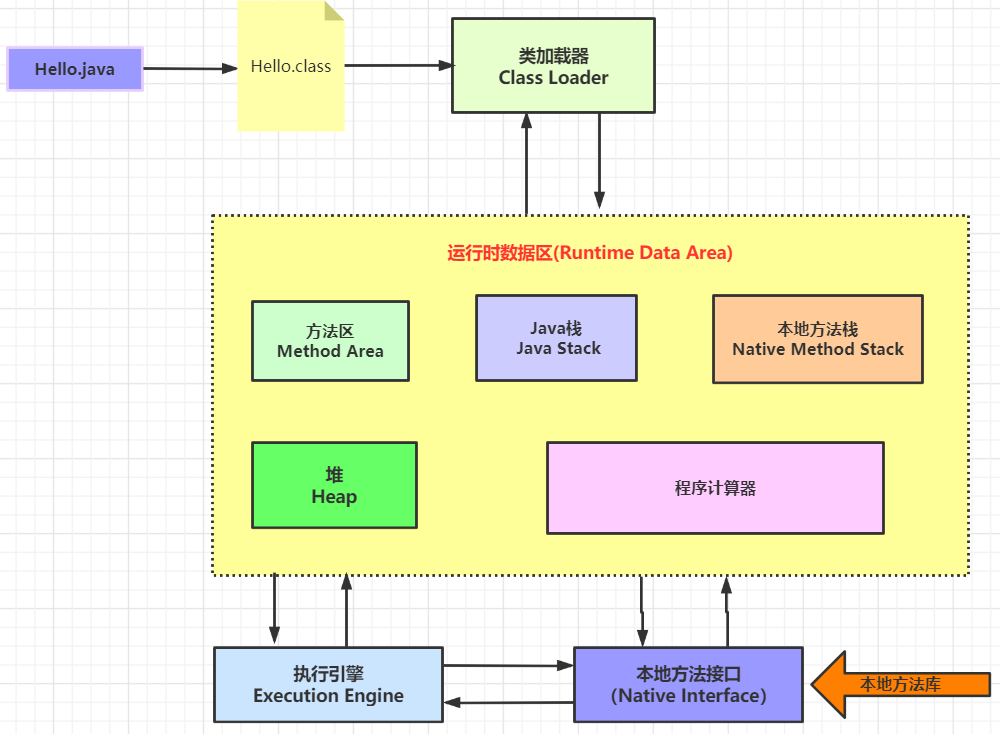
JVM memory is divided into five parts: virtual machine stack, heap, method area, program counter, and local method stack.
Some features
| name | feature | Configuration parameter | abnormal |
|---|---|---|---|
| Program counter | It occupies small memory, the thread is private, and the life cycle is the same as that of the thread. | no | no |
| Virtual machine stack | The thread is private, the life cycle is the same as that of the thread, and it uses contiguous memory space. | -Xss | StackOverflowError/ OutOfMemoryError |
| heap | Thread sharing, the life cycle is the same as that of a virtual machine, and consecutive memory addresses may not be used. | -Xms -Xsx -Xmn | OutOfMemoryError |
| Method area | Thread sharing, the life cycle is the same as that of a virtual machine, and consecutive memory addresses may not be used. | -XX:PermSize:16M- XX:MaxPermSize64M/- XX:MetaspaceSize=16M- XX:MaxMetaspaceSize=64M |
OutOfMemoryError |
| Native method stack | The thread is private. | no | StackOverflowError/ OutOfMemoryError |
JVM tuning
The so-called tuning of the JVM is actually in the heap area + method area, and the heap is adjusted in 99% of the cases . The stack has a stack frame, and the memory is released when it is used up.

1.2 JVM module
JVM is divided into five major modules: class loader subsystem, runtime data area, execution engine, native method interface, and garbage collection module.
