Rook:
A self-managed distributed storage orchestration system. It is not a storage system in itself. It builds a bridge between storage and k8s. The construction or maintenance of the storage system becomes particularly simple. Rook supports CSI, and CSI does some PVC snapshots and PVCs. Operations such as capacity expansion.
Rook is a file, block, and object storage service dedicated to the Cloud-Native environment. It implements a self-managed, self-expandable, and self-healing distributed storage service.
Rook supports automatic deployment, startup, configuration, provisioning, expansion/reduction, upgrade, migration, disaster recovery, monitoring, and resource management. In order to achieve all these functions, Rook relies on the underlying container orchestration platform.
Currently Rook is still in the Alpha version, initially focusing on Kubernetes+Ceph. Ceph is a distributed storage system that supports file, block, and object storage, and is widely used in production environments.
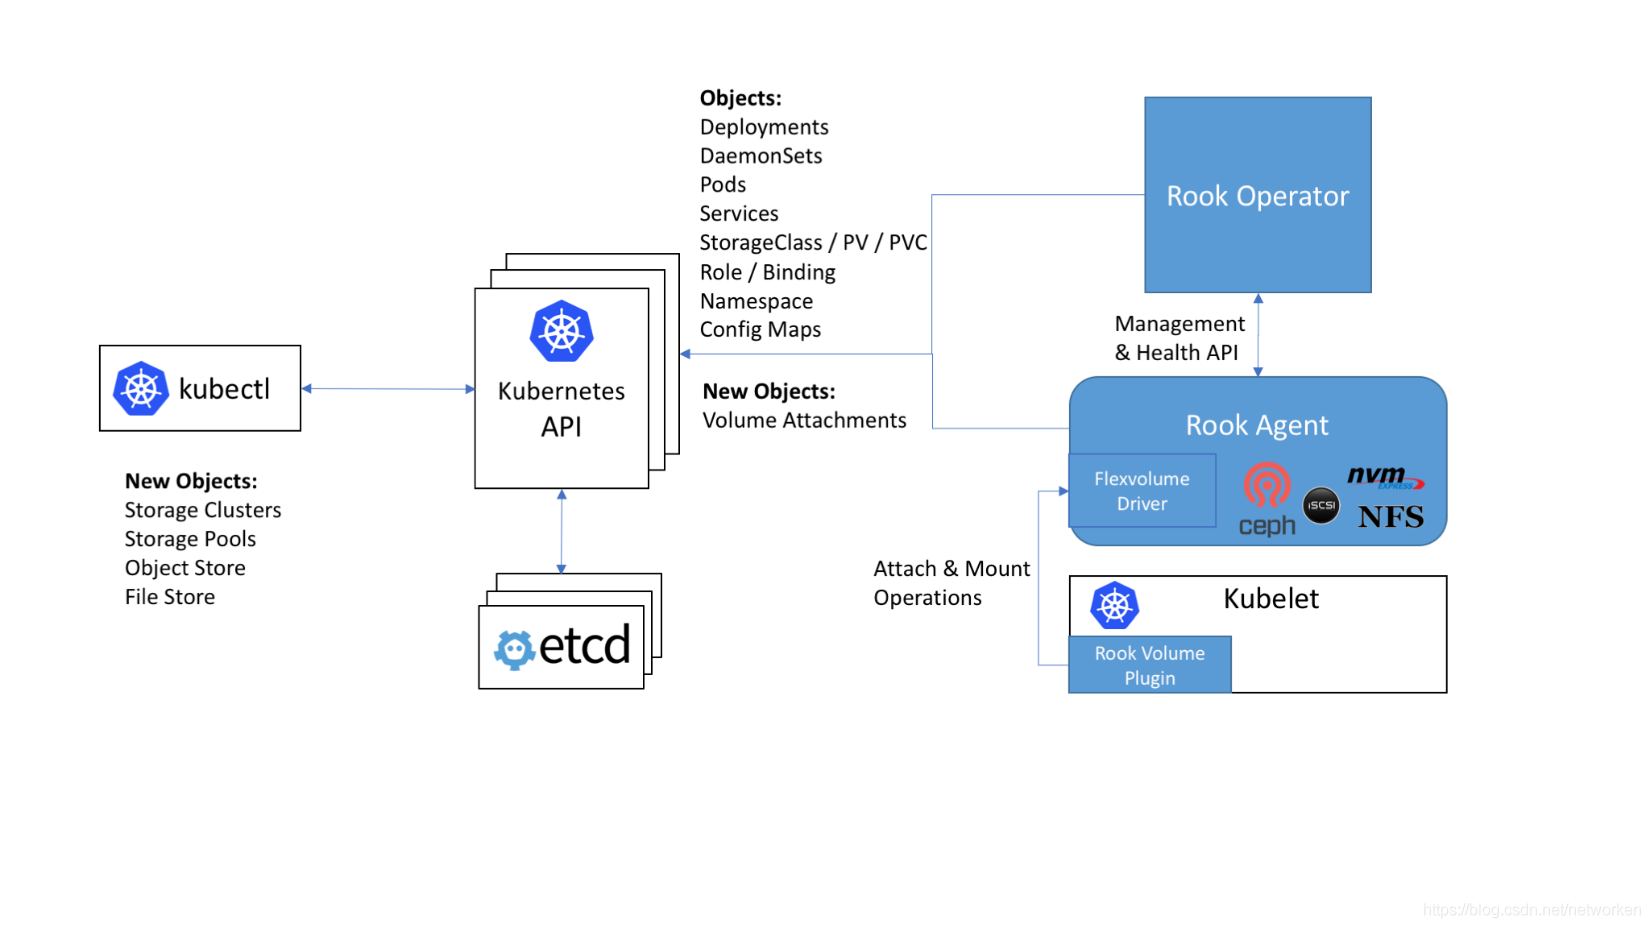

Operator: Mainly used for stateful services or for the management of more complex applications.
Helm: Mainly used for stateless services, configuration separation.
Rook:
Agent: It runs on each storage node and is used to configure a FlexVolume plug-in to integrate with k8s storage volumes. Mount network storage, load storage volume, and format file system.
Discover: Mainly used to detect storage devices linked to storage nodes.
Ceph:
OSD: directly connected to the physical disk or directory of each cluster node. The number of replicas, high availability, and fault tolerance of the cluster.
MON: Cluster monitoring, all nodes in the cluster will report to Mon. He recorded the cluster topology and data storage location information.
MDS: Metadata server, responsible for tracking the file hierarchy and storing ceph metadata.
RGW: restful API interface.
MGR: Provides additional monitoring and interface.
Rook official documentation: https://rook.io/docs/rook/v1.5/ceph-quickstart.html
Environment deployment
git clone --single-branch --branch v1.5.8 https://github.com/rook/rook.git
cd rook/cluster/examples/kubernetes/ceph
kubectl create -f crds.yaml -f common.yaml -f operator.yaml

修改cluster.yaml文件
kubectl create -f cluster.yaml
vim cluster.yaml
storage: # cluster level storage configuration and selection
useAllNodes: false #所有结节为存储节点,改为false
useAllDevices: false #使用所有的磁盘 改为false
nodes:
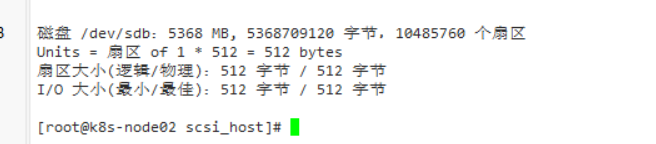
- name: "k8s-node02"
devices: # specific devices to use for storage can be specified for each node
- name: "sdb" #k8s-node02新加的裸盘
- name: "k8s-node01"
directories:
- path: "/data/ceph"


rook的dashboard: https://rook.io/docs/rook/v1.5/ceph-dashboard.html
kubectl -n rook-ceph get service
NAME                         TYPE        CLUSTER-IP       EXTERNAL-IP   PORT(S)          AGE
rook-ceph-mgr                ClusterIP   10.108.111.192   <none>        9283/TCP         3h
rook-ceph-mgr-dashboard      ClusterIP   10.110.113.240   <none>        8443/TCP         3h
The first service is used for reporting Prometheus metrics , while the latter service is used for dashboards. If you are on a node in the cluster, you can https://rook-ceph-mgr-dashboard-https:8443connect to the dashboard by using the DNS name of the service or by connecting to the cluster IP (in this example) https://10.110.113.240:8443. Or use NodePort to expose port usage
Query password
kubectl -n rook-ceph get secret rook-ceph-dashboard-password -o jsonpath="{['data']['password']}" | base64 --decode && echo

