table of Contents
1. Data resampling
Resampling refers to the process of interpolating the information of one type of pixel information of another type of pixel. In remote sensing, resampling is the process of extracting low-resolution images from high-resolution remote sensing images . Commonly used resampling methods include nearest neighbor interpolation, bilinear interpolation and cubic convolution interpolation.
The ReadAsArray function can resample the read data, and specify the output buffer size or pass an existing buffer array.
Function format:
band.ReadAsArray([xoff], [yoff], [win_xsize], [win_ysize], [buf_xsize], [buf_ysize], [buf_obj])
- xoff is the column to start reading, and the default value is 0.
- yoff is the line to start reading, and the default value is 0.
- win_xsize is the number of columns to be read, the default is to read all.
- win_ysize is the number of rows to be read, and the default is to read all.
- buf_xsize is the number of columns in the output array, and the default value is the value of win_xsize.
- buf_ysize is the number of rows in the output array, and the default value is the value of win_ysize.
- buf_obj is a NumPy array that is used to put data into it instead of creating a new array. If necessary, the data will be resampled to fit the array, and the corresponding value will be converted to the data type of the array.
Arrays with larger sizes will be resampled to smaller pixels, arrays with smaller sizes will be resampled to larger pixels using nearest neighbor interpolation
Resample to smaller pixels:
You need to provide an array with a larger dimension than the original data, so that the pixel values are reused to fill the target array:
import os
from osgeo import gdal

os.chdir(r'D:\geodata\Landsat\Washington')

in_ds = gdal.Open('p047r027_7t20000730_z10_nn10.tif')
in_band = in_ds.GetRasterBand(1)

# 计算输出行列数
# 输入数翻倍,因为我将像素大小减半
out_rows = in_band.YSize * 2
out_columns = in_band.XSize * 2

# 创建输出数据集
gtiff_driver = gdal.GetDriverByName('GTiff')
out_ds = gtiff_driver.Create('band1_resampled.tif',
    out_columns, out_rows)

# 编辑地理变换
# 像素变为原来的 1/4
out_ds.SetProjection(in_ds.GetProjection())
geotransform = list(in_ds.GetGeoTransform())
geotransform[1] /= 2
geotransform[5] /= 2
out_ds.SetGeoTransform(geotransform)

# 读取数据时,指定一个较大的缓冲
data = in_band.ReadAsArray(
    buf_xsize=out_columns, buf_ysize=out_rows)

# 将数据写入输出光栅
out_band = out_ds.GetRasterBand(1)
out_band.WriteArray(data)

# 为较大的图像构建合适的概视图
out_band.FlushCache()
out_band.ComputeStatistics(False)
out_ds.BuildOverviews('average', [2, 4, 8, 16, 32, 64])

del out_ds
Image display:

attribute information:


2. Byte sequence
1.ReadRaster([xoff], [yoff], [xsize], [ysize], [buf_xsize], [buf_ysize], [buf_type], [band_list],[buf_pixel_space], [buf_line_space], [buf_band_space])
- xoff is the starting point for column reading, and the default value is 0.
- yoff is the starting point for line reading, and the default value is 0.
- xsize is the number of columns to be read, and the default is to read all.
- ysize is the number of rows read, and the default is to read all.
- buf_xsize is the number of columns in the output array, and the default value is win_xsize. If this value is different from win_xsize, the data will be resampled.
- buf_ysize is the number of rows in the output array, the default value is to use the win_ysize value. If this value is different from win_ysize, the data will be resampled.
- buf_type is the GDAL target data type of the returned sequence, and the default value is the same as the source data.
- band_list is the list of bands to be read, all bands are read by default.
- buf_pixel_space is the byte offset between pixels in the sequence, and the default value is the size of buf_type.
- buf_line_space is the byte offset between lines in the sequence. The default value is buf_type multiplied by xsize.
- buf_band_space is the byte offset between columns in the sequence. The default value is buf_line_space multiplied by ysize.
import os
import numpy as np
from osgeo import gdal

data_dir = r'D:\geodata'

os.chdir(os.path.join(data_dir, 'Landsat', 'Washington'))
ds = gdal.Open('Landsat_color.tif')
data = ds.ReadRaster(1400, 6000, 2, 2, band_list=[1])
print(data)

# 取出第一个值,将从字节转换为数字
print(data[0])

# 尝试更改第一个像素的值。
# 输出失败,因为不能更改字节字符串
data[0] = 50

# 将字节字符串转换为字节数组
# 更改第一个值,输出成功
bytearray_data = bytearray(data)  # bytearray是字节数组
bytearray_data[0] = 50
print(bytearray_data[0])
b'\x1c\x1d\x1c\x1e'
28
50
2. Convert a byte string into a tuple of pixel values:
import struct
tuple_data = struct.unpack('B' * 4, data) # 指定4个字节
print(tuple_data)
(28, 29, 28, 30)
3. Convert the tuple to a numpy array:
numpy_data1 = np.array(tuple_data)
print(numpy_data1)
[28 29 28 30]
4. Convert the byte string to a numpy array:
# 将字节字符串转换为numpy数组
# 重构一个numpy数组,使其具有2行2列,就像读入的原始数据一样
numpy_data2 = np.fromstring(data, np.int8)
reshaped_data = np.reshape(numpy_data2, (2,2))
print(reshaped_data)
[[28 29]
 [28 30]]
5. Use byte sequences to resample the image to a larger pixel size:
import os
import numpy as np
from osgeo import gdal

os.chdir(r'D:\geodata\Landsat\Washington')

# 打开输入栅格
in_ds = gdal.Open('Landsat_color.tif')

# 计算输出的行和列的数量
# 输入数字的一半,因为要使像素的两倍大
out_rows = int(in_ds.RasterYSize / 2)
out_columns = int(in_ds.RasterXSize / 2)
num_bands = in_ds.RasterCount

# 创建输出数据集
gtiff_driver = gdal.GetDriverByName('GTiff')
out_ds = gtiff_driver.Create('Landsat_color_resampled.tif',
    out_columns, out_rows, num_bands)

# 编辑地理变换,让像素尺寸变大
# 像素宽度、像素高度加倍
out_ds.SetProjection(in_ds.GetProjection())
geotransform = list(in_ds.GetGeoTransform())
geotransform[1] *= 2
geotransform[5] *= 2
out_ds.SetGeoTransform(geotransform)

# 利用较小的缓冲来读写数据
data = in_ds.ReadRaster(
    buf_xsize=out_columns, buf_ysize=out_rows)

# 将数据写入栅格中
out_ds.WriteRaster(0, 0, out_columns, out_rows, data)

# 为较小的图像创建合适数量的概视图
out_ds.FlushCache()
for i in range(num_bands):
    out_ds.GetRasterBand(i + 1).ComputeStatistics(False)
out_ds.BuildOverviews('average', [2, 4, 8, 16])

del out_ds
The results show that:


3. Subdataset
MODIS image (medium resolution imaging spectrometer) is a hierarchical data format (HDF) file. If the data contains sub-datasets, the GetSubDatasets() function can be used to get a list of their subdatasets , and then use this list information to open the required subdatasets .
Data set structure:

import os
import numpy as np
from osgeo import gdal
data_dir = r'D:\geodata'
# 从MODIS文件中获取子数据集的名称和描述
# 并打印,输出NDVI(归一化植被指数)
os.chdir(os.path.join(data_dir, 'Modis'))
ds = gdal.Open('MYD13Q1.A2014313.h20v11.005.2014330092746.hdf')
subdatasets = ds.GetSubDatasets() # GetSubDatasets函数返回一个元组列表
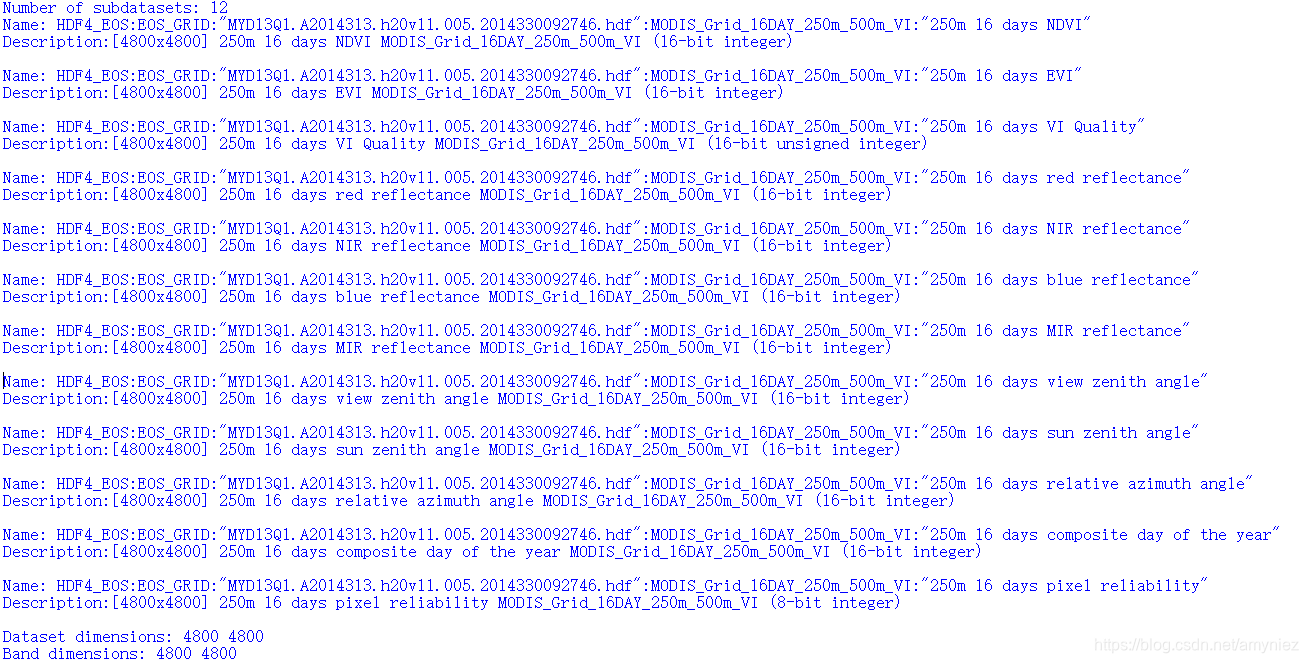
print('Number of subdatasets: {}'.format(len(subdatasets)))
for sd in subdatasets:
print('Name: {0}\nDescription:{1}\n'.format(*sd))
# 打开Modis文件中的第一个子数据集:[0][0]
# 第五个数据集为: [4][0]
ndvi_ds = gdal.Open(subdatasets[0][0])
# 通过打印尺寸来确保正常工作
print('Dataset dimensions: {} {}'.format(ndvi_ds.RasterXSize, ndvi_ds.RasterYSize))
# 读取数据之前先获取波段
ndvi_band = ndvi_ds.GetRasterBand(1)
print('Band dimensions: {} {}'.format(ndvi_band.XSize, ndvi_band.YSize))
The results show that: