
Red House data analysis results:
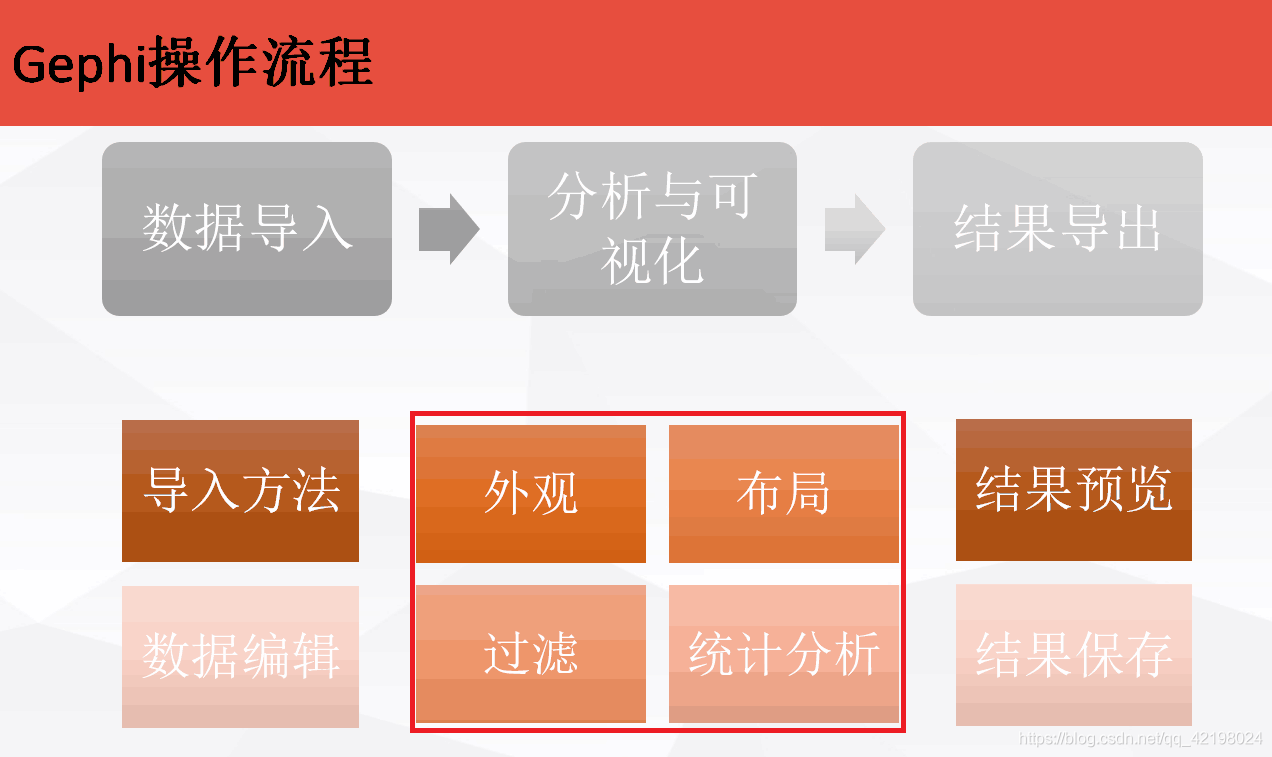
After the layout of the algorithm based on force-directed, statistical analysis is carried out:
1 Since the size of our node itself and the size of the node label are both the degree in the rank, it can be clearly seen from the graph that the greater the degree, the greater the connection with other points in the graph, the greater the effect (the color can be Have a better reflection)
2 Since the rendering methods of our node's color and label color are all modularized, the whole graph finally shows the stability of the community with the nodes with large degrees.
Force Atlas:
Force-directed algorithms, as a typical spring theory algorithm, are widely used to describe relational information graphs such as social networks. Its principle is actually very easy to understand. We can imagine the entire network as a virtual physical system. Each node in the system can be regarded as a discharge particle with a certain energy, and there is a certain Coulomb repulsion between the particles, which makes them repel each other. At the same time, some particles are implicated by some "edges", these edges produce a spring-like Hooker gravitational force, and tightly hold the particles at the two ends of the "edge". Under the continuous action of repulsive force and gravitational force between particles, the particles continuously shift from the random and disordered initial state, and gradually tend to the equilibrium and orderly final state. At the same time, the energy of the entire physical system is constantly being consumed. After several iterations, there is almost no relative displacement between the particles, and the entire system reaches a stable and balanced state, that is, the energy tends to zero. At this moment, the final ideal social network diagram is basically completed.
Basically, most algorithms follow this principle, namely:
Think of the network as a physical system with steel rings at the vertices and springs at the edges
Continuous iteration to minimize the total energy of the entire system
A pure JavaScript charting library . ECharts, abbreviated from Enterprise Charts, commercial-grade data charts, a pure Javascript chart library, can run smoothly on PC and mobile devices, compatible with most current browsers (IE6/7/8/9/10/11, Chrome, firefox, Safari, etc.), the bottom layer relies on the lightweight Canvas library ZRender, which provides intuitive, vivid, interactive, and highly personalized data visualization charts.
Reference link: https://www.jianshu.com/p/7e0ce297f2c7