Slanting wind and drizzle suddenly feel like home
The latest update is really free. I would like to thank you for this time to organize yourself and take the next step.
ELK is an old topic, no matter how you say it is easier to use, because it has just been assembled, there are pictures and instructions
Introduction to ELK
ELK is the abbreviation of Elasticsearch+Logstash+Kibana
- Elasticsearch: It is a distributed search and analysis engine that can be used for full-text search, structured search and analysis, and can combine the three. Elasticsearch is based on Lucene and is now one of the most widely used open source search engines.
- Logstash: Simply put, it is a pipeline with real-time data transmission capabilities. It is responsible for transmitting data information from the input end of the pipeline to the output end of the pipeline. At the same time, this pipeline allows you to add in the middle according to your needs. Filter, Logstash provides many powerful filters to meet your various application scenarios.
- Kibana: is an open source analysis and visualization platform designed to be used with Elasticsearch. You can use kibana to search, view, and interact with the data stored in the Elasticsearch index, using various icons, tables, maps, etc., kibana can easily display advanced data analysis and visualization.
The core of log collection implemented by ELK is to collect the logs of the application system through input through logstash, and then through internal sorting, and output to Elasticsearch through output. In fact, an index is established, and then kibana is used as a visualization platform to perform ES index. Output to the platform and display it in the form of graphs.
The following is based on SpringBoot for detailed integration
JDK8
Elasticsear + Kibana built
Elasticsearch
Download the installation package and unzip
cd elasticsearch-7.2.0
Start: bin/elasticsearch
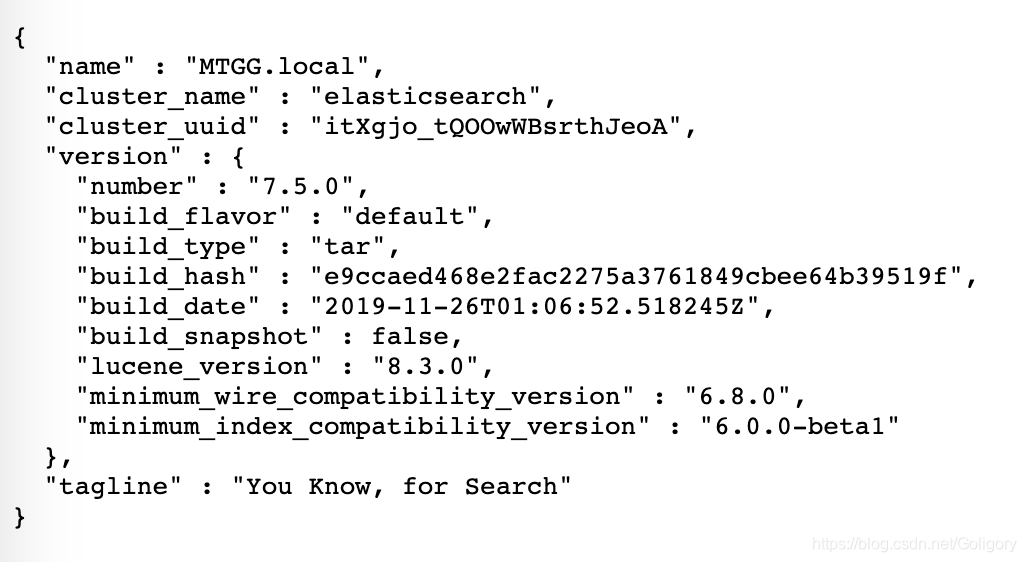
Start a successful visit http: // localhost: 9200 / results are as follows
Kibana
Download the installation package, unzip, and enter the directory
Edit the configuration file: vim config/kibana.yml
#端口
server.port: 5601
#服务Ip
server.host: "127.0.0.1"
#服务名
server.name: "kibana"
#ES地址
elasticsearch.hosts: ["http://127.0.0.1:9200"]
wq! Save and exit
Kibana: kibana-7.2.0-linux-x86_64 / bin / kibana
Visit after successful startup: http://localhost:5601/
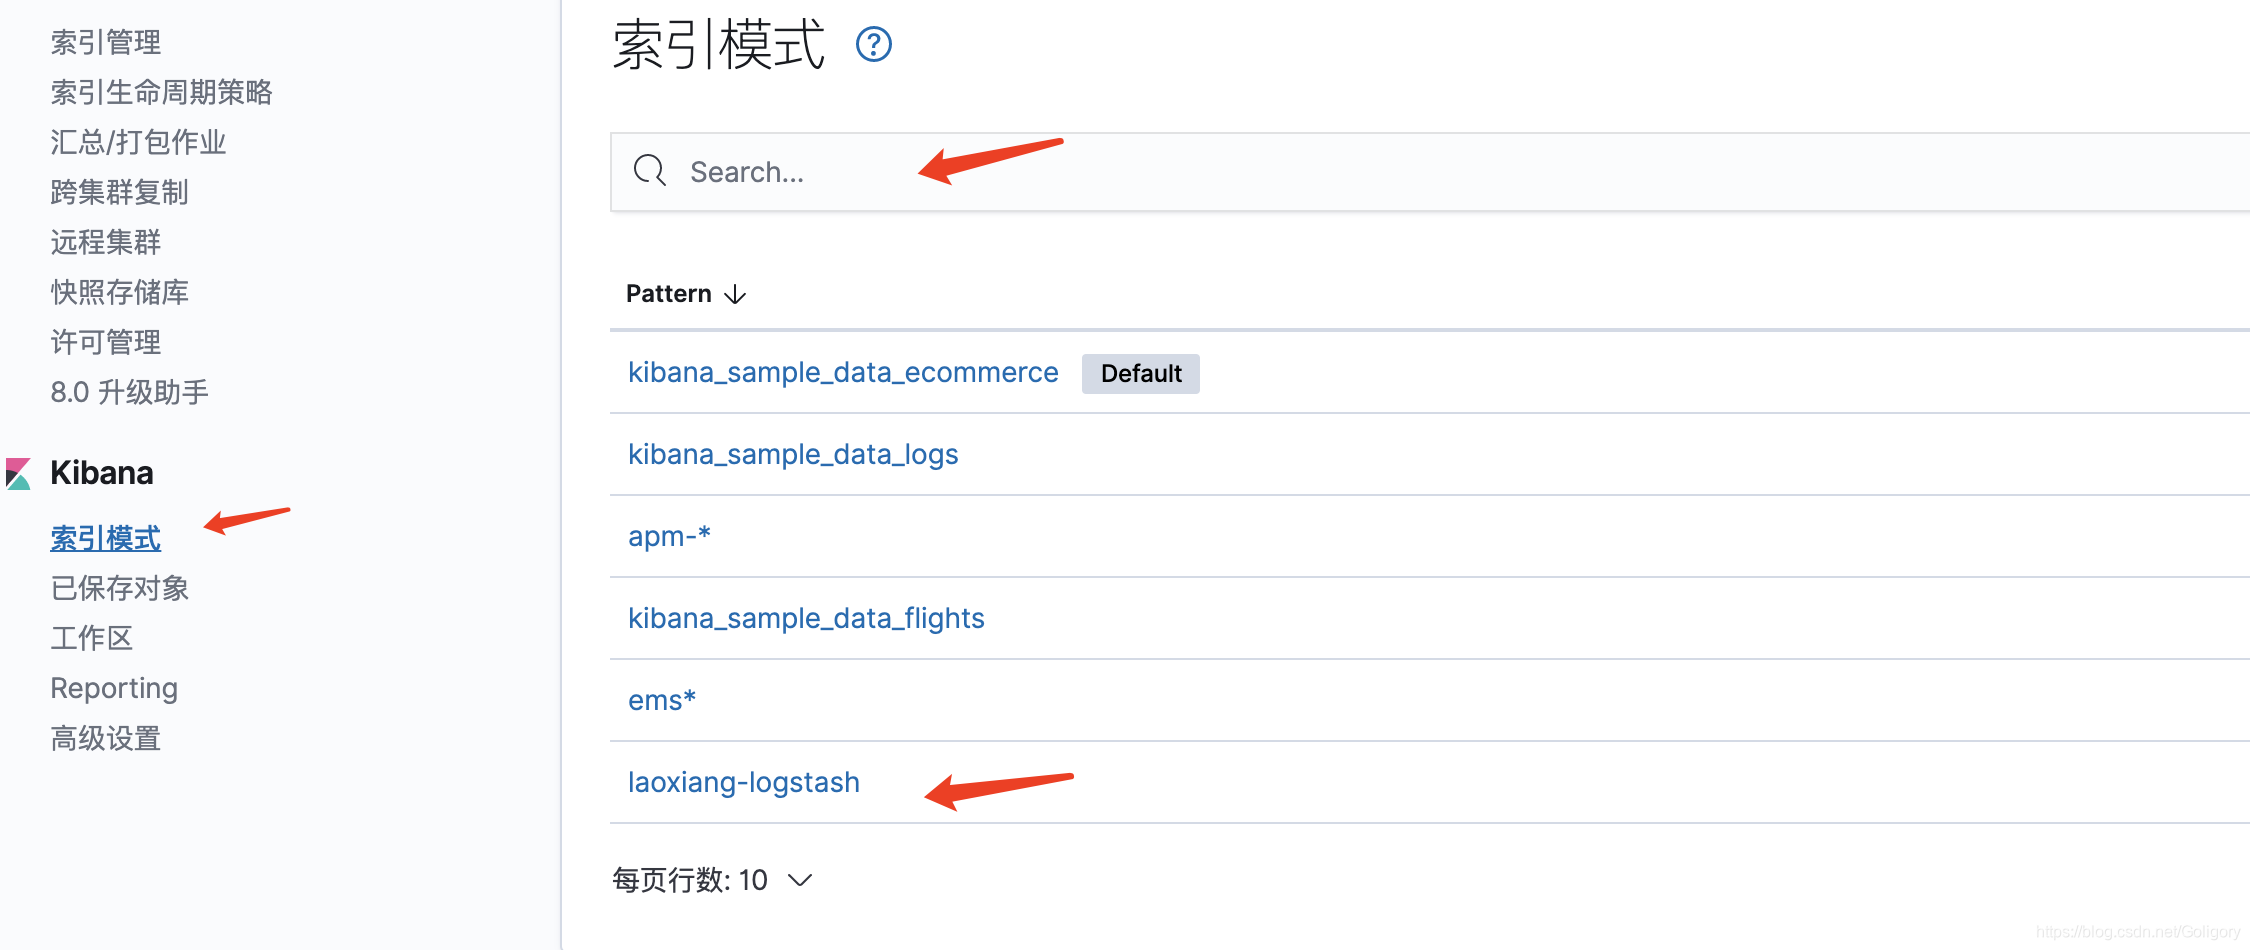
After using the print log in the project, you can see it in kibana, you need to set the index, as follows
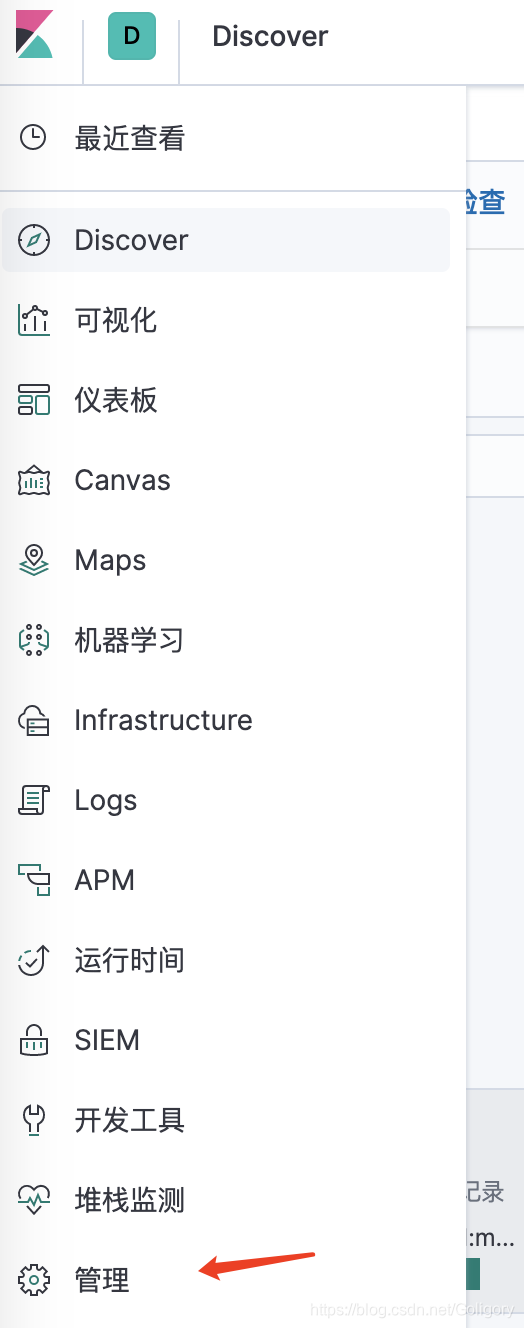
Management-Index Mode-Find the index name set in logstash, the next step, the setting is successful, and then you can see it in the big board
At this time, Kibana and Elasticsearch are set up
logstash
Download and unzip, I went directly to the CSDN download to find, friends in need can find it, you can find me if it takes a lot of trouble
Create the logstash-test.conf file in the config directory and add the configuration as follows
input{
        tcp {
                mode => "server"
                host => "0.0.0.0" #我这里是本地
                port => 9061 #开放这个端口进行采集
                codec => json_lines # 编解码器 有的版本需要肚子安装
        }
}
output{
        elasticsearch{ #es地址
                hosts=>["127.0.0.1:9200"]
                # 在es里产生的index的名称
                index => "laoxiang-logstash"
                }
        stdout{codec => rubydebug}
}
Save and exit
The startup command is in the bin directory: ./logstash -f …/config/logstash-test.conf
The result is shown in the figure.
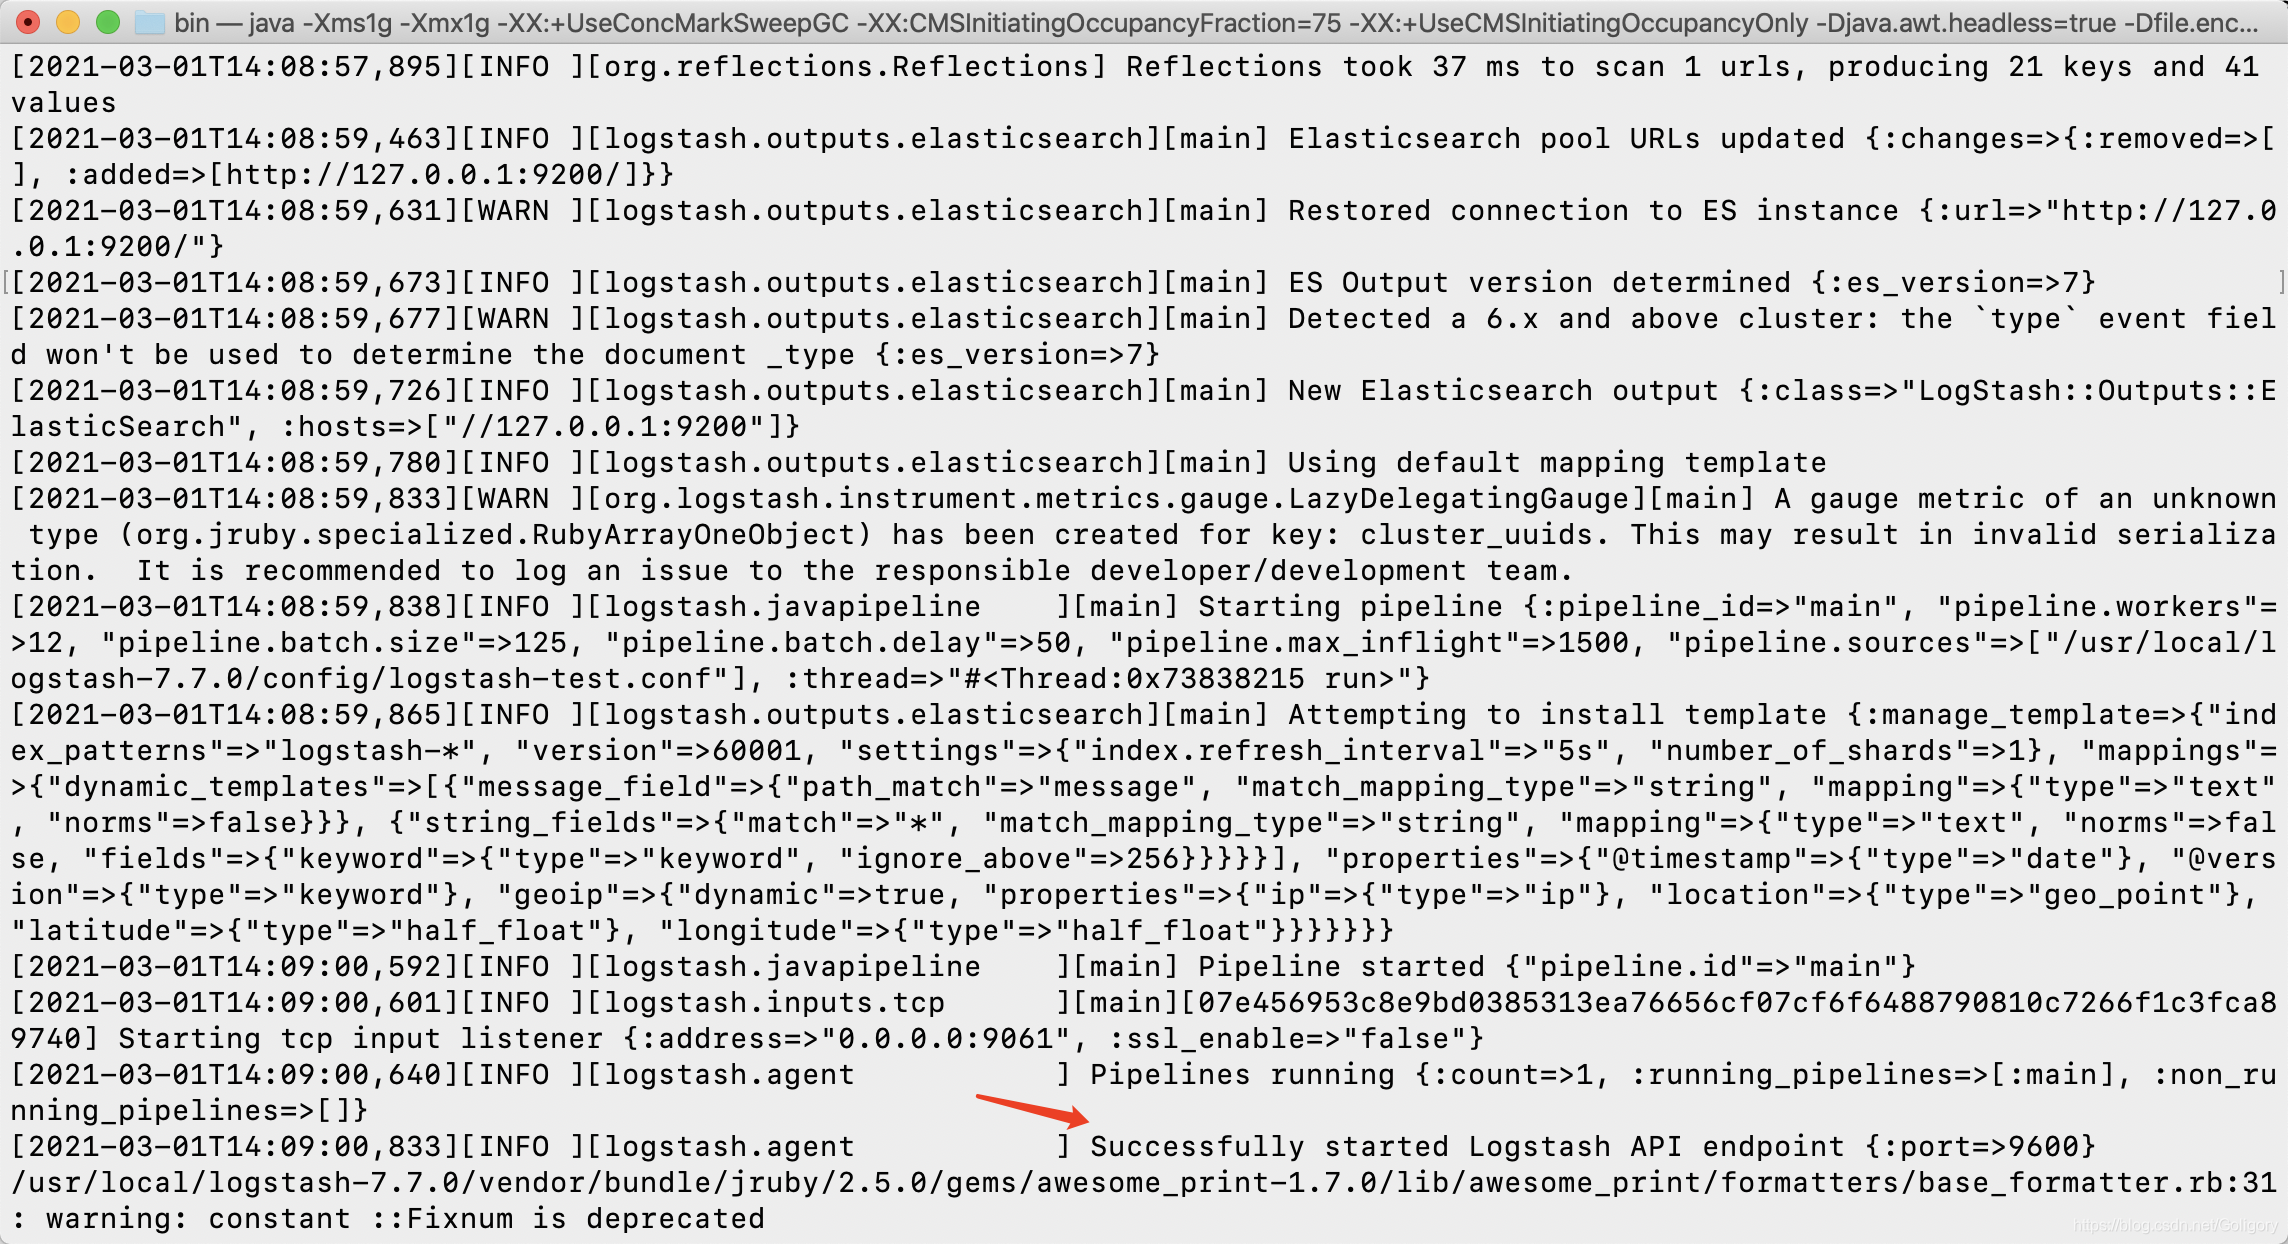
This realizes that logstash is connected to es, and then kibana is visualized
SpringBoot integrated logstash
Introduce maven
<dependency>
  <groupId>net.logstash.logback</groupId>
  <artifactId>logstash-logback-encoder</artifactId>
  <version>6.6</version>
</dependency>
Configure logback xml
<appender name="LOGSTASH" class="net.logstash.logback.appender.LogstashTcpSocketAppender">
		<destination>127.0.0.1:9061</destination>
		<encoder charset="UTF-8" class="net.logstash.logback.encoder.LogstashEncoder"/>
	</appender>
Then set it at the root level
<appender-ref ref="LOGSTASH"/>
Write an API test after startup
		@GetMapping("/t2")
    public Object t2(){
        UserDto userDto = new UserDto();
        userDto.setAge(RandomUtil.randomInt());
        userDto.setName(RandomUtil.randomString(5));
        log.info(JSON.toJSONString(userDto));
        return userDto;
    }
The console output of logstash is as follows
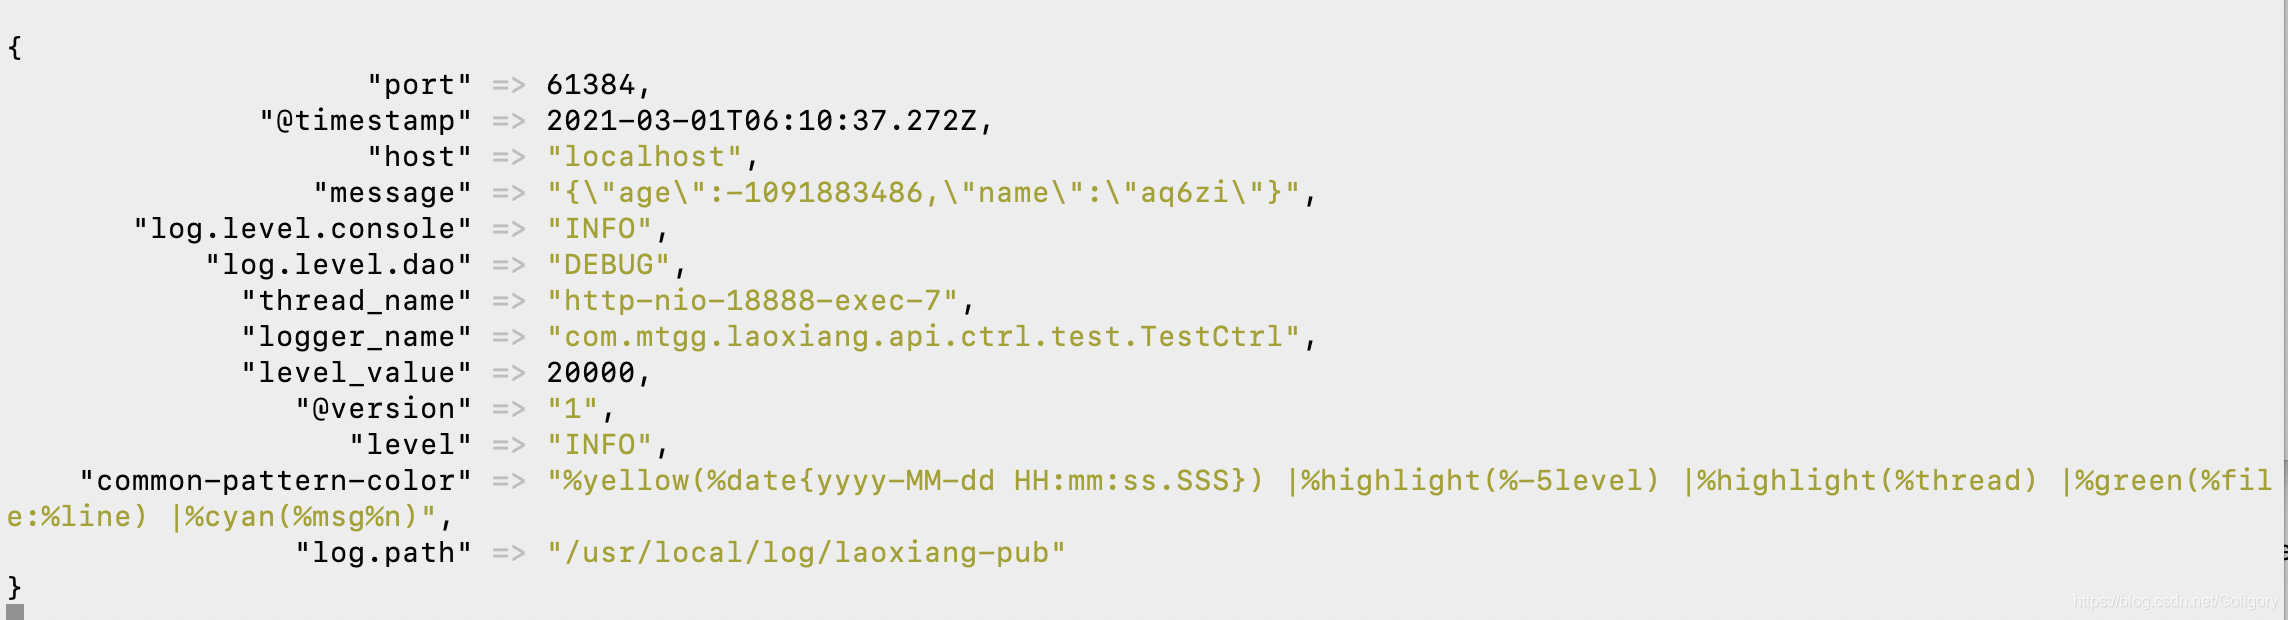
Then go to kibana to have a look, huh? With
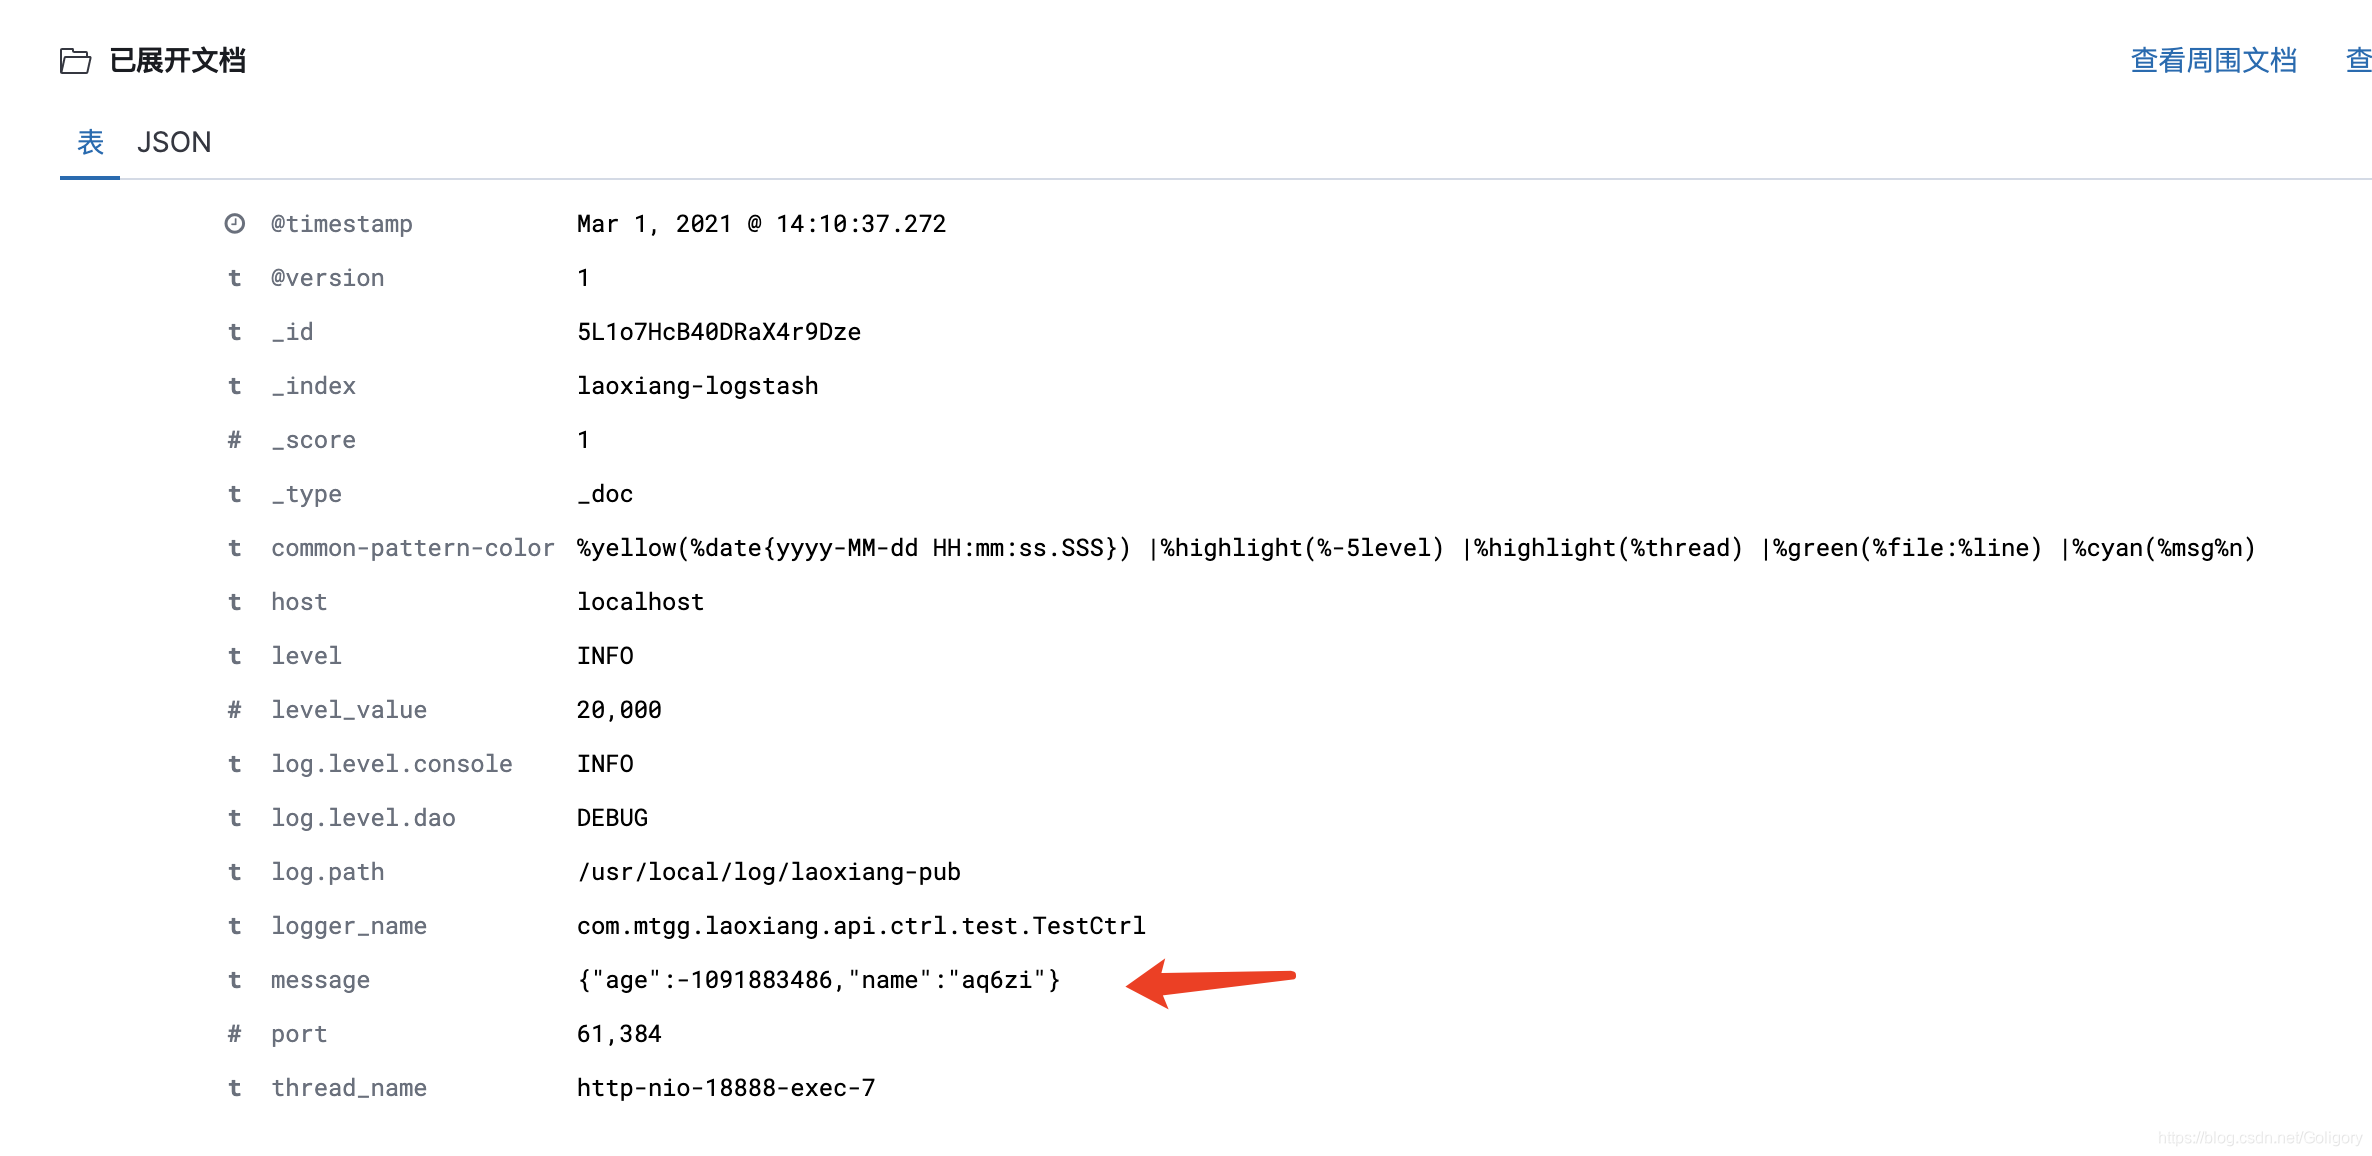
Okay, close, thank you
I keep remembering, as if someone else in the last century
Reference: [https://www.cnblogs.com/wuzhenzhao/p/12911579.html](