echart histogram statistics with title, slide over the effect code of the displayed quantity
import * as echarts from 'echarts';
var chartDom = document.getElementById('main');
var myChart = echarts.init(chartDom);
var option;
option = {
title: {
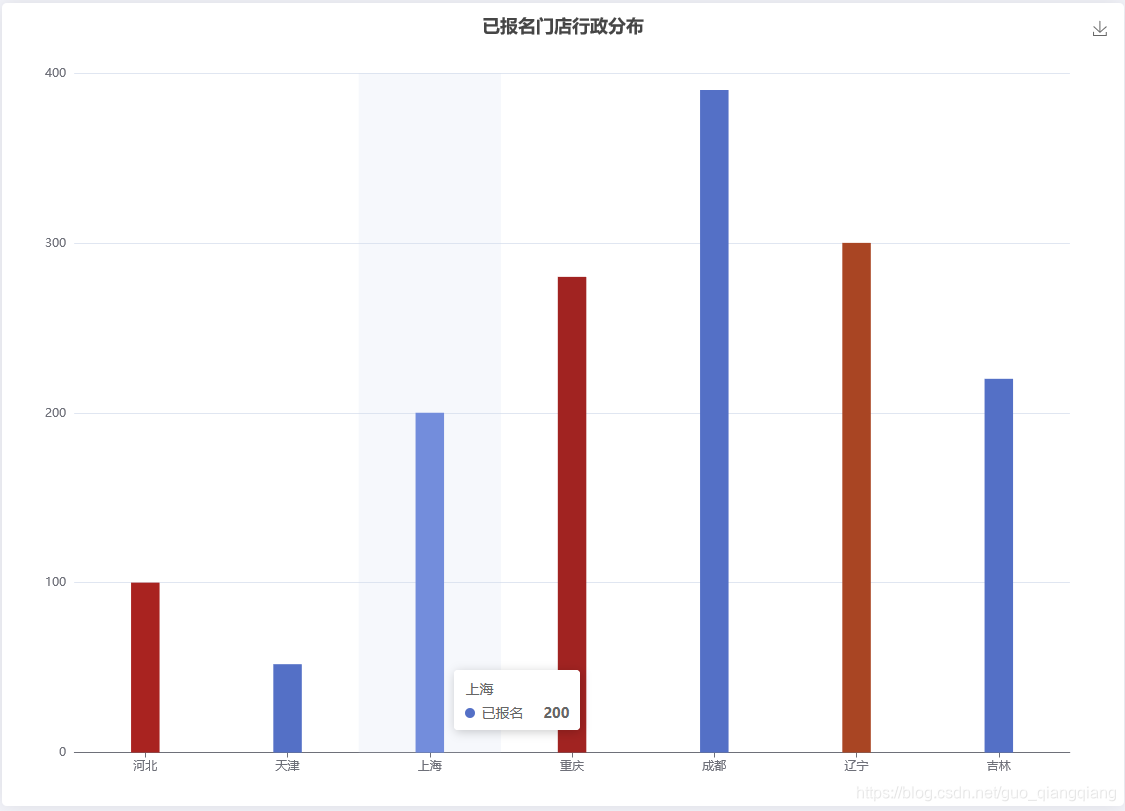
text: '已报名门店行政分布',
x: 'center'
},
tooltip: {
trigger: 'axis',
axisPointer: { // 坐标轴指示器,坐标轴触发有效
type: 'shadow' // 默认为直线,可选为:'line' | 'shadow'
}
},
toolbox: {
show: true,
feature: {
mark: {show: true},
saveAsImage: {show: true},
}
},
grid: {
left: '3%',
right: '4%',
bottom: '3%',
containLabel: true
},
xAxis: [
{
type: 'category',
data: ['河北', '天津', '上海', '重庆', '成都', '辽宁', '吉林'],
axisTick: {
alignWithLabel: true
}
}
],
yAxis: [
{
type: 'value'
}
],
series: [
{
name: '已报名',
type: 'bar',
barWidth: '20%',
data: [{
value: 100,
itemStyle: {
color: '#a92320'
}
}, 52, 200, {
value: 280,
itemStyle: {
color: '#a12321'
}
}, 390, {
value: 300,
itemStyle: {
color: '#a94523'
}
}, 220]
}
]
};
option && myChart.setOption(option);