table of Contents
One, install the VSCode plugin
2. Install the software package on Linux
Under Linux systems, C/C++ debugging usually uses gdb, but using gdb is not so intuitive, and there are many commands to remember. This article introduces VSCode to debug C/C++ programs, which is really a very useful editor.
One, install the VSCode plugin
1.1 Install Chinese plug-in
Open VSCode, install the language plug-in in VSCode, click <Extensions> on the left, enter Chinese, and click Install, as shown in the following figure:

1.2 Install C/C++ plugin
Still in the extension, enter C, select C/C++ installation, as shown in the following figure:

2. Install the software package on Linux
2.1 Install gcc-c++
In this article, Linux uses CentOS 8, install gcc-c++, and execute the following commands.
[root@bogon debug-C++]# yum install gcc-c++2.2 Install gdb
Because gdb is used in the background, install gdb as follows:
[root@bogon debug-C++]# yum install gdbThree, configure VSCode
3.1 Compile configuration
Click the menu bar <terminal>, <configuration task>, <use template to create tasks.json>, <Others>, as shown in the figure below:


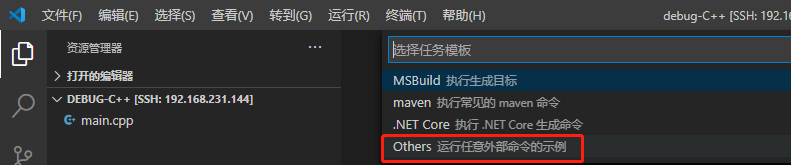
A json configuration file of tasks.json appears. After reconfiguring tasks.json, it looks like this:
{
    // See https://go.microsoft.com/fwlink/?LinkId=733558
    // for the documentation about the tasks.json format
    "version": "2.0.0",
    "tasks": [
        {
            "label": "debug-C++",   // 任务名称
            "type": "shell",        // 表示使用 shell 命令执行
            "command": "g++",       // 实际执行的命令
            "args": [               // 实际执行命令的参数,使用逗号分隔
                "-g",               // -g 参数表示添加 debug 信息
                "-o",               // -o 指定输出文件名称
                "main",             // 输出文件名称
                "main.cpp"          // 源文件
            ]
        }
    ]
}
After the addition is complete, you can see that there is an additional file tasks.json in the ".vscode" directory in the Explorer section on the left, as shown in the following figure:

3.2 debug configuration
Click on the menu bar <Terminal>, <Add Configuration>, <C++(GDB/LLDB)>, as shown in the figure below:

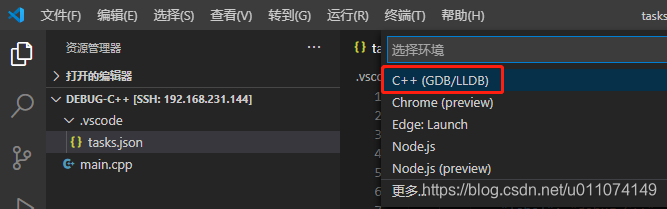
PS: If the following error occurs, first generate an executable file with debugging information, use the mouse to select the executable file, and then execute it.
Cannot read property 'includes' of undefinedThen, the file launch.json file appears, as shown below after reconfiguration:
{
    // 使用 IntelliSense 了解相关属性。
    // 悬停以查看现有属性的描述。
    // 欲了解更多信息,请访问: https://go.microsoft.com/fwlink/?linkid=830387
    "version": "0.2.0",
    "configurations": [
        {
            "name": "debuge test",                  // 名称
            "type": "cppdbg",
            "request": "launch",
            "program": "${workspaceFolder}/main",   //可执行文件的位置  ${workspaceFolder}:当前目录
            "args": [],
            "stopAtEntry": false,
            "cwd": "${workspaceFolder}",
            "environment": [],
            "externalConsole": false,
            "MIMode": "gdb",
            "setupCommands": [
                {
                    "description": "为 gdb 启用整齐打印",
                    "text": "-enable-pretty-printing",
                    "ignoreFailures": true
                }
            ],
            "preLaunchTask": "debug-C++"           // 重要:在调试之前启动的任务名称
        }
    ]
}
After the above configuration, all configuration work is completed.
Four, debug
4.1 Writing code
Here is deliberately written a little more complicated, as follows:
#include <iostream>
using namespace std;

void function1(int i, int j) {
    cout<<"function1"<<endl;
    cout<<"i = "<<i<<" j = "<<j<<endl;
}

int main() {
    int i = 1;
    int j = 2;
    function1(i, j);
    cout<<"Hello, World!"<<endl;
    i = 3;
    j = 5;
    function1(i, j);
    cout<<"Hello, World!"<<endl;
    return 0;
}
4.2 debug
Click F5 (or click the menu bar <Run>, <Start debugging>), as shown in the figure below:

Among them, variables, monitors, call stacks, and breakpoints can be displayed on the left, and the buttons on the right horizontal bar are: Continue, Step Over, Step Debug, Step Out, Restart, and Stop.
Five, summary
After the above steps, you can debug C/C++ programs through VSCode, try it now!
6. Reference link
[1] https://code.visualstudio.com/docs/editor/tasks#vscode
[2] https://code.visualstudio.com/docs/editor/debugging#_launch-configurations