Article Directory
Mainly use Object-Oriented: a more low-level and basic approach
// An highlighted block
import numpy as np
import matplotlib.pyplot as plt
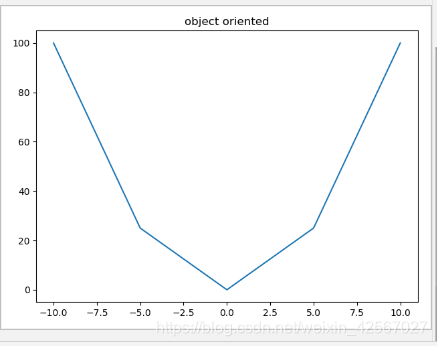
Object-oriented approach
// An highlighted block
x=np.linspace(-10,10,5)
y=x**2
fig=plt.figure()  #生成画布
ax=fig.add_subplot(111)
l,=plt.plot(x,y)
t=ax.set_title('object oriented')
plt.show()
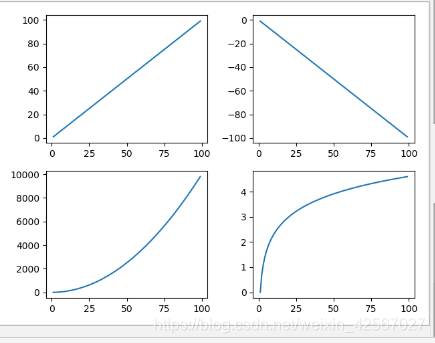
Draw subgraph
Object-oriented approach
// An highlighted block
x=np.arange(1,100)
fig=plt.figure()
ax1=fig.add_subplot(221)
ax1.plot(x,x)
ax2=fig.add_subplot(222)
ax2.plot(x,-x)
ax3=fig.add_subplot(223)
ax3.plot(x,x**2)
ax4=fig.add_subplot(224)
ax4.plot(x,np.log(x))
plt.show()
pyplot way
// An highlighted block
x=np.arange(1,100)
plt.subplot(221)
plt.plot(x,x)
plt.subplot(222)
plt.plot(x,-x)
plt.subplot(223)
plt.plot(x,x**2)
plt.subplot(224)
plt.plot(x,np.log(x))
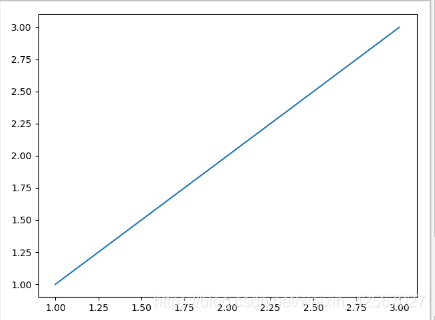
Generate multiple images at the same time
// An highlighted block
fig1=plt.figure()
ax1=fig1.add_subplot(111)
ax1.plot([1,2,3],[3,2,1])
fig2=plt.figure()
ax2=fig2.add_subplot(111)
ax2.plot([1,2,3],[1,2,3])
plt.show()

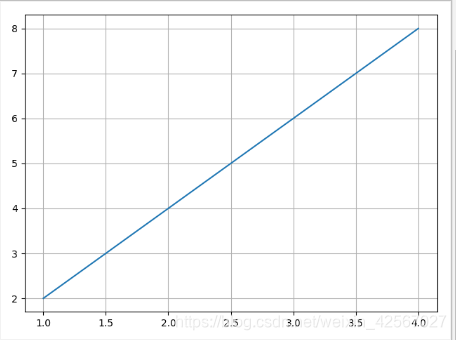
grid
Grid as the background to get the specific position
Object-oriented approach
// An highlighted block
x=np.arange(1,5)
fig=plt.figure()
ax=fig.add_subplot(111)
plt.plot(x,x*2)
ax.grid()
plt.show()
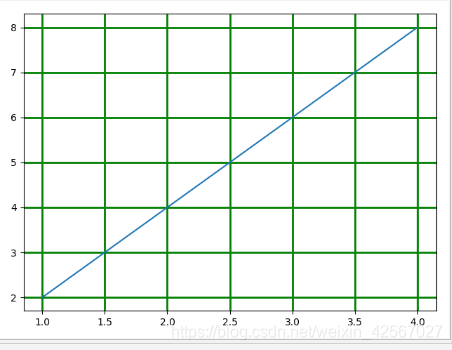
Set the grid
color: color width: linewidth format: linestyle
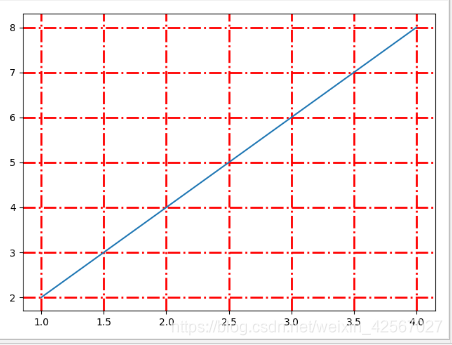
pyplot way
// An highlighted block
x=np.arange(1,5)
plt.plot(x,x*2)
#打开网格
plt.grid(True)
#关闭网格
#plt.grid()
plt.grid(color='green')
plt.grid(linewidth='2')
plt.grid(linestyle='-')
plt.show()
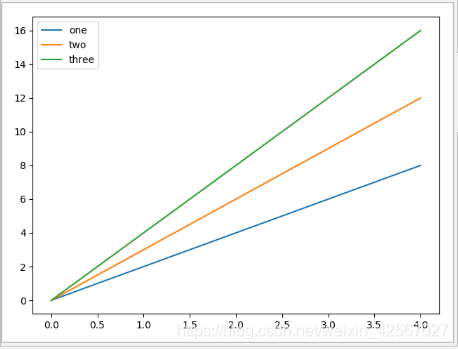
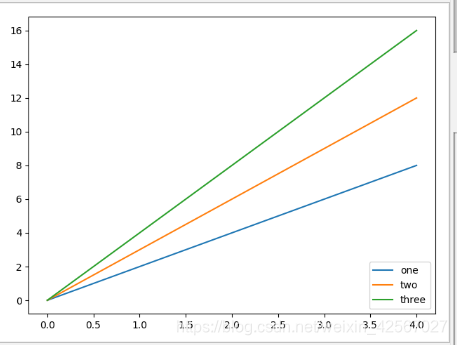
legend
Information box settings
Object-oriented approach
// An highlighted block
x=np.arange(0,5)
fig=plt.figure()
ax=fig.add_subplot(111)
ax.plot(x,x*2,label='one')
ax.plot(x,x*3,label='two')
ax.plot(x,x*4,label='three')
plt.show()
Parameter adjustment
- Information box position 1: upper left corner 2: upper right corner 3: lower left corner 4: lower right corner 0: system default best position
// An highlighted block
x=np.arange(0,5)
fig=plt.figure()
ax=fig.add_subplot(111)
ax.plot(x,x*2,label='one')
ax.plot(x,x*3,label='two')
ax.plot(x,x*4,label='three')
plt.legend(loc=4)
plt.show()
2. Number of columns in the message box (ncol)
// An highlighted block
x=np.arange(0,5)
fig=plt.figure()
ax=fig.add_subplot(111)
ax.plot(x,x*2,label='one')
ax.plot(x,x*3,label='two')
ax.plot(x,x*4,label='three')
plt.legend(ncol=3)
plt.show()

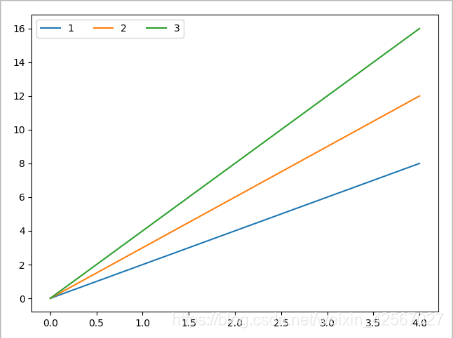
3. Unified settings
// An highlighted block
x=np.arange(0,5)
fig=plt.figure()
ax=fig.add_subplot(111)
ax.plot(x,x*2)
ax.plot(x,x*3)
ax.plot(x,x*4)
plt.legend(['1','2','3'],ncol=3)
plt.show()

pyplot way
// An highlighted block
x=np.arange(0,5)
plt.plot(x,x*2)
plt.plot(x,x*3)
plt.plot(x,x*4)
plt.legend(['1','2','3'],ncol=3)
plt.show()