To deal with data anomalies, we must first know what a data anomaly is. First of all, you need data to know what an "abnormal" is. Baidu Baike's explanation is: it refers to abnormal, different from normal. For example, a sudden rise or a sudden fall.
The rise and fall of data is the easiest phenomenon to be found in our daily work, and it is also what we need to analyze in our daily work. In other words, there is usually no fluctuation in the data, maybe we don't need to analyze it, but if the data rises or falls, we need to find out the reason.
Why should we pay attention to the rise and fall?
I believe that many of my friends are like me. At first they were exposed to data. I only cared about falling. Why did the data fall yesterday? When I analyze the reasons, I will also care about the rise, but I don’t care about the rise. Just like buying a stock, I feel distressed when I fall and analyze the reason. I feel happy and regret why I didn’t buy more.
In the process of data analysis, we should not only care about the decline in order to take corresponding actions to slow down the trend of decline, but also care about the rise, figure out the reason for the rise, and enlarge it, or copy it!
Data Change Analysis Methodology
For the processing of abnormal data, there are usually five steps:
1. Anomalies found
Just as you find that yesterday's data is different from the previous one, whether it has risen sharply or has fallen sharply, you can find anomalies through observational data.
2. Identify the problem
After discovering the anomaly, we need to determine whether the anomaly is a problem and how serious it is. We can use a comparative analysis method to conduct a weekly, monthly, or yearly comparison from the time dimension.
3. Determine the cause
Using a multi-dimensional disassembly method, disassemble this abnormal indicator from different dimensions to find out the reason.
4. Targeted problem solving
After finding the cause, the problem is solved in a targeted manner. According to the cause of the problem, the relevant resources of the company are used to solve the problem.
5. Execution
The final step is to execute the solution, and the exception data is truly from exception to execution, completing a closed loop.
Case analysis
Give a chestnut: You are currently making a social APP product. In the process of processing data, you find that the data of a certain day is abnormal, how should you analyze it?
Discovery of the problem : The abnormal data of a certain day was found when the data was statistically summarized.
Identify the problem : Is the problem serious after the data has fallen so much? Is there such a big fluctuation in the past?
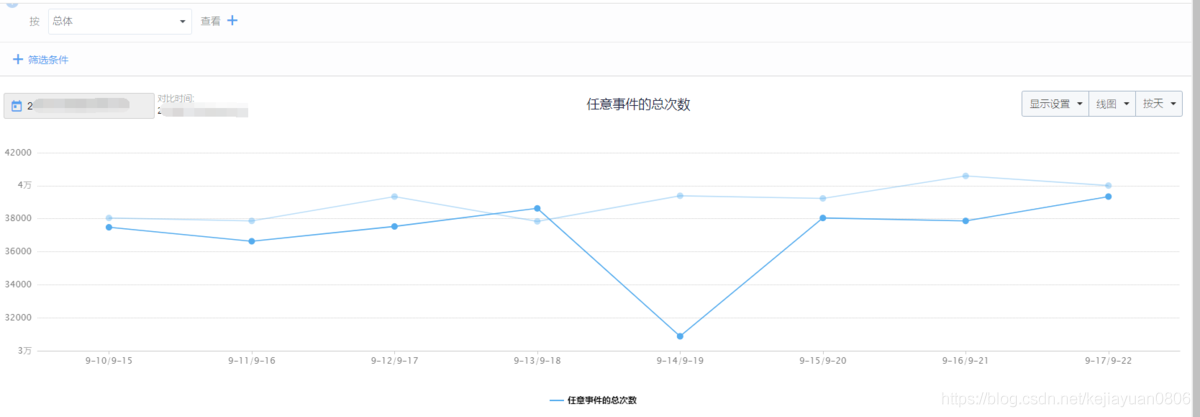
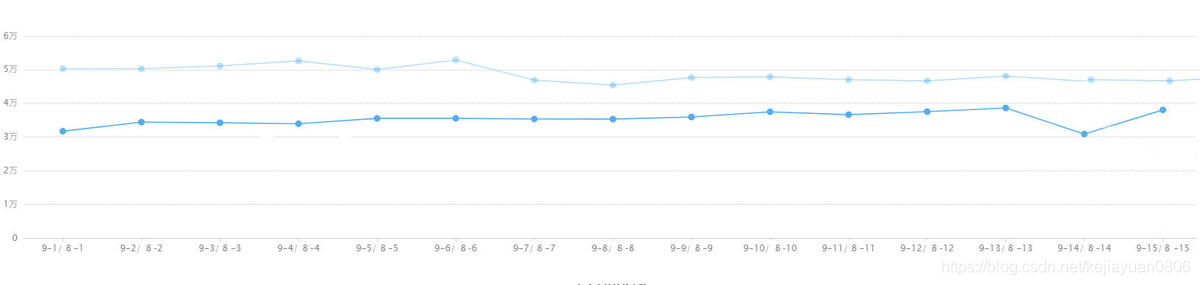
From the weekly and monthly data in the above figure, it can be seen that there was no such problem in the past, which shows that this is a serious case, indicating that something did happen on this day, causing abnormal data.
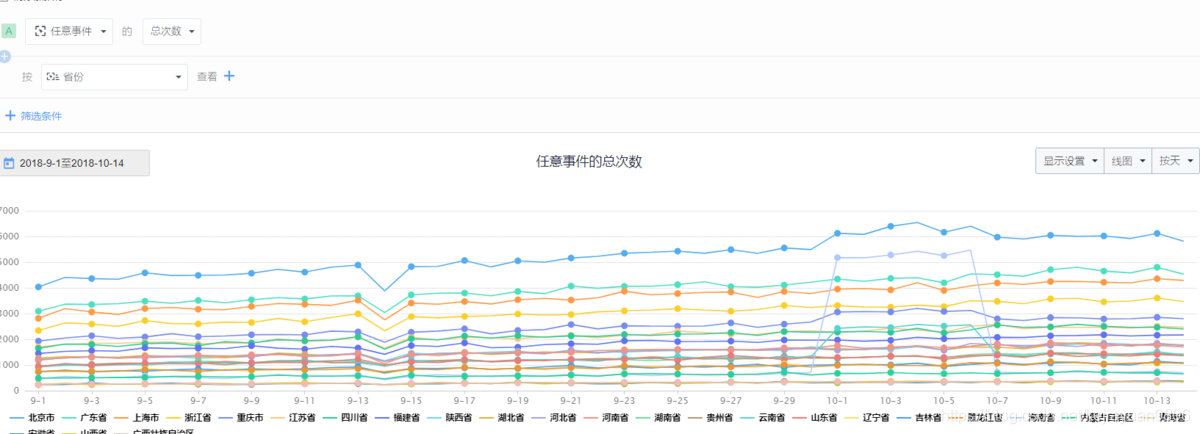
Determine the cause : Is there a problem in which province? Below we look at it by province. From the figure below, it can be seen that the sharp drop in data this time is across the country. Basically all provinces have fallen, which eliminates the reason for the decline in a certain region.
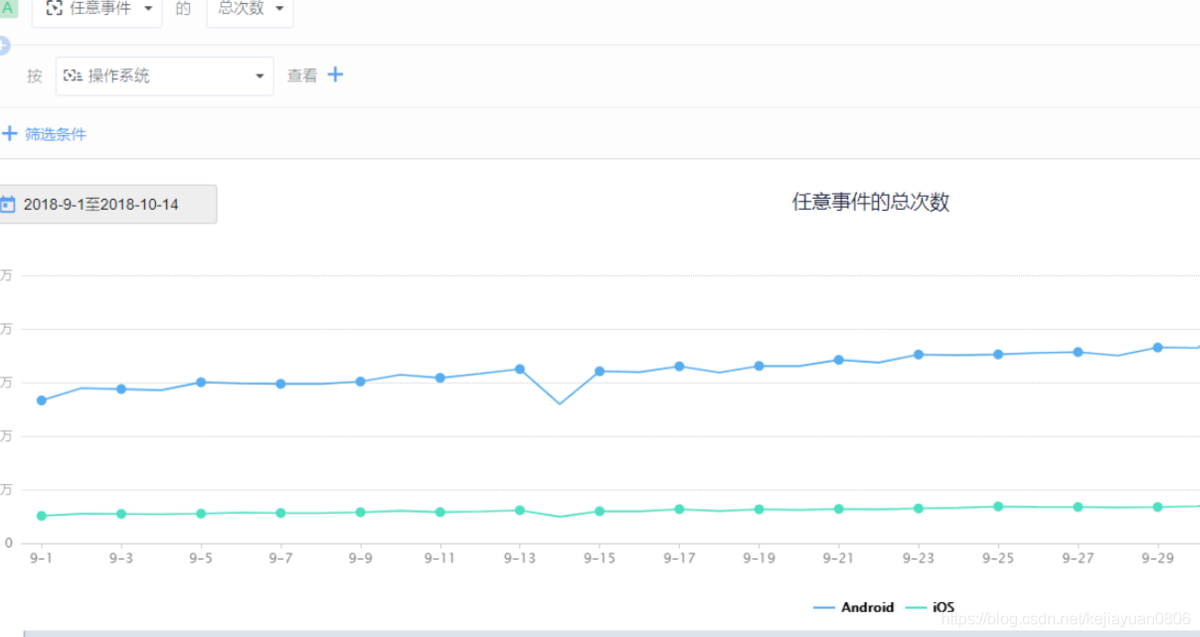
Is there something wrong with the equipment? Let's take a look at the differences in the data of different operating systems. From the figure below, we can see that both Android and iOS have fallen on this day, so the possibility of device problems is ruled out.
Is the service down? Does the hourly or minute-view data conform to the usual flow pattern?
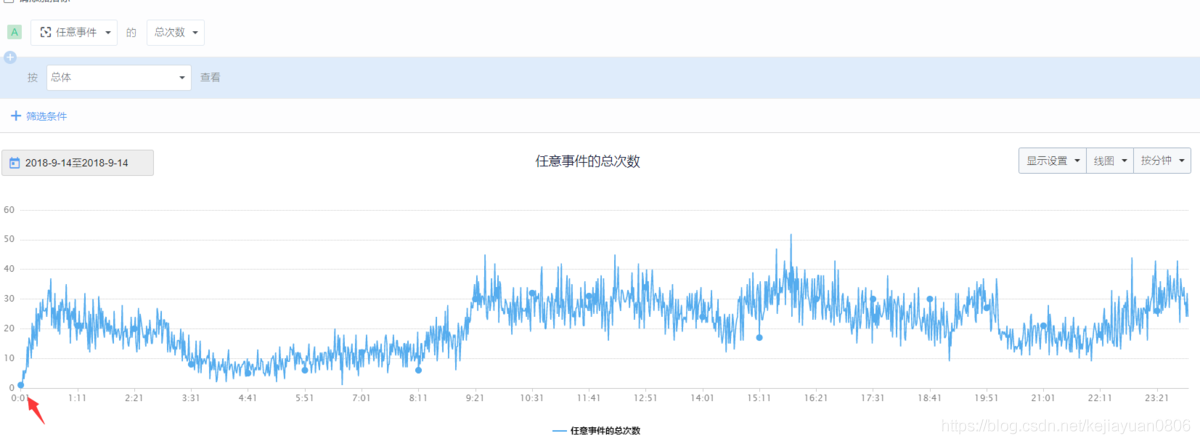
As can be seen from the above figure, at 0:01 on this day, the platform's data is 0, and there has been a cliff-like decline. As for social products, user activity was high at this time in the past, and it can be determined that the abnormal data on this day is indeed because the service is down.
Targeted problem solving : Contact the relevant person in charge to formulate a timely and effective solution.
Implementation : Implement and monitor the implementation effect of the solution.
The above five steps seem simple, but they are based on business insights, and these judgments can be made based on past experience. If you don’t understand your business, no amount of tools or methodology will be useful. Therefore, we need continuous accumulation and continuous verification in the work.
Through the above case analysis, we found that we made many assumptions when determining the problem. In fact, the data is only a supporting tool to verify the assumptions. These assumptions are based on a sufficient understanding of the business. In this process, it is necessary to constantly try and make mistakes and accumulate industry and business insights to make these assumptions.
Common assumptions
1. Activity impact: check the data fluctuations of the corresponding activity page and the corresponding action, and pay attention to whether the activity has geographic attributes
Usually the market or operation will do some activities, so if there is a problem with the data, first look at the PV, UV and other data to see if it is affected by the activity.
2. Version release: use the version number as a dimension to distinguish and view
Sometimes data abnormalities may also be caused by the fluctuations caused by the release of the new version, so you can also look at the version. If the release is V1.5, we can compare the three of V1.3 and V1.4 Version data to see if it is normal.
3. Channel delivery: check the source of channel changes
There are many sources of channels on the WEB side, but APPs are a bit difficult. At this time, you can look at the newly added channel sources to see the impact of changes.
4. Strategy adjustment: when the strategy goes online, distinguish the fluctuations of key indicators before and after
In our work, we will often change the strategy, such as search strategy, recommendation strategy, etc., but after the strategy is changed to go online, it must have a time node for going online. At this time, this time node can be split into just like the case just mentioned. Minutes to observe.
5. Service failure: clarify the failure time, and split it in hours or minutes according to the time dimension
It can be seen from the above case that there is a clear time for the service failure to fail. Observe according to the method described in the above case, and check by minute to see if there is a cliff-like decline. At this time, it can be clear whether the service has appeared. Fault.