Mission statement 
- Task theme: statistics of the authors of the paper, statistics of the names of the top 10 authors of the paper;
- Task content: statistics of the author of the paper, use Pandas to read data and use string operations;
- Task result: learn Pandas string operations;
@DateWhale
" Stay hungry Stay young"
1. Data reading
1.1 Import related packages
# 导入所需的package
import seaborn as sns #用于画图
from bs4 import BeautifulSoup #用于爬取arxiv的数据
import re #用于正则表达式,匹配字符串的模式
import requests #用于网络连接,发送网络请求,使用域名获取对应信息
import json #读取数据,我们的数据为json格式的
import pandas as pd #数据处理,数据分析
import matplotlib.pyplot as plt #画图工具
1.2 read files
Then, define a function specifically for reading files. In fact, task1 should be defined, but it was too lazy at the time--, it turns out that the function is more conducive to subsequent modifications:
def readFile(path,columns=['id','submitter','authors','title','comments','journal-ref','doi','reeport-no','categories','license','abstract','versions','update_date','author_parsed'],count=None):
    """
    定义本函数用于读取文件,在后续工作中也使用这个函数,比较简便
    参数分别为:
    文件路径、
    读取的列名称(固定值为全部读取)
    读取的行数
    """
    data=[]
    with open(path,'r')as f:
        #enumerate函数将可读取的数据对象转化成有序的各个元祖,储存在一个列表中
        for i,line in enumerate(f):
            if i==count:
                break
            d=json.loads(line)
            #下面这一行操作是为了筛选出需要的那些键值对
            d={

    col:d[col]for col in columns}
            data.append(d)
    data=pd.DataFrame(data)#转化为dataframe模式
    return data
path="D:\\arxiv-metadata-oai-snapshot.json"
data=readFile(path,['id', 'authors', 'categories', 'authors_parsed'],100000)#只能读取10万个,否则电脑跑不动- -
2. Statistics
Tasks to be completed:
- Count the top 10 frequency of appearance of all authors' names;
- Top 10 that counts the frequency of occurrence of all authors' last names (the last word of their names);
- Count the frequency of the first character of all authors' last names;
2.1 Take out the author separately as a list
#这里将series中的各个作者加和并和[]求和返回一个列表(好厉害的语法,好想看一下底层实现)
all_authors=sum(data['authors_parsed'],[])
print(all_authors)
Now that all the authors have been stored in this list, the statistics of name frequency are now completed.
Now each author is stored in the form of a list. To remove them and connect them into a list, use the following statement to achieve:
author_names=[''.join(x) for x in all_authors]
author_names=pd.Series(author_names)
2.2 Display of data
The next step is the drawing link, which is implemented using the matplotlib package.
The code is as follows:
Among them, value_counts is used to calculate the frequency of each individual's appearance and return a new dataframe
# 根据作者频率绘制直方图
#定义图的尺寸
plt.figure(figsize=(10, 6))
author_names[0].value_counts().head(10).plot(kind='barh')

# 修改图配置
names = author_names[0].value_counts().index.values[:10]
#上面一行获取了出现前10的行标签对应的值
plt.yticks(range(0, len(names)), names)
#上面一行对y轴的
plt.ylabel('Author')
plt.xlabel('Count')
The output is as follows:

Next, we count the top10 of the last name in the name: the
code is similar, as follows:
authors_lastnames = [x[0] for x in all_authors]
authors_lastnames = pd.DataFrame(authors_lastnames)

plt.figure(figsize=(10, 6))
authors_lastnames[0].value_counts().head(10).plot(kind='barh')

names = authors_lastnames[0].value_counts().index.values[:10]
plt.yticks(range(0, len(names)), names)
plt.ylabel('Author')
plt.xlabel('Count')

They are all Chinese names, too strong!
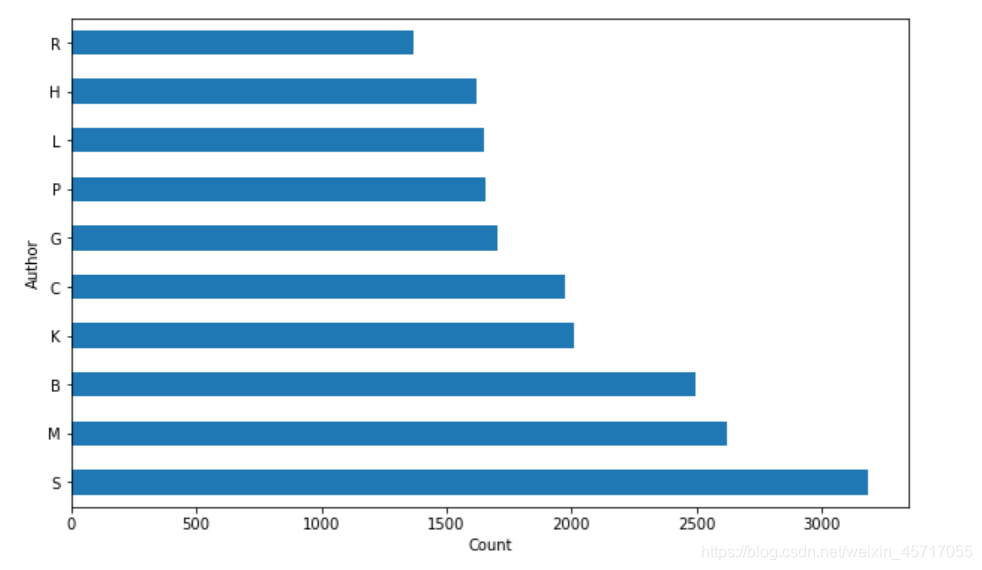
Next, count the frequency of the first character of the author's last name: the
code only needs to be changed to this line:
authors_lastnames = [x[0][0] for x in all_authors]
So far the task is completed, this task is not difficult, next time I hope to try it independently, and then watch the official tutorial!