Whether microservices are suitable for small teams is a matter of opinion. But a small team does not mean that the product must be a small product. When the business becomes more and more complex, how to use microservices to divide and conquer becomes a problem that has to be faced.

Because microservices are a test for the entire team, every step from development to delivery is full of challenges. After more than one year of exploration and practice, in line with the vision of implementing DevOps into products, we have built a microservice platform that suits us step by step.
Do you want microservices
Our product is Linkflow, a customer data platform (CDP) used by business operators. An important part of the product is similar to the "shortcut" of the enterprise version, allowing operators to create enterprise automation processes like building Lego blocks, allowing data to flow without programming.
From this point of view, our business is characterized by gathering less into more, and connecting each service becomes a sea of data.
The concept is the same as that of microservices, and individual small services eventually realize big functions. Of course, we did not use microservices at the beginning. When the business is not yet formed, we start to consider the architecture, then it is "overdesign".
On the other hand, the factors that need to be considered are "people", whether there are people who have experienced microservice projects, whether the team has a DevOps culture, etc., comprehensively consider whether microservices are required.
What are the benefits of microservices?
Compared with a single application, the complexity of each service will be reduced, especially the data level (data table relationship) is clearer, not one application hundreds of tables, new employees get started quickly.
For a stable core business, it can become a service alone, reducing the frequency of release of the service and reducing the pressure on testers.
Different intensive services can be collocated on a physical machine, or a service can be expanded individually to achieve full utilization of hardware resources.
Flexible deployment. In the privatization project, if the customer has unnecessary business, then the corresponding microservice does not need to be deployed, saving hardware costs, just like the Lego brick concept mentioned above.
What are the challenges of microservices?
Once the design is unreasonable, cross calls, and frequent interdependence, there will be a situation that affects the whole body. Imagine that the Service layer in a single application depends on the complex scene.
With more projects, the demand for wheels will increase, and someone needs to focus on the development of public code.
The quality of the development process needs to be strictly controlled through continuous integration (CI) to increase the proportion of automated testing, because often an interface change will involve multiple projects, and it is difficult to cover all situations by manual testing alone.
The release process will become complicated, because microservices need the blessing of containerization for their full capabilities, and container orchestration is the biggest challenge.
Online operation and maintenance, when the system has problems and needs to quickly locate a machine node or specific service, monitoring and link log analysis are essential.
Let's talk about how we deal with these challenges in detail below.
Challenges of the development process
Continuous integration
Standardize the development process through CI, connect automated testing and manual review in series.
We use Gerrit as a code & branch management tool, and follow GitLab's workflow model in process management:
Developers submit code to Gerrit's Magic branch.
The code review staff reviews the code and gives a score.
The Jenkins job corresponding to the Repo monitors the changes on the branch and triggers the Build job. Scores are given after static code inspection by IT and Sonar.
After both Review and Verify are passed, the person in charge of the corresponding Repo Merge the code to the real branch.
If one item fails, repeat the process after code modification.
Gerrit synchronizes and backs up the code to two remote warehouses in real time.
Integration Testing
Generally speaking, the automatic code execution is unit test (Unit Test), that is, it does not rely on any resources (database, message queue) and other services, and only tests the code logic of the system.
But this kind of test requires a lot of mock parts. One is that it is complicated to write, and the other is that there are many test cases that are refactored and changed with the code, which is not agile enough. And once the development team is required to achieve a certain coverage rate, there will be a lot of fraud.
So we choose to test mainly for API, that is, test for Controller layer. In addition, for some public components such as distributed locks, Json serialization modules will also have corresponding test code coverage.
The test code will use a random port to pull up the project when it is running, and initiate a request to the local API through the HTTP Client. The test will only mock external services. Reading and writing of the database and the consumption of the message queue are all real operations, which is equivalent to Complete part of Jmeter's work at the Java level.
The Spring Boot project can easily start such a test environment, the code is as follows:
It is recommended to use io.rest-assured:rest-assured to support JsonPath for HTTP Client during testing, which is very easy to use.
One point to note when testing is the construction and cleaning of test data. The structure is divided into the creation of Schema and the creation of test data:
Schema is processed by Flyway. Before starting the test environment, delete all tables and then create tables.
Test data can be created by reading a SQL file through @Sql, and then clearing the data after a use case is over.
By the way, we sealed it into a separate project based on Flyway's Schema Upgrade function, and each microservice has its own Upgrade project.
Benefits: First, it supports the command-line mode, which allows fine-grained control of the upgraded version; second, it can also support Schema operations after sub-database sub-table. The Upgrade project will also be made into a Docker image and submitted to the Docker hub.
The test is executed every time the code is submitted. Jenkins monitors Gerrit's submission, and executes a Schema Upgrade first through docker run -rm {upgrade project image}, and then Gradle test executes the test.
Finally, test reports and coverage reports will be generated. The coverage reports are generated using JaCoCo's Gradle plugin, as shown below:


One more point here, in addition to integration testing, the interfaces between services must be compatible. In fact, a consumer-driven testing tool is needed.
That is to say, the interface consumer first writes the interface test case, and then publishes it to a public area. When the interface provider publishes the interface, it will also execute the use case of this public area. Once the test fails, it means that the interface is incompatible.
It is recommended that you use Pact or Spring Cloud Contact. Our current contract is based on "human trust". After all, there are not many server-side developers, so there is no need to use such a set of tools.
集成测试的同时还会进行静态代码检查,我们用的是 Sonar,当所有检查通过后 Jenkins 会 +1 分,再由 Reviewer 进行代码 Review。
自动化测试
单独拿自动化测试出来说,就是因为它是质量保证的非常重要的一环,上文能在 CI 中执行的测试都是针对单个微服务的。
那么当所有服务(包括前端页面)都在一起工作的时候是否会出现问题,就需要一个更接近线上的环境来进行测试了。
在自动化测试环节,我们结合 Docker 提高一定的工作效率并提高测试运行时环境的一致性以及可移植性。
在准备好基础的 Pyhton 镜像以及 Webdriver(Selenium)之后,我们的自动化测试工作主要由以下主要步骤组成:
测试人员在本地调试测试代码并提交至 Gerrit。
Jenkins 进行测试运行时环境的镜像制作,主要将引用的各种组件和库打包进一个 Python 的基础镜像。
通过 Jenkins 定时或手动触发,调用环境部署的 Job 将专用的自动化测试环境更新,然后拉取自动化测试代码启动一次性的自动化测试运行时环境的 Docker 容器,将代码和测试报告的路径镜像至容器内。
自动化测试过程将在容器内进行。
测试完成之后,不必手动清理产生的各种多余内容,直接在 Jenkins 上查看发布出来的测试结果与趋势。
关于部分性能测试的执行,我们同样也将其集成到 Jenkins 中,在可以直观的通过一些结果数值来观察版本性能变化情况的回归测试和基础场景,将会很大程度的提高效率,便捷的观察趋势:
测试人员在本地调试测试代码并提交至 Gerrit。
通过 Jenkins 定时或手动触发,调用环境部署的 Job 将专用的性能测试环境更新以及可能的 Mock Server 更新。
拉取最新的性能测试代码,通过 Jenkins 的性能测试插件来调用测试脚本。
测试完成之后,直接在 Jenkins 上查看通过插件发布出来的测试结果与趋势。
发布过程的挑战
上面提到微服务一定需要结合容器化才能发挥全部优势,容器化就意味着线上有一套容器编排平台。我们目前采用是 Redhat 的 OpenShift。
所以发布过程较原来只是启动 Jar 包相比要复杂的多,需要结合容器编排平台的特点找到合适的方法。
镜像准备
公司开发基于 GitLab 的工作流程,Git 分支为 Master,Pre-production和 Prodution 三个分支,同时生产版本发布都打上对应的 Tag。
每个项目代码里面都包含 Dockerfile 与 Jenkinsfile,通过 Jenkins 的多分支 Pipeline 来打包 Docker 镜像并推送到 Harbor 私库上。

Docker 镜像的命令方式为:项目名/分支名:git_commit_id,如 funnel/production:4ee0b052fd8bd3c4f253b5c2777657424fccfbc9。
Tag 版本的 Docker 镜像命名为:项目名 /release:tag 名,如 funnel/release:18.10.R1。
在 Jenkins 中执行 build docker image job 时会在每次 Pull 代码之后调用 Harbor 的 API 来判断此版本的 Docker image 是否已经存在,如果存在就不执行后续编译打包的 Stage。
在 Jenkins 的发布任务中会调用打包 Job,避免了重复打包镜像,这样就大大的加快了发布速度。
数据库 Schema 升级
数据库的升级用的是 Flyway,打包成 Docker 镜像后,在 OpenShift 中创建 Job 去执行数据库升级。
Job 可以用最简单的命令行的方式去创建:

脚本升级任务也集成在 Jenkins 中。
容器发布
OpenShift 有个特别概念叫 DeploymentConfig,原生 Kubernetes Deployment 与之相似,但 OpenShift 的 DeploymentConfig 功能更多。
DeploymentConfig 关联了一个叫做 ImageStreamTag 的东西,而这个 ImagesStreamTag 和实际的镜像地址做关联,当 ImageStreamTag 关联的镜像地址发生了变更,就会触发相应的 DeploymentConfig 重新部署。
我们发布是使用了 Jenkins+OpenShift 插件,只需要将项目对应的 ImageStreamTag 指向到新生成的镜像上,就触发了部署。
如果是服务升级,已经有容器在运行怎么实现平滑替换而不影响业务呢?
配置 Pod 的健康检查,Health Check 只配置了 ReadinessProbe,没有用 LivenessProbe。
因为 LivenessProbe 在健康检查失败之后,会将故障的 Pod 直接干掉,故障现场没有保留,不利于问题的排查定位。而 ReadinessProbe 只会将故障的 Pod 从 Service 中踢除,不接受流量。
使用了 ReadinessProbe 后,可以实现滚动升级不中断业务,只有当 Pod 健康检查成功之后,关联的 Service 才会转发流量请求给新升级的 Pod,并销毁旧的 Pod。
线上运维的挑战
服务间调用
Spring Cloud 使用 Eruka 接受服务注册请求,并在内存中维护服务列表。
当一个服务作为客户端发起跨服务调用时,会先获取服务提供者列表,再通过某种负载均衡算法取得具体的服务提供者地址(IP + Port),即所谓的客户端服务发现。在本地开发环境中我们使用这种方式。
由于 OpenShift 天然就提供服务端服务发现,即 Service 模块,客户端无需关注服务发现具体细节,只需知道服务的域名就可以发起调用。
由于我们有 Node.js 应用,在实现 Eureka 的注册和去注册的过程中都遇到过一些问题,不能达到生产级别。
所以决定直接使用 Service 方式替换掉 Eureka,也为以后采用 Service Mesh 做好铺垫。
具体的做法是,配置环境变量:
EUREKA_CLIENT_ENABLED=false,RIBBON_EUREKA_ENABLED=false
并将服务列表如:
FOO_RIBBON_LISTOFSERVERS: '[http://foo:8080](http://foo:8080/)'
写进 ConfigMap 中,以 envFrom: configMapRef 方式获取环境变量列表。
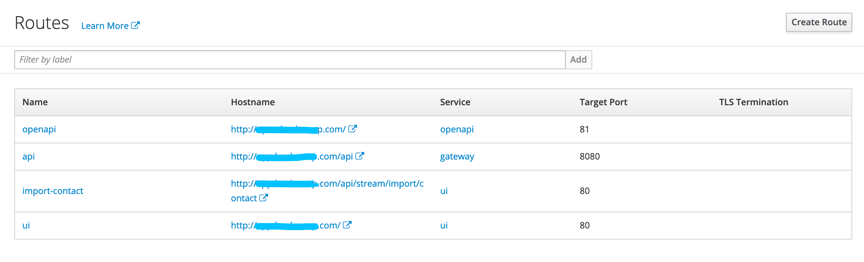
如果一个服务需要暴露到外部怎么办,比如暴露前端的 HTML 文件或者服务端的 Gateway。
OpenShift 内置的 HAProxy Router,相当于 Kubernetes 的 Ingress,直接在 OpenShift 的 Web 界面里面就可以很方便的配置。
我们将前端的资源也作为一个 Pod 并有对应的 Service,当请求进入 HAProxy 符合规则就会转发到 UI 所在的 Service。
Router 支持 A/B test 等功能,唯一的遗憾是还不支持 URL Rewrite。

对于需要 URL Rewrite 的场景怎么办?那么就直接将 Nginx 也作为一个服务,再做一层转发。流程变成 Router → Nginx Pod → 具体提供服务的 Pod。
链路跟踪
开源的全链路跟踪很多,比如 Spring Cloud Sleuth + Zipkin,国内有美团的 CAT 等等。
其目的就是当一个请求经过多个服务时,可以通过一个固定值获取整条请求链路的行为日志,基于此可以再进行耗时分析等,衍生出一些性能诊断的功能。
不过对于我们而言,首要目的就是 Trouble Shooting,出了问题需要快速定位异常出现在什么服务,整个请求的链路是怎样的。
为了让解决方案轻量,我们在日志中打印 RequestId 以及 TraceId 来标记链路。
RequestId 在 Gateway 生成表示唯一一次请求,TraceId 相当于二级路径,一开始与 RequestId 一样,但进入线程池或者消息队列后,TraceId 会增加标记来标识唯一条路径。
举个例子,当一次请求向 MQ 发送一个消息,那么这个消息可能会被多个消费者消费,此时每个消费线程都会自己生成一个 TraceId 来标记消费链路。加入 TraceId 的目的就是为了避免只用 RequestId 过滤出太多日志。
In terms of implementation, all calls in the APIRequestContext serial single service are stored through ThreadLocal.
When calling across services, the APIRequestContext information is converted into HTTP Header. After the callee obtains the HTTP Header, the APIRequestContext is constructed again and placed in ThreadLocal, and the loop is repeated to ensure that the RequestId and TraceId are not lost.
If you enter MQ, then the APIRequestContext information can be converted into Message Header (based on RabbitMQ implementation).
After the logs are summarized in the log system, if there is a problem, you only need to capture the abnormal RequestId or TraceId to locate the problem.
After a year of use, it can basically meet most of the Trouble Shooting scenarios, and you can locate a specific business within half an hour.
Container monitoring
The Telegraf probe was used for monitoring before containerization, and Prometheus was used after containerization, and the cluster-monitoring-operator that comes with OpenShift was installed directly.
The built-in monitoring items are relatively comprehensive, including the monitoring of Node and Pod resources, and they will be automatically added after adding a Node.
The Java project also added Prometheus monitoring endpoints, but unfortunately the configuration provided by cluster-monitoring-operator is read-only. Later, we will study how to integrate Java's JVM monitoring.

to sum up
Open source software is a boon for small and medium-sized teams. Both Spring Cloud and Kubernetes have greatly reduced the team's time cost in infrastructure construction.
Of course, there are more topics, such as service upgrades and downgrades, current limiting fuse, distributed task scheduling, grayscale release, function switching, etc., all need more time to discuss.
For a small team, you should choose a microservice technical solution based on your own situation. You can't blindly chase after the new. The best for you is the best.