Online faults mainly include CPU, disk, memory, and network problems, and most faults may include more than one level of problems, so when troubleshooting, try to check the four aspects in turn. At the same time, tools such as jstack and jmap are not limited to one aspect of the problem. Basically, the problem is df, free, and top, and then jstack and jmap are served in turn. The specific problems can be analyzed in detail.
CPU
Generally speaking, we will first troubleshoot CPU problems. CPU exceptions are often easier to locate. Reasons include business logic problems (endless loop), frequent gc, and excessive context switching. The most common is often caused by business logic (or framework logic), you can use jstack to analyze the corresponding stack situation.
Use jstack to analyze CPU problems
We first use the ps command to find the pid of the corresponding process (if you have several target processes, you can use top to see which occupies higher).
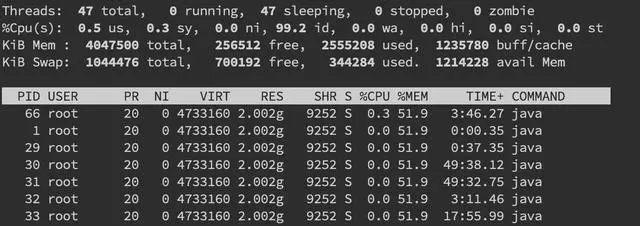
Then use top -H -p pid to find some threads with higher CPU usage
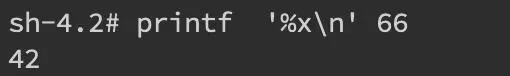
Then convert the highest pid to hexadecimal printf'%x\n' pid to get nid
Then directly find the corresponding stack information in jstack jstack pid |grep'nid' -C5 --color
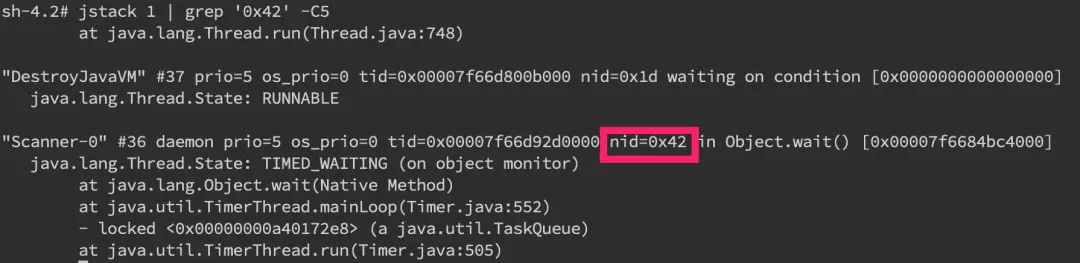
You can see that we have found the stack information with nid 0x42, and then we just need to analyze it carefully.
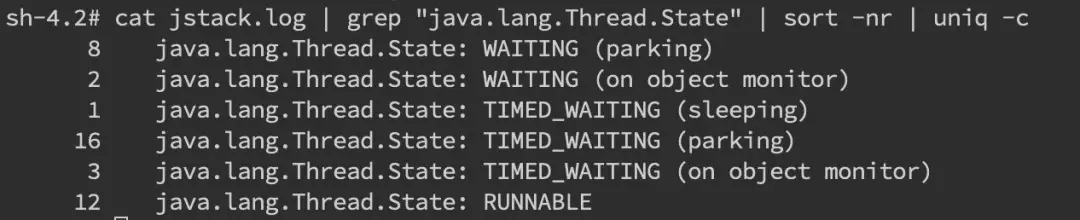
Of course, it is more common for us to analyze the entire jstack file. Usually we will pay more attention to the WAITING and TIMED_WAITING parts, and BLOCKED need not be mentioned. We can use the command cat jstack.log | grep "java.lang.Thread.State" | sort -nr | uniq -c to have an overall grasp of the state of jstack. If there are too many WAITING and the like, then most of them are Problem.
Frequent gc
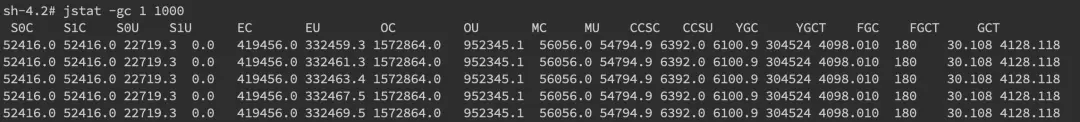
Of course, we will still use jstack to analyze the problem, but sometimes we can first determine whether the gc is too frequent, and use the jstat -gc pid 1000 command to observe the generational changes of gc. 1000 represents the sampling interval (ms), S0C /S1C, S0U/S1U, EC/EU, OC/OU, MC/MU represent the capacity and usage of the two Survivor area, Eden area, old age, and metadata area respectively. YGC/YGT, FGC/FGCT, GCT represent the time and frequency of YoungGc, FullGc and the total time.
Context switch
For frequent context problems, we can use the vmstat command to view
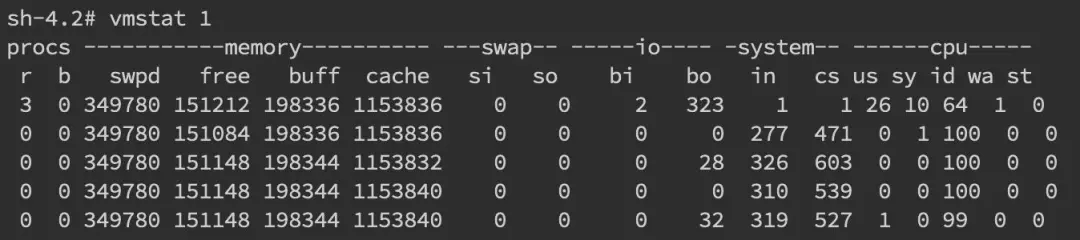
The cs (context switch) column represents the number of context switches.
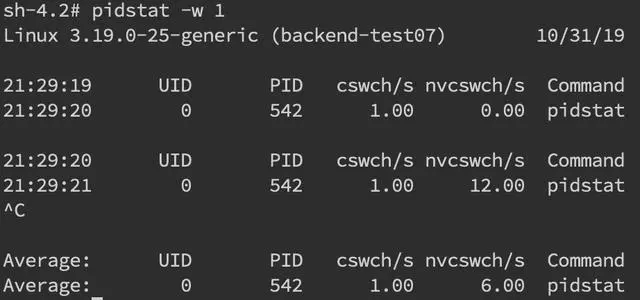
If we want to monitor a specific pid, we can use the pidstat -w pid command, cswch and nvcswch indicate voluntary and involuntary switching.
Disk
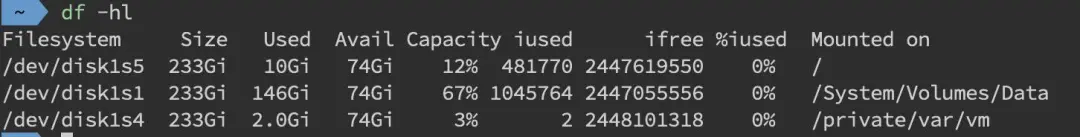
Disk problems are as basic as CPUs. The first is disk space, we directly use df -hl to view the file system status
More often, the disk problem is still a performance problem. We can analyze by iostatiostat -d -k -x
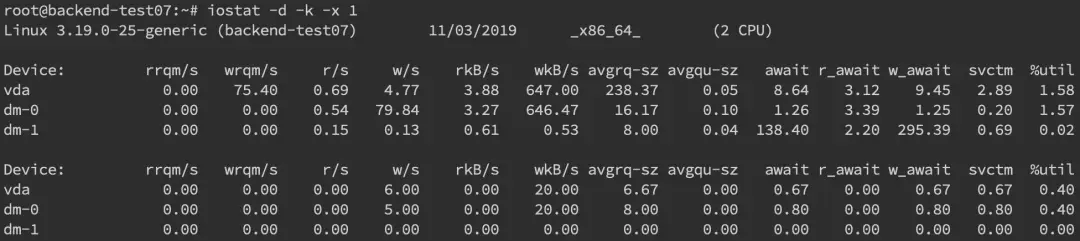
The last column %util can see the degree of writing to each disk, and rrqpm/s and wrqm/s respectively indicate the read and write speeds, which can generally help locate the specific disk that has a problem.
In addition, we also need to know which process is reading and writing. Generally speaking, the developer knows it well, or uses the iotop command to locate the source of file reading and writing.
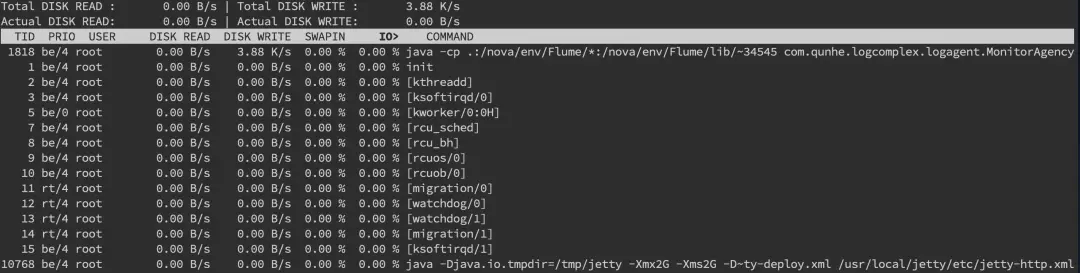
But what we got here is tid, we need to convert it to pid, we can find pidreadlink -f /proc/*/task/tid/../.. through readlink.

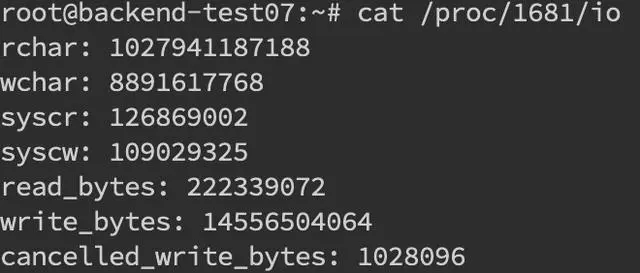
After finding the pid, you can see the specific read and write conditions of this process cat /proc/pid/io
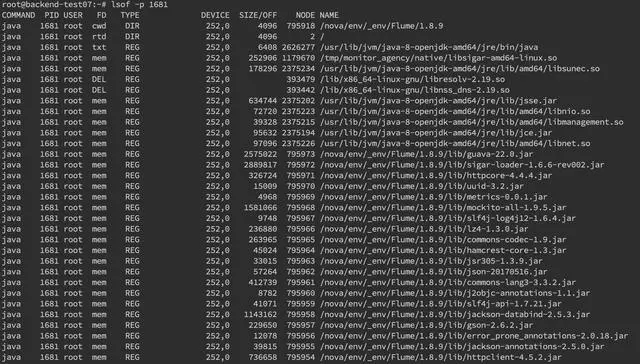
We can also use the lsof command to determine the specific file read and write conditions lsof -p pid
RAM
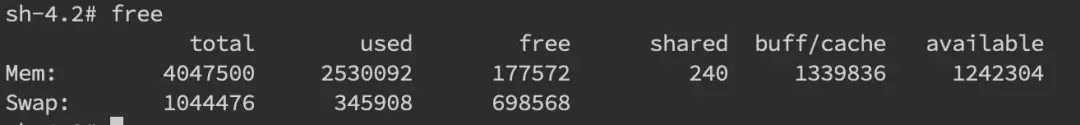
Memory problems are more troublesome than CPU, and there are more scenarios. Mainly include OOM, GC issues and off-heap memory. Generally speaking, we will first use the free command to check the various conditions of the memory of a shot.
In-heap memory
Most of the memory problems are still heap memory problems. In appearance, it is mainly divided into OOM and Stack Overflo.
UNCLE
Insufficient memory in JMV, OOM can be roughly divided into the following types:
Exception in thread "main" java.lang.OutOfMemoryError: unable to create new native thread
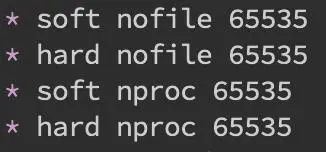
This means that there is not enough memory space to allocate the Java stack to the thread. Basically, there is still a problem with the thread pool code, such as forgetting to shut down, so we should first look for the problem at the code level, using jstack or jmap. If everything is normal, the JVM can reduce the size of a single thread stack by specifying Xss. In addition, at the system level, you can increase the thread limit of os by modifying /etc/security/limits.confnofile and nproc
Exception in thread "main" java.lang.OutOfMemoryError: Java heap space
This means that the memory usage of the heap has reached the maximum value set by -Xmx, which should be the most common OOM error. The solution is still to find it in the code first. If there is a memory leak, use jstack and jmap to locate the problem. If everything is normal, you need to adjust the value of Xmx to expand the memory.
Caused by: java.lang.OutOfMemoryError: Meta space
This means that the memory usage of the metadata area has reached the maximum value set by XX:MaxMetaspaceSize. The troubleshooting idea is the same as the above. The parameters can be adjusted through XX:MaxPermSize (not to mention the permanent generation before 1.8).
Stack Overflow
The stack memory overflows, and everyone sees more of this.
Exception in thread "main" java.lang.StackOverflowError
Indicates that the memory required by the thread stack is greater than the Xss value, and it is also checked first. The parameters are adjusted through Xss, but too large adjustment may cause OOM.
Use JMAP to locate code memory leaks
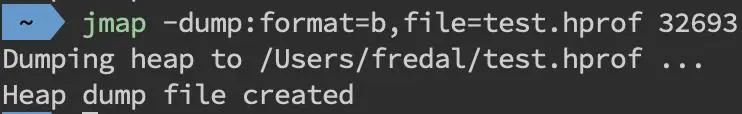
For the above code investigation on OOM and Stack Overflo, we generally use JMAPjmap -dump:format=b,file=filename pid to export dump files
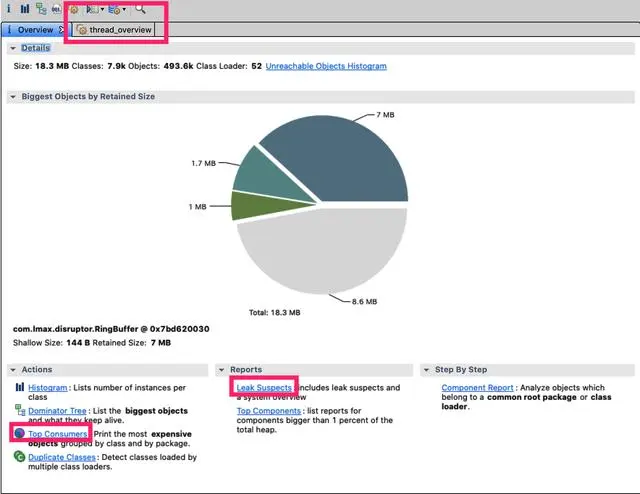
Use mat (Eclipse Memory Analysis Tools) to import the dump file for analysis. Generally, we can directly select Leak Suspects for memory leaks. Mat gives suggestions on memory leaks. You can also choose Top Consumers to view the largest object report. Questions related to threads can be analyzed by selecting thread overview. In addition, choose the Histogram class overview to analyze it yourself slowly. You can search for related tutorials on mat.
In daily development, memory leaks in code are relatively common and relatively hidden, requiring developers to pay more attention to details. For example, each request is a new object, resulting in a large number of repeated creation of objects; file stream operations are performed but not closed properly; manual improper triggering of gc; unreasonable ByteBuffer cache allocation, etc. will cause code OOM.
On the other hand, we can specify -XX:+HeapDumpOnOutOfMemoryError in the startup parameters to save the dump file in OOM.
gc issues and threads
The gc problem affects not only the CPU but also the memory, and the troubleshooting ideas are also consistent. Generally, use jstat first to check the generational changes, such as whether the number of youngGC or fullGC is too much; whether the increase of EU, OU and other indicators is abnormal.
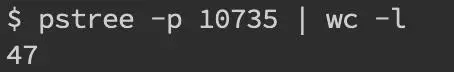
If there are too many threads and the gc is not in time, oom will also be triggered. Most of them are disabled to create new native thread. In addition to detailed analysis of the dump file by jstack, we generally look at the overall thread first, through pstreee -p pid |wc -l.
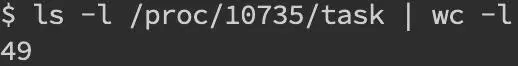
Or you can directly view the number of /proc/pid/task as the number of threads.
Off-heap memory
If you encounter an out-of-heap memory overflow, it is really unfortunate. First of all, the performance of the off-heap memory overflow is the rapid growth of the physical resident memory. If an error is reported, the usage method is uncertain. If it is caused by using Netty, an OutOfDirectMemoryError error may appear in the error log. If it is DirectByteBuffer directly, it will report OutOfMemoryError: Direct buffer memory.
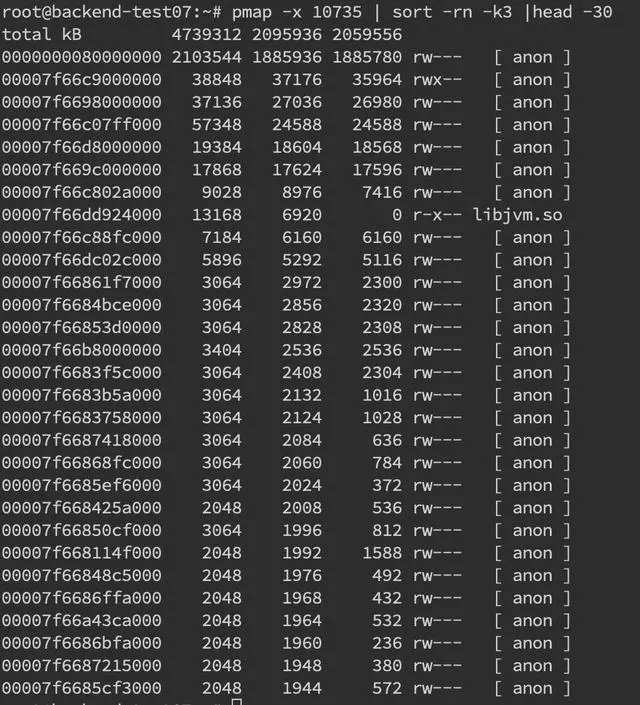
Out-of-heap memory overflow is often related to the use of NIO. Generally, we first use pmap to view the memory occupied by the process pmap -x pid | sort -rn -k3 | head -30, this section means to view the corresponding pid in the first 30 in reverse order Large memory segment. Here you can run the command again after a while to see the memory growth, or where the memory segments are suspicious compared to normal machines.
If we determine that there is a suspicious memory terminal, we need to analyze gdb through gdb --batch --pid {pid} -ex "dump memory filename.dump {memory starting address} {memory starting address + memory block size}"

After obtaining the dump file, you can use heaxdump to view it hexdump -C filename | less, but most of what you see are binary garbled characters.
NMT is a new HotSpot feature introduced by Java7U40. With the jcmd command, we can see the specific memory composition. Need to add -XX:NativeMemoryTracking=summary or -XX:NativeMemoryTracking=detail to the startup parameters, there will be a slight performance loss.
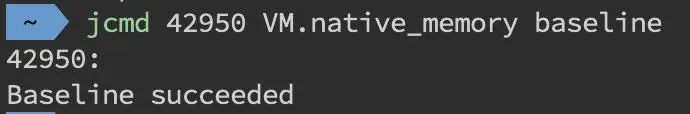
Generally, for the situation where the off-heap memory grows slowly until it explodes, a baseline jcmd pid VM.native_memory baseline can be set first.
Then wait for a period of time to see the memory growth, and do a summary or detail level diff through jcmd pid VM.native_memory detail.diff (summary.diff).

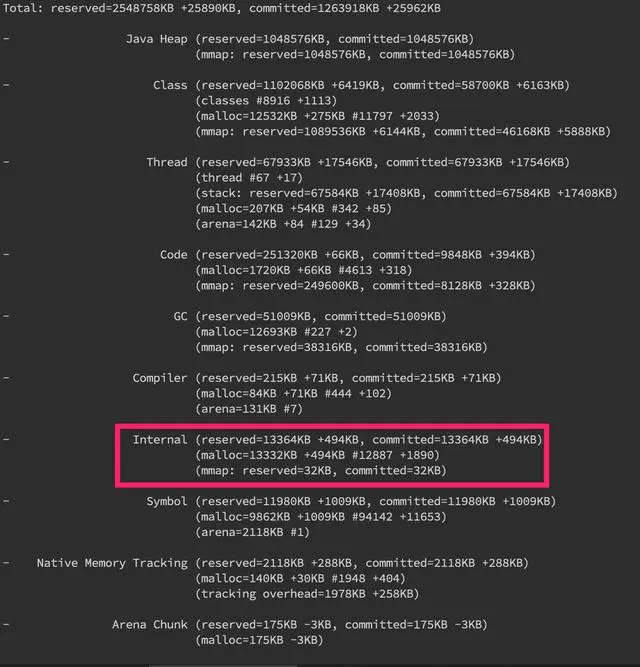
You can see that the memory analyzed by jcmd is very detailed, including heap, thread, and gc (so the other memory exceptions mentioned above can actually be analyzed by nmt). Here we focus on the memory growth of Internal memory, if the growth is very obvious Then there is a problem.
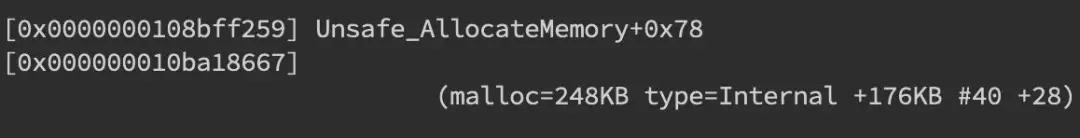
At the detail level, there will also be the growth of specific memory segments, as shown in the figure below.
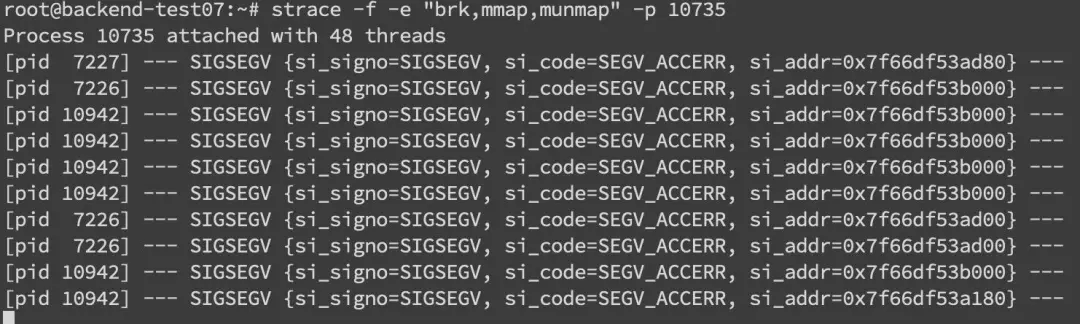
In addition, at the system level, we can also use the strace command to monitor memory allocation strace -f -e "brk,mmap,munmap" -p pid
The memory allocation information here mainly includes pid and memory address.
However, it is difficult to locate the specific problem with the above operations. The key is to look at the error log stack, find the suspicious object, figure out its recovery mechanism, and then analyze the corresponding object. For example, if DirectByteBuffer allocates memory, full GC or manual system.gc is required to recycle it (so it is best not to use -XX:+DisableExplicitGC). In fact, we can track the memory situation of the DirectByteBuffer object, and manually trigger fullGC through jmap -histo:live pid to see if the off-heap memory has been recycled. If it is reclaimed, there is a high probability that the off-heap memory itself is allocated too small, which can be adjusted by -XX:MaxDirectMemorySize. If there is no change, then use jmap to analyze the objects that cannot be gc and the reference relationship with DirectByteBuffer.
GC issues
In-heap memory leaks are always accompanied by GC exceptions. However, GC issues are not only related to memory issues, but may also cause a series of complications such as CPU load and network issues. They are only relatively closely related to memory, so we will summarize GC related issues here separately.
We introduced the use of jstat in the CPU chapter to obtain the current GC generational change information. More often, we use the GC log to troubleshoot the problem. Add -verbose:gc -XX:+PrintGCDetails -XX:+PrintGCDateStamps -XX:+PrintGCTimeStamps to the startup parameters to turn on the GC log.
The meaning of common Young GC and Full GC logs will not be repeated here.
For the gc log, we can roughly infer whether youngGC and fullGC are too frequent or take too long, so we can prescribe the right medicine. We will analyze the G1 garbage collector below. It is also recommended that you use G1-XX:+UseG1GC.
youngGC too frequent
Frequent youngGC generally means that there are many small objects with short periods. First consider whether the Eden area/Cenozoic setting is too small, and see if the problem can be solved by adjusting the parameter settings such as -Xmn and -XX:SurvivorRatio. If the parameters are normal, but the young gc frequency is still too high, you need to use Jmap and MAT to further investigate the dump file.
youngGC takes too long
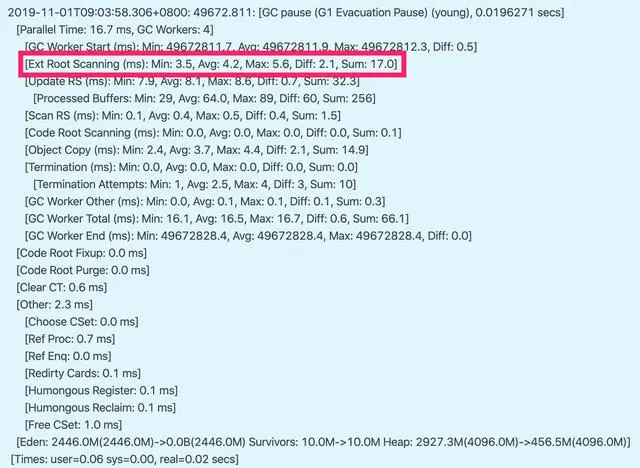
The problem of excessive time-consuming depends on which part of the GC log is time-consuming. Take G1 log as an example, you can focus on Root Scanning, Object Copy, Ref Proc and other stages. Ref Proc takes a long time, so pay attention to referencing related objects. Root Scanning takes a long time, so pay attention to the number of threads and cross-generation references. Object Copy needs to pay attention to the object life cycle. And time-consuming analysis requires horizontal comparison, that is, time-consuming comparison with other projects or normal time periods. For example, if the Root Scanning in the figure increases more than the normal time period, it means that there are too many threads.
Trigger fullGC
G1 is more of mixedGC, but mixedGC can be investigated in the same way as youngGC. When fullGC is triggered, there will generally be problems. G1 will degenerate and use the Serial collector to clean up the garbage. The pause time reaches the second level, which can be said to be half kneeling.
The reasons for fullGC may include the following, as well as some ideas for parameter adjustment:
- Concurrent phase failure: In the concurrent marking phase, the old generation is filled up before MixGC, then G1 will give up the marking cycle at this time. In this case, it may be necessary to increase the heap size, or adjust the number of concurrent marking threads-XX: ConcGCThreads.
- Promotion failure: There is not enough memory for the survival/promotion object during GC, so Full GC is triggered. At this time, you can increase the percentage of reserved memory through -XX:G1ReservePercent, reduce -XX:InitiatingHeapOccupancyPercent to start the mark in advance, and -XX:ConcGCThreads to increase the number of marked threads is also possible.
- Large object allocation failure: Large objects cannot find a suitable region space for allocation, and fullGC will be performed. In this case, you can increase the memory or increase -XX:G1HeapRegionSize.
- The program actively executes System.gc(): don't just write it casually.
In addition, we can configure -XX:HeapDumpPath=/xxx/dump.hprof in the startup parameters to dump fullGC related files, and use jinfo to dump before and after gc
jinfo -flag +HeapDumpBeforeFullGC pid
jinfo -flag +HeapDumpAfterFullGC pid
jinfo -flag +HeapDumpBeforeFullGC pid
jinfo -flag +HeapDumpAfterFullGC pid
In this way, two dump files are obtained. After comparison, the main focus is on the problem objects dropped by gc to locate the problem.
The internet
The issues related to the network level are generally more complicated, with many scenarios and difficult positioning, which has become a nightmare for most developments, and should be the most complicated. Here will give some examples, and explain from the tcp layer, application layer and the use of tools.
time out
Most of the timeout errors are at the application level, so this one focuses on understanding concepts. Timeouts can be roughly divided into connection timeouts and read-write timeouts. Some client frameworks that use connection pools also have connection acquisition timeouts and idle connection cleanup timeouts.
- Read and write timeout. readTimeout/writeTimeout, some frameworks are called so_timeout or socketTimeout, both refer to data read and write timeout. Note that most of the timeouts here refer to logical timeouts. The timeout of soa also refers to the read timeout. Read and write timeouts are generally only set for the client.
- Connection timed out. connectionTimeout, the client usually refers to the maximum time to establish a connection with the server. The connectionTimeout on the server side is a bit varied, Jetty represents the idle connection cleanup time, and Tomcat represents the maximum time the connection is maintained.
- other. Including connection acquisition timeout connectionAcquireTimeout and idle connection cleanup timeout idleConnectionTimeout. It is mostly used for client or server frameworks that use connection pools or queues.
When we set various timeouts, we need to confirm that we try to keep the client's timeout less than the server's timeout to ensure that the connection ends normally.
In actual development, we are most concerned about the read and write timeout of the interface.
How to set a reasonable interface timeout is a problem. If the interface timeout is set too long, it may occupy the server's tcp connection too much. If the interface setting is too short, the interface timeout will be very frequent.
The server interface obviously reduces rt, but the client still keeps timeout is another problem. This problem is actually very simple. The link from the client to the server includes network transmission, queuing, and service processing. Each link may be a time-consuming cause.
TCP queue overflow
TCP queue overflow is a relatively low-level error, which may cause more superficial errors such as timeouts and rst. Therefore, the error is more concealed, so let's talk about it separately.
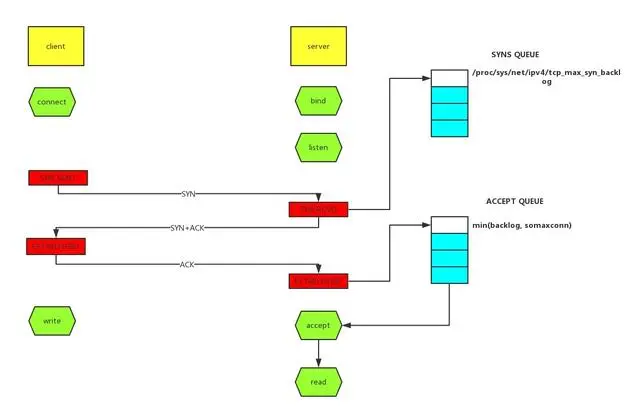
As shown in the figure above, there are two queues: syns queue (semi-connected queue) and accept queue (fully connected queue). Three-way handshake. After the server receives the client's syn, it puts the message on the syns queue and responds with syn+ack to the client. The server receives the client's ack. If the accept queue is not full at this time, it will take out the temporary storage from the syns queue Put the information in the accept queue, otherwise follow the execution indicated by tcp_abort_on_overflow.
tcp_abort_on_overflow 0 means that if the accept queue is full during the third step of the three-way handshake, then the server throws away the ack sent by the client. tcp_abort_on_overflow 1 means that if the full connection queue is full in the third step, the server sends an rst packet to the client, indicating that the handshake process and this connection are abolished, which means that there may be many connection reset / connection reset by peers in the log.
So in actual development, how can we quickly locate the tcp queue overflow?
netstat command, execute netstat -s | egrep "listen|LISTEN"
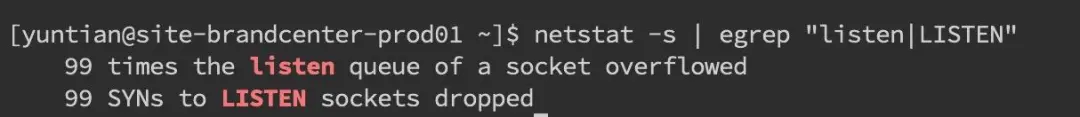
As shown in the figure above, overflowed represents the number of overflows of the fully connected queue, and sockets dropped represents the number of overflows of the semi-connected queue.
ss command, execute ss -lnt

As seen above, Send-Q indicates that the maximum number of fully connected queues on the listen port in the third column is 5, and the first column Recv-Q is how much the fully connected queue currently uses.
Then let's see how to set the size of the fully connected and semi-connected queues:
The size of the fully connected queue depends on min(backlog, somaxconn). The backlog is passed in when the socket is created, and somaxconn is an os-level system parameter. The size of the semi-connection queue depends on max(64, /proc/sys/net/ipv4/tcp_max_syn_backlog).
In daily development, we often use the servlet container as the server, so we sometimes need to pay attention to the connection queue size of the container. The backlog in Tomcat is called acceptCount, and in Jetty it is acceptQueueSize.
RST exception
The RST packet represents a connection reset and is used to close some useless connections. It usually represents an abnormal close, which is different from four waves of hands.
In actual development, we often see connection reset / connection reset by peer errors, which are caused by the RST package.
Port does not exist
If a SYN request is sent for a connection establishment like a port that does not exist, the server will directly return a RST message to interrupt the connection if it finds that it does not have this port.
Actively replace FIN to terminate the connection
Generally speaking, normal connection closure needs to be achieved through FIN messages, but we can also use RST messages instead of FIN to directly terminate the connection. In actual development, you can set the value of SO_LINGER to control. This is often deliberate, to skip TIMED_WAIT, to provide interactive efficiency, and use it with caution.
An exception occurs on one side of the client or server, and the other side sends an RST to tell the other to close the connection.
The tcp queue overflow we mentioned above to send RST packets actually belongs to this kind. This is often due to some reasons, one party can no longer normally process the request connection (for example, the program crashes, the queue is full), and the other party is notified to close the connection.
The received TCP packet is not in a known TCP connection
For example, if one party's machine has a TCP packet missing due to a bad network, the other party closes the connection, and then receives the missing TCP packet after a long time, but because the corresponding TCP connection no longer exists, it will send one directly RST packet to open a new connection.
One party has not received the confirmation message from the other party for a long time, and sends an RST message after a certain period of time or retransmission times
Most of this is also related to the network environment, and a poor network environment may cause more RST packets.
I said before that many RST messages will cause the program to report an error. A read operation on a closed connection will report connection reset, and a write operation on a closed connection will report connection reset by peer. Usually we may also see broken pipe errors. This is a pipe-level error. It means reading and writing to a closed pipe. It is often an error that reads and writes data after receiving an RST and reporting a connection reset error. It is also introduced in the glibc source code comments.
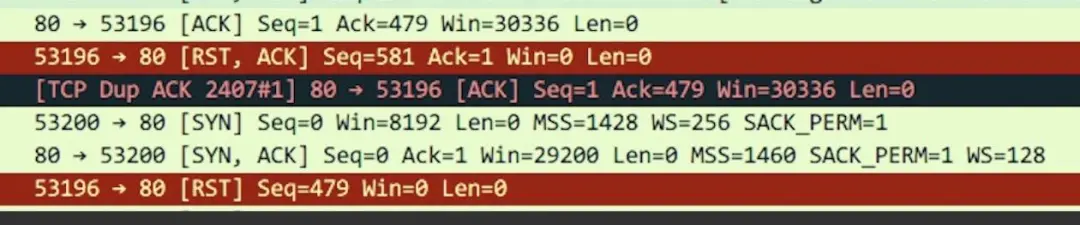
How do we determine the existence of the RST package when troubleshooting? Of course, use the tcpdump command to capture packets, and use wireshark for a simple analysis. tcpdump -i en0 tcp -w xxx.cap, en0 represents the monitoring network card.

Next, we open the captured packet through wireshark, and you may be able to see the following figure. The red one represents the RST packet.
TIME_WAIT 和 CLOSE_WAIT
I believe everyone knows what TIME_WAIT and CLOSE_WAIT mean.
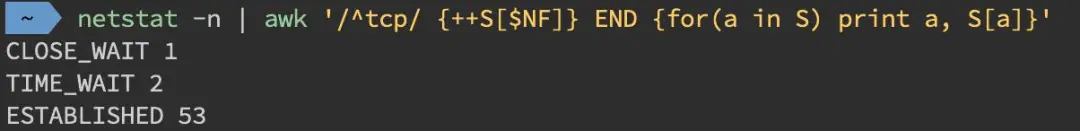
When online, we can directly use the command netstat -n | awk'/^tcp/ {++S[$NF]} END {for(a in S) print a, S[a]}' to view time-wait And the number of close_wait
Using the ss command will be faster ss -ant | awk'{++S[$1]} END {for(a in S) print a, S[a]}'
TIME_WAIT
The existence of time_wait is for the lost data packets to be reused by the subsequent connection, and the second is to close the connection normally within the time range of 2MSL. Its existence will actually greatly reduce the appearance of RST packets.
Excessive time_wait is more likely to occur in scenarios with frequent short connections. In this case, you can do some kernel parameter tuning on the server side:
# Indicates that reuse is enabled. Allow TIME-WAIT sockets to be reused for new TCP connections, the default is 0, which means it is closed
net.ipv4.tcp_tw_reuse = 1
#Indicates that the fast recovery of TIME-WAIT sockets in the TCP connection is turned on, the default is 0, which means it is closed
net.ipv4.tcp_tw_recycle = 1
Of course, we should not forget the pit of data packet rejection in the NAT environment due to incorrect timestamps. Another way is to change tcp_max_tw_buckets to a smaller value. Time_wait exceeding this number will be killed, but this will also result in the report of time wait bucket table overflow. wrong.
CLOSE_WAIT
The close_wait is often because the application program has written problems, and the FIN message is not initiated again after the ACK. The probability of close_wait is even higher than that of time_wait, and the consequences are more serious. It is often because a place is blocked and the connection is not closed normally, thus gradually consuming all threads.
To locate such problems, it is best to use jstack to analyze the thread stack to troubleshoot the problem. For details, please refer to the above chapters. Here is just one example.
The development students said that CLOSE_WAIT kept increasing after the application went online, until it hung up. After jstack found the suspicious stack, most of the threads were stuck in the countdownlatch.await method. After consulting the development students, they learned that multi-threading was used but it did not. Catch exception, the exception found after modification is just the simplest class not found that often appears after upgrading the SDK.
Author: fredal
Source: https://fredal.xin/java-error-check