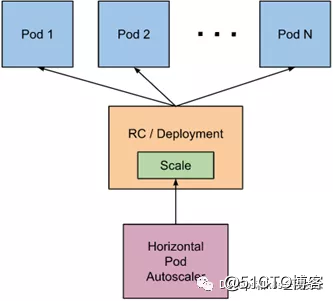
The full name of HPA is Horizontal Pod Autoscaler, which translates into Chinese as POD horizontal automatic scaling. HPA will be used instead of Horizontal Pod Autoscaler in the following. HPA can automatically expand and shrink the number of pods in replication controller, deployment, and replication case based on CPU utilization (except CPU (Utilization rate can also be automatically expanded or reduced based on the custom metrics provided by other applications). Pod auto scaling is not suitable for objects that cannot be scaled, such as DaemonSets. HPA is implemented by Kubernetes API resources and controllers. Resources determine the behavior of the controller. The controller periodically obtains the average CPU utilization and compares it with the target value and then adjusts the number of copies in the replication controller or deployment.
The detailed introduction of custom metrics is as follows:
https://github.com/kubernetes/community/blob/master/contributors/design-proposals/instrumentation/custom-metrics-api.mdThe reference official website address is as follows:
https://v1-17.docs.kubernetes.io/docs/tasks/run-application/horizontal-pod-autoscale-walkthrough/1. Working principle of HPA
The implementation of HPA is a control cycle, which is specified by the controller manager's --horizontal-pod-autoscaler-sync-period parameter (the default value is 15 seconds). In each cycle, the controller manager queries resource utilization according to the indicators specified in each HorizontalPodAutoscaler definition. The controller manager can obtain metrics from the resource metrics API (pod resource metrics) and custom metrics API (custom metrics).
1) For the resource indicator of each pod (such as CPU), the controller obtains the indicator of each pod specified by the HorizontalPodAutoscaler from the resource indicator API, and then, if the target usage rate is set, the controller obtains the container resource in each pod Usage, and calculate resource usage. If the original value is used, the original data will be used directly (the percentage is no longer calculated). Then, the controller calculates the scaling ratio according to the average resource usage rate or the original value, and then calculates the target number of copies. It should be noted that if some pod containers do not support resource collection, then the controller will not use the CPU usage of the pod
2) If the pod uses a custom indicator, the controller mechanism is similar to the resource indicator. The difference is that the custom indicator only uses the original value, not the usage rate.
3) If the pod uses object indicators and external indicators (each indicator describes an object information). This indicator will be directly compared to the target setting and generate a zoom ratio mentioned above. In the autoscaling / v2beta2 API, this indicator can also be calculated based on the number of pods divided equally. Normally, the controller will obtain indicator data from a series of aggregate APIs (metrics.k8s.io, custom.metrics.k8s.io, and external.metrics.k8s.io). The metrics.k8s.io API is usually provided by metrics-server (requires additional startup).
二、metrics server
Metrics-server is a cluster-wide resource data set and tool. Similarly, metrics-server only displays data and does not provide data storage services. The main concern is the implementation of resource measurement APIs, such as CPU, file descriptors, Indicators such as memory and request delay, metric-server collects data for use in k8s clusters, such as kubectl, hpa, scheduler, etc.
1. Deploy metrics-server and operate on the master node of k8s
1) Get the image offline
The required image is:
k8s.gcr.io/metrics-server-amd64:v0.3.6和
k8s.gcr.io/addon-resizer:1.8.4
The address of the Baidu network disk where the mirror is located is as follows:
链接:https://pan.baidu.com/s/1SKpNaskVr_zQJVQuM_GzIQ
提取码:24yb
链接:https://pan.baidu.com/s/1KXOSiSJGGGaUXCjdCHoXjQ
提取码:yab5
If your machine cannot access the external network, you can upload the image to each node of k8s and manually decompress it as follows
docker load -i metrics-server-amd64_0_3_1.tar.gz
docker load -i addon.tar.gz
2) metrics.yaml file
cat metrics.yaml
apiVersion: rbac.authorization.k8s.io/v1
kind: ClusterRoleBinding
metadata:
  name: metrics-server:system:auth-delegator
  labels:
    kubernetes.io/cluster-service: "true"
    addonmanager.kubernetes.io/mode: Reconcile
roleRef:
  apiGroup: rbac.authorization.k8s.io
  kind: ClusterRole
  name: system:auth-delegator
subjects:
- kind: ServiceAccount
  name: metrics-server
  namespace: kube-system
---
apiVersion: rbac.authorization.k8s.io/v1
kind: RoleBinding
metadata:
  name: metrics-server-auth-reader
  namespace: kube-system
  labels:
    kubernetes.io/cluster-service: "true"
    addonmanager.kubernetes.io/mode: Reconcile
roleRef:
  apiGroup: rbac.authorization.k8s.io
  kind: Role
  name: extension-apiserver-authentication-reader
subjects:
- kind: ServiceAccount
  name: metrics-server
  namespace: kube-system
---
apiVersion: v1
kind: ServiceAccount
metadata:
  name: metrics-server
  namespace: kube-system
  labels:
    kubernetes.io/cluster-service: "true"
    addonmanager.kubernetes.io/mode: Reconcile
---
apiVersion: rbac.authorization.k8s.io/v1
kind: ClusterRole
metadata:
  name: system:metrics-server
  labels:
    kubernetes.io/cluster-service: "true"
    addonmanager.kubernetes.io/mode: Reconcile
rules:
- apiGroups:
  - ""
  resources:
  - pods
  - nodes
  - nodes/stats
  - namespaces
  verbs:
  - get
  - list
  - watch
- apiGroups:
  - "extensions"
  resources:
  - deployments
  verbs:
  - get
  - list
  - update
  - watch
---
apiVersion: rbac.authorization.k8s.io/v1
kind: ClusterRoleBinding
metadata:
  name: system:metrics-server
  labels:
    kubernetes.io/cluster-service: "true"
    addonmanager.kubernetes.io/mode: Reconcile
roleRef:
  apiGroup: rbac.authorization.k8s.io
  kind: ClusterRole
  name: system:metrics-server
subjects:
- kind: ServiceAccount
  name: metrics-server
  namespace: kube-system
---
apiVersion: v1
kind: ConfigMap
metadata:
  name: metrics-server-config
  namespace: kube-system
  labels:
    kubernetes.io/cluster-service: "true"
    addonmanager.kubernetes.io/mode: EnsureExists
data:
  NannyConfiguration: |-
    apiVersion: nannyconfig/v1alpha1
    kind: NannyConfiguration
---
apiVersion: apps/v1
kind: Deployment
metadata:
  name: metrics-server
  namespace: kube-system
  labels:
    k8s-app: metrics-server
    kubernetes.io/cluster-service: "true"
    addonmanager.kubernetes.io/mode: Reconcile
    version: v0.3.6
spec:
  selector:
    matchLabels:
      k8s-app: metrics-server
      version: v0.3.6
  template:
    metadata:
      name: metrics-server
      labels:
        k8s-app: metrics-server
        version: v0.3.6
      annotations:
        scheduler.alpha.kubernetes.io/critical-pod: ''
        seccomp.security.alpha.kubernetes.io/pod: 'docker/default'
    spec:
      priorityClassName: system-cluster-critical
      serviceAccountName: metrics-server
      containers:
      - name: metrics-server
        image: k8s.gcr.io/metrics-server-amd64:v0.3.6
        command:
        - /metrics-server
        - --metric-resolution=30s
        - --kubelet-preferred-address-types=InternalIP
        - --kubelet-insecure-tls
        ports:
        - containerPort: 443
          name: https
          protocol: TCP
      - name: metrics-server-nanny
        image: k8s.gcr.io/addon-resizer:1.8.4
        resources:
          limits:
            cpu: 100m
            memory: 300Mi
          requests:
            cpu: 5m
            memory: 50Mi
        env:
          - name: MY_POD_NAME
            valueFrom:
              fieldRef:
                fieldPath: metadata.name
          - name: MY_POD_NAMESPACE
            valueFrom:
              fieldRef:
                fieldPath: metadata.namespace
        volumeMounts:
        - name: metrics-server-config-volume
          mountPath: /etc/config
        command:
          - /pod_nanny
          - --config-dir=/etc/config
          - --cpu=300m
          - --extra-cpu=20m
          - --memory=200Mi
          - --extra-memory=10Mi
          - --threshold=5
          - --deployment=metrics-server
          - --container=metrics-server
          - --poll-period=300000
          - --estimator=exponential
          - --minClusterSize=2
      volumes:
        - name: metrics-server-config-volume
          configMap:
            name: metrics-server-config
      tolerations:
        - key: "CriticalAddonsOnly"
          operator: "Exists"
        - key: node-role.kubernetes.io/master
          effect: NoSchedule
---
apiVersion: v1
kind: Service
metadata:
  name: metrics-server
  namespace: kube-system
  labels:
    addonmanager.kubernetes.io/mode: Reconcile
    kubernetes.io/cluster-service: "true"
    kubernetes.io/name: "Metrics-server"
spec:
  selector:
    k8s-app: metrics-server
  ports:
  - port: 443
    protocol: TCP
    targetPort: https
---
apiVersion: apiregistration.k8s.io/v1beta1
kind: APIService
metadata:
  name: v1beta1.metrics.k8s.io
  labels:
    kubernetes.io/cluster-service: "true"
    addonmanager.kubernetes.io/mode: Reconcile
spec:
  service:
    name: metrics-server
    namespace: kube-system
  group: metrics.k8s.io
  version: v1beta1
  insecureSkipTLSVerify: true
  groupPriorityMinimum: 100
  versionPriority: 100
kubectl apply -f metrics.yaml
3) Verify whether metrics-server is successfully deployed
kubectl get pods -n kube-system
The following running status is displayed indicating successful startup
4) Test the kubectl top command
After the metrics-server component is successfully installed, you can use the kubectl top command
kubectl top nodes
The display is as follows:
NAME          CPU(cores)    CPU%     MEMORY(bytes)   MEMORY%
k8s-master     660m          16%      1608Mi          20%
k8s-node       348m          8%       1046Mi          28%
kubectl top pods -n kube-system is
displayed as follows:
NAME                                 CPU(cores)   MEMORY(bytes)
calico-node-9wkmr                    100m         26Mi
calico-node-sp5m6                    162m         35Mi
coredns-6955765f44-j2xrl             8m           8Mi
coredns-6955765f44-th2sb             10m          8Mi
etcd-k8s-master                      48m          44Mi
kube-apiserver-k8s-master            128m         286Mi
kube-controller-manager-k8s-master   79m         38Mi
kube-proxy-9s48h                     2m           17Mi
kube-proxy-vcx2s                     2m           10Mi
kube-scheduler-k8s-master            12m          15Mi
metrics-server-5cf9669fbf-jmrdx       3m           17Mi
Three, HPA API objects
There are three versions of the HPA API, which can be seen through kubectl api-versions | grep autoscal
autoscaling/v1
autoscaling/v2beta1
autoscaling/v2beta2
autoscaling/v1只支持基于CPU指标的缩放;

autoscaling/v2beta1支持Resource Metrics(资源指标,如pod的CPU)和Custom Metrics(自定义指标)的缩放;

autoscaling/v2beta2支持Resource Metrics(资源指标,如pod的CPU)和Custom Metrics(自定义指标)和ExternalMetrics(额外指标)的缩放。
Four, use kubectl to operate HPA
Similar to other API resources, kubectl also supports Pod automatic scaling. We can use the kubectl create command to create an auto-scalable object, use the kubectl get hpa command to obtain all auto-scalable objects, and use the kubectl describe hpa command to view the details of the auto-scalable object. Finally, you can use the kubectl delete hpa command to delete the object. In addition, there is a simple command kubectl autoscale to create automatic scaling objects. For example, the command kubectl autoscale rs foo --min = 2 --max = 5 --cpu-percent = 80 will create an auto-scalable object for the replication set named foo, the target target's CPU usage is 80%, copy The number is configured between 2 and 5.
Five, multiple indicators support
Support for scaling based on multiple metrics in Kubernetes1.6 +. You can use the autoscaling / v2beta2 API to specify multiple indicators for HPA. HPA will calculate according to each indicator and generate a scaling suggestion.
Six, custom indicator support
Since Kubernetes 1.6, HPA supports the use of custom indicators. You can use the autoscaling / v2beta2 API to specify user-defined indicators for HPA. Kubernetes will obtain the corresponding indicators through the user-defined indicator API.
Seven, test HPA's autoscaling / v1 version-CPU-based automatic expansion and contraction
Create a php-apache service with Deployment, and then use HPA to automatically expand and shrink. Proceed as follows:
1. Create a pod through deployment and operate on the master node of k8s
1) Create and run a php-apache service
Use dockerfile to build a new image, build on the master node of k8s
cat dockerfile
FROM php:5-apache
ADD index.php /var/www/html/index.php
RUN chmod a+rx index.php
cat index.php
<?php
  $x = 0.0001;
  for ($i = 0; $i <= 1000000;$i++) {
    $x += sqrt($x);
  }
  echo "OK!";
?>
docker build -t k8s.gcr.io/hpa-example:v1 .
2) Package mirror
docker save -o hpa-example.tar.gz k8s.gcr.io/hpa-example:v1
3) Unzip the image
You can transfer the image to each node of k8s, and decompress it with docker load-i hpa-example.tar.gz
4) Deploy a php-apache service through deployment
cat php-apache.yaml
apiVersion:apps/v1
kind:Deployment
metadata:
  name:php-apache
spec:
  selector:
    matchLabels:
      run:php-apache
  replicas:1
  template:
    metadata:
      labels:
        run:php-apache
    spec:
      containers:
      -name:php-apache
        image:k8s.gcr.io/hpa-example:v1
        ports:
        -containerPort:80
        resources:
          limits:
            cpu:500m
          requests:
            cpu:200m

---

apiVersion: v1
kind:Service
metadata:
  name:php-apache
  labels:
    run:php-apache
spec:
  ports:
  -port:80
  selector:
    run:php-apache
kubectl apply -f php-apache.yaml
5) Verify that PHP is successfully deployed
kubectl get pods
The following is displayed, indicating that the php service is successfully deployed
NAME                          READY   STATUS   RESTARTS   AGE
php-apache-5694767d56-mmr88   1/1    Running   0          66s
2. Create HPA
The php-apache service is running. Use kubectl autoscale to create an automatic scaler to automatically expand and shrink the pod created by the deployment of php-apache. The following command will create an HPA. The HPA will increase based on CPU, memory and other resource indicators. Or reduce the number of copies and create an hpa that can achieve the following purposes:
1)让副本数维持在1-10个之间(这里副本数指的是通过deployment部署的pod的副本数)
2)将所有Pod的平均CPU使用率维持在50%(通过kubectlrun运行的每个pod如果是200毫核,这意味着平均CPU利用率为100毫核
1) Create HPA for the deployment above php-apache
kubectl autoscale deployment php-apache --cpu-percent=50 --min=1 --max=10Explanation of the above command
kubectl autoscale deployment php-apache (php-apache表示deployment的名字) --cpu-percent=50(表示cpu使用率不超过50%) --min=1(最少一个pod)
--max=10(最多10个pod)
2) Verify that the HPA was created successfully
kubectl get hpa
The display shows that the creation was successful: 
Note: Since we have not sent any requests to the server, the current CPU consumption is 0% (the TARGET column shows the average of all Pods controlled by the corresponding deployment).
3. Pressure test php-apache service, just do pressure test for CPU
Start a container and send an infinite query loop to the php-apache service (copy the terminal of the k8s master node, that is, open a new terminal window):
kubectl run v1 -it --image=busybox /bin/shAfter logging into the container, execute the following command
while true; do wget -q -O- http://php-apache.default.svc.cluster.local; doneWithin a minute or so, we see higher CPU load by executing the following command
kubectl get hpa
The display is as follows: As 
you can see above, the CPU consumption has reached 256%, and the target CPU usage of each pod is 50%
, so the number of pod copies created by the deployment of php-apache will be adjusted to 5 copies, why is it 5 A copy, because
256/50 = 5 kubectl get pod
shows as follows:
NAME                          READY   STATUS    RESTARTS   AGE
php-apache-5694767d56-b2kd7   1/1     Running   0          18s
php-apache-5694767d56-f9vzm   1/1     Running   0          2s
php-apache-5694767d56-hpgb5   1/1     Running   0          18s
php-apache-5694767d56-mmr88   1/1     Running   0          4h13m
php-apache-5694767d56-zljkd   1/1     Running   0          18s
kubectl get deployment php-apache is
shown below:
NAME         READY   UP-TO-DATE   AVAILABLE   AGE
php-apache   5/5     5            5           2h1m
Note : It may take several minutes to stabilize the number of copies. Since the amount of load is not controlled in any way, the final number of copies may differ from this example.
4. Stop the pressure test for php-apache service, HPA will automatically shrink the pod created by php-apache deployment
Stop sending query requests to the php-apache service. In the terminal of the busybox image creation container, use <Ctrl> + C to stop the while request just now. Then, we will verify the status of the result (about one minute later):
kubectl get hpa
shows as follows:
kubectl get deployment php-apache
The display is as follows: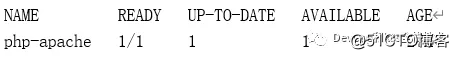
As you can see from the above, the CPU utilization rate drops to 0, so HPA automatically reduces the number of copies to 1.
Note: It may take a few minutes for the copy to scale automatically.
Eight, test HPA autoscaling / v2beta1 version-memory-based automatic expansion and contraction
1. Create a nginx pod
cat nginx.yaml
apiVersion:apps/v1
kind: Deployment
metadata:
  name:nginx-hpa
spec:
  selector:
    matchLabels:
      app: nginx
  replicas: 1
  template:
    metadata:
      labels:
        app: nginx
    spec:
      containers:
      - name: nginx
        image: nginx:1.9.1
        ports:
        - containerPort: 80
          name: http
          protocol: TCP
        resources:
          requests:
            cpu: 0.01
            memory: 25Mi
          limits:
            cpu: 0.05
            memory: 60Mi
---
apiVersion: v1
kind: Service
metadata:
  name: nginx
  labels:
    app: nginx
spec:
  selector:
    app: nginx
  type: NodePort
  ports:
  - name: http
    protocol: TCP
    port: 80
    targetPort: 80
    nodePort: 30080
kubectl apply -f nginx.yaml
2. Verify that nginx is running
kubectl get pods
The display is as follows, indicating that the nginx pod is running normally:
NAME                       READY  STATUS    RESTARTS   AGE
nginx-hpa-bb598885d-j4kcp 1/1     Running   0         17m
Note: The nginx pod needs the following fields, otherwise hpa will not be able to collect memory indicators
 resources:
    requests:
      cpu: 0.01
      memory: 25Mi
    limits:
       cpu: 0.05
       memory: 60Mi
3. Create an hpa
cat hpa-v1.yaml
apiVersion: autoscaling/v2beta1
kind: HorizontalPodAutoscaler
metadata:
  name: nginx-hpa
spec:
    maxReplicas: 10
    minReplicas: 1
    scaleTargetRef:
      apiVersion:apps/v1
      kind: Deployment
      name: nginx-hpa
    metrics:
    - type: Resource
      resource:
        name: memory
       targetAverageUtilization: 60
kubectl get hpa
shows as follows:
NAME  REFERENCE TARGETS  MINPODS MAXPODS  REPLICAS AGE
nginx-hpa  Deployment/nginx-hpa   5%/60%    1      10  1      20s
4. Press to measure the memory of nginx, hpa will automatically expand and shrink the pod
Log in to the nginx created by pod above, and generate a file to increase memory
kubectl exec -it nginx-hpa-bb598885d-j4kcp -- /bin/shPressure test:
dd if=/dev/zero of=/tmp/aOpen a new terminal:
kubectl get hpaThe display is as follows:
NAME       REFERENCE              TARGETS    MINPODS  MAXPODS   REPLICAS   AGE
nginx-hpa  Deployment/nginx-hpa   200%/60%  1         10        3          12m
The target column above can see 200% / 60%, 200% represents the current CPU usage, 60% represents the CPU usage of all pods maintained at 60%, and now the CPU usage reaches 200%, so the pod is increased to 4
kubectl get deployment
The display is as follows:
NAME         READY   UP-TO-DATE   AVAILABLE   AGE
nginx-hpa    4/4     4            4           25m
kubectl get pods
The display is as follows:
NAME                          READY   STATUS    RESTARTS   AGE
nginx-hpa-bb598885d-j4kcp     1/1     Running   0          25m
nginx-hpa-bb598885d-rj5hk     1/1     Running   0          63s
nginx-hpa-bb598885d-twv9c     1/1     Running   0          18s
nginx-hpa-bb598885d-v9ft5     1/1     Running   0          63s
5. Cancel the pressure test on nginx memory, hpa will automatically shrink the pod
kubectl exec -it nginx-hpa-bb598885d-j4kcp -- /bin/sh
Delete the / tmp / a file
rm -rf /tmp/akubectl get hpa
As shown below, you can see that the memory usage has dropped to 5%:
NAME        REFERENCE              TARGETS   MINPODS   MAXPODS   REPLICAS   AGE
nginx-hpa   Deployment/nginx-hpa   5%/60%    1         10        1          26m
The kubectl get deployment is
shown below, and the deployment pod has returned to one:
NAME         READY   UP-TO-DATE   AVAILABLE   AGE
nginx-hpa    1/1     1            1           38m
Nine, automatic scaling based on multiple indicators and custom indicators
You can use the autoscaling / v2beta2 API version to introduce other metrics used when automatically scaling the deployment of php-apache.
Get yaml file of autoscaling / v2beta2 API version HPA
kubectl get hpa.v2beta2.autoscaling -o yaml> /tmp/hpa-v2.yaml
Open the file /tmp/hpa-v2.yaml in the editor, delete some unneeded fields, you can see the following yaml
apiVersion: autoscaling/v2beta2
kind: HorizontalPodAutoscaler
metadata:
  name: php-apache
  namespace: default
spec:
  scaleTargetRef:
    apiVersion: apps/v1
    kind: Deployment
    name: php-apache
  minReplicas: 1
  maxReplicas: 10
  metrics:
  - type: Resource
    resource:
      name: cpu
      target:
        type: Utilization
        averageUtilization: 50
status:
  observedGeneration: 1
  lastScaleTime: <some-time>
  currentReplicas: 1
  desiredReplicas: 1
  currentMetrics:
  - type: Resource
    resource:
      name: cpu
      current:
        averageUtilization: 0
        averageValue: 0
The targetCPUUtilizationPercentage field is replaced by metrics. The CPU utilization metric is a resource metric because it represents the percentage of the specified resource on the container. In addition to the CPU, you can also specify other resource metrics. By default, the only other resource metric currently supported is memory. As long as the metrics.k8s.io API exists, these resource metrics are available, and they will not change their names in different Kubernetes clusters. You can also specify resource metrics to use absolute values instead of percentages. You need to replace the target type AverageUtilization with AverageValue, and replace target.averageUtilization with target.averageValue and set the corresponding value. There are two other types of metrics, they are considered custom metrics ( custom metrics ): Pod metrics and object metrics. These metrics may have cluster-specific names and require more advanced cluster monitoring settings. The first optional metric type is the Pod metric. These indicators describe Pods from one aspect, average them among different Pods, and determine the number of copies by comparing with a target value. They work very similar to resource metrics, the difference is that they only support the target type AverageValue.
Pod metrics are defined by the following code blocks
type: Pods
pods:
  metric:
    name: packets-per-second
  target:
    type: AverageValue
    averageValue: 1k
The second optional metric type is the object metric. Relative to describing Pods, these metrics are used to describe other objects in the same namespace. Please note that these metrics are used to describe these objects, not from objects. The target types supported by object metrics include Value and AverageValue. If it is of type Value, the target value will be directly compared with the metrics returned by the API, while with AverageValue, the metrics returned by the API will be split according to the number of Pods, and then compared with the target value. The following YAML file shows a metric representing requests-per-second.
type: Object
object:
  metric:
    name: requests-per-second
  describedObject:
    apiVersion: networking.k8s.io/v1beta1
    kind: Ingress
    name: main-route
  target:
    type: Value
    value: 2k
If you specify multiple metrics of the above types, HorizontalPodAutoscaler will consider each of them in turn. HorizontalPodAutoscaler will calculate the number of copies proposed for each indicator, and finally choose a highest value. For example, if your monitoring system can provide network traffic data, you can use the kubectl edit command to change the definition of the above Horizontal Pod Autoscaler to:
apiVersion: autoscaling/v2beta1
kind: HorizontalPodAutoscaler
metadata:
  name: php-apache
  namespace: default
spec:
  scaleTargetRef:
    apiVersion: apps/v1
    kind: Deployment
    name: php-apache
  minReplicas: 1
  maxReplicas: 10
  metrics:
  - type: Resource
    resource:
      name: cpu
      target:
        type: AverageUtilization
        averageUtilization: 50
  - type: Pods
    pods:
      metric:
        name: packets-per-second
      targetAverageValue: 1k
  - type: Object
    object:
      metric:
        name: requests-per-second
      describedObject:
        apiVersion: networking.k8s.io/v1beta1
        kind: Ingress
        name: main-route
      target:
        kind: Value
        value: 10k
status:
  observedGeneration: 1
  lastScaleTime: <some-time>
  currentReplicas: 1
  desiredReplicas: 1
  currentMetrics:
  - type: Resource
    resource:
      name: cpu
    current:
      averageUtilization: 0
      averageValue: 0
  - type: Object
    object:
      metric:
        name: requests-per-second
      describedObject:
        apiVersion: networking.k8s.io/v1beta1
        kind: Ingress
        name: main-route
      current:
        value: 10k
Then, your HorizontalPodAutoscaler will try to ensure that the CPU utilization of each Pod is within 50%, can service 1000 packet requests per second, and ensure that all Pods after Ingress can serve a total of 10,000 requests per second.
Ten, automatic scaling under more specified indicators
Many measurement pipelines allow you to describe measurement metrics by name or attached _labels_. For all non-resource type metrics (pod, object, and external that will be described later), an additional tag selector can be specified. For example, if you want to collect http_requests metrics that include verb tags, you can specify the required metrics in the GET request as follows:
type:Object
object:
  metric:
    name:`http_requests`
    selector:`verb=GET`
This selector uses the same syntax as the Kubernetes tag selector. If the name and tag selector match multiple series, the monitoring pipeline will determine how to combine multiple series into a single value. The selector is additional, it does not select objects other than targets (targets of type Pods and targets of type Object).
11. Automatic scaling based on metrics other than kubernetes objects
Applications running on Kubernetes may need to automatically scale based on metrics that have no obvious relationship to any objects in the Kubernetes cluster, such as those that describe services that are not in any namespaces of Kubernetes. To use external metrics, you need to understand the monitoring system you are using. Related settings are similar to using custom metrics. External metrics can use any metrics of your monitoring system to automatically scale your cluster. You only need to provide the name and selector in the metric block and change the type from Object to External. If metricSelector matches multiple metrics, HorizontalPodAutoscaler will sum them. External metrics support both Value and AverageValue types, which are the same as the Object type metrics. For example, if your application processes the message queue on the host, in order to have one worker for every 30 tasks, you can add the following to the configuration of HorizontalPodAutoscaler.
-type: External
external:
metric:
name: queue_messages_ready
selector: "queue = worker_tasks"
target:
type: AverageValue
averageValue: 30
still recommends custom metric instead of external metrics, because it makes it easy for system administrators to harden the custom metrics API. The external metrics API allows access to all metrics. When exposing these services, system administrators need to carefully consider this issue.
If you want to know more about kubernetes, microservices, DevOps and production cases, get free videos, you can get it as follows ~~~
WeChat: luckylucky421302