Recently, such a problem has occurred in the project. There are 5 virtual machines running the same microservices, each machine is mounted with 8-9 services, one of them is hung up without knowing why, it is not the service , The machine hangs, the shell can't connect.
The initial diagnostic idea considers whether a service on this machine has burst memory, so I started to troubleshoot memory problems and used jdk's own script to perform memory diagnostic analysis.

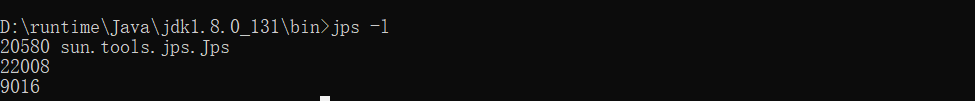
1. View the processes occupied by all Java applications (Linux commonly used ps -ef | grep java)
jps -l
2. Check the need to monitor the process of garbage collection, memory usage, here mainly to see if there is full gc
jstat -gcutil 20954 1000

3. Check the survival of the corresponding map of the memory. Here we mainly check whether the corresponding java process has large objects. If there are large objects, it means that the memory has been occupied and has not been released.
jmap -histo:live 20954 | head -10

4. Generate a dump file snapshot, export and generate heap.hprof, use the memory diagnostic tool MemoryAnalyzer to import the dump file to see where the analysis is OOM, and locate the specific code
jmap -dump:live,format=b,file=heap.hprof 20954

PS: After finding the process corresponding to java, you can also find out which thread occupies the memory exception, and you can also check it according to this method.
First you have to install the pslist command tool on windows. The
first step: enter https://technet.microsoft.com/zh-cn/sysinternals/dd443648 tool compression package to download the
second step: after decompression, copy pslist.exe to C: \ Windows \ System32 directory The
third step: enter pslist in the dos window, a prompt window will pop up prompting to agree and install. After installation, it will enumerate all the process lists
1. View the threads corresponding to the process
pslist -dmx 20954
2. Then analyze the stack file of the exported thread
jstatck 10238 > 1.statck
