1.JHSDB Profile
JHSDB is a service agency based outside the implementation process debugging tools. HotSpot service agent is the virtual machine used to map a set of Java virtual machine operational information, mainly based on a set of API Java language.
2.JHSDB start
2.1 Starting Sample Code
package com.ryj.hotspot;

import java.io.IOException;

import org.omg.CORBA.ObjectHolder;

public class JHSDB_Test {
    static class Test {
        static ObjectHolder staticObj = new ObjectHolder();
        ObjectHolder instanceObj = new ObjectHolder();

        void foo() {
            ObjectHolder localObject = new ObjectHolder();
            while (true) {
                try {
                    Thread.sleep(6000 * 1000l);
                } catch (InterruptedException e) {
                    // TODO Auto-generated catch block
                    e.printStackTrace();
                }
            }
        }
    }

    public static void main(String[] args) {
        Test test = new JHSDB_Test.Test();
        test.foo();
    }
}
2.2 find the java process ID
C:\Program Files\Java\jdk1.8.0_144\bin>jps -l
8400
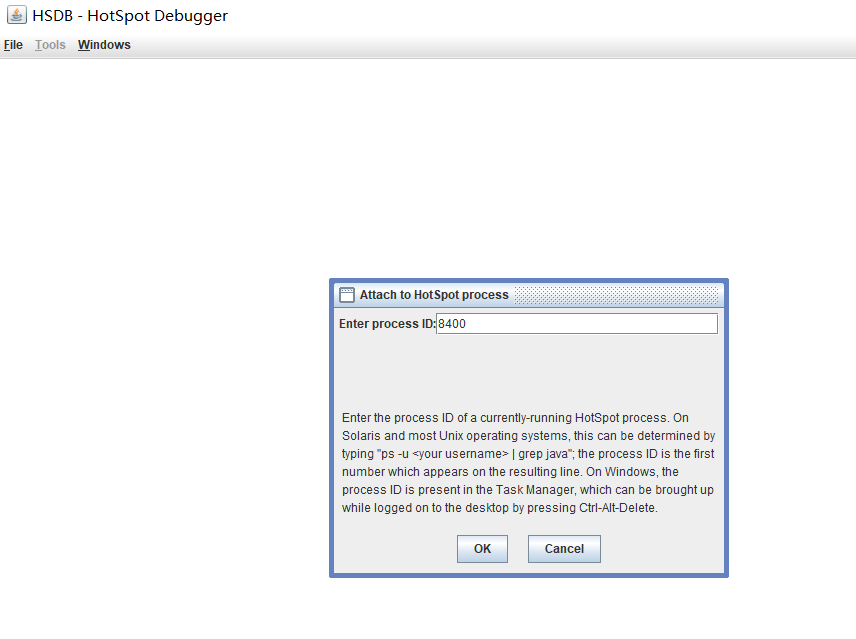
2.3 Starting JHSDB
C:\Program Files\Java\jdk1.8.0_144\lib>java -cp .\sa-jdi.jar sun.jvm.hotspot.HSDB
If the error message appears, you need to move a file to a lack of the lib directory

2.4 input process number in the window that opens

- Inspector: View and Klass OOP object information, double-click the name of the thread can also view this information
- Stack Memory: thread stack memory
- Show Java Stack Traces: display thread stack information
- Show Thread Infomation: display thread information
- Find Crashes
3.JHSDB combat
3.1 Viewing heap information
Via Tools - View or by Windows> Heap Parameters -> Console command execution
hsdb> universe
Heap Parameters:
ParallelScavengeHeap [ PSYoungGen [ eden =  [0x00000000d5d80000,0x00000000d5f73368,0x00000000d7e00000] , from =  [0x00000000d8300000,0x00000000d8300000,0x00000000d8800000] , to =  [0x00000000d7e00000,0x00000000d7e00000,0x00000000d8300000]  ] PSOldGen [  [0x0000000081800000,0x0000000081800000,0x0000000086d80000]  ]  ]
3.2 look objects memory address
hsdb> scanoops 0x00000000d5d80000 0x00000000d8800000 com.ryj.hotspot.JHSDB_Test$ObjectHolder
Because the local environment scanoops given command, subsequent reference https://www.bilibili.com/video/av95220376/