文章目录
前提,已经安装好 Grafana;因为接下来会使用到它搭建监控大屏;如何安装Grafana请看我另一篇文章:
超详细!手把手教你 搭建 Jmeter + Influxdb + Grafana 性能监控大屏
安装promethenus
下载promethenus
官网地址:prometheus下载地址
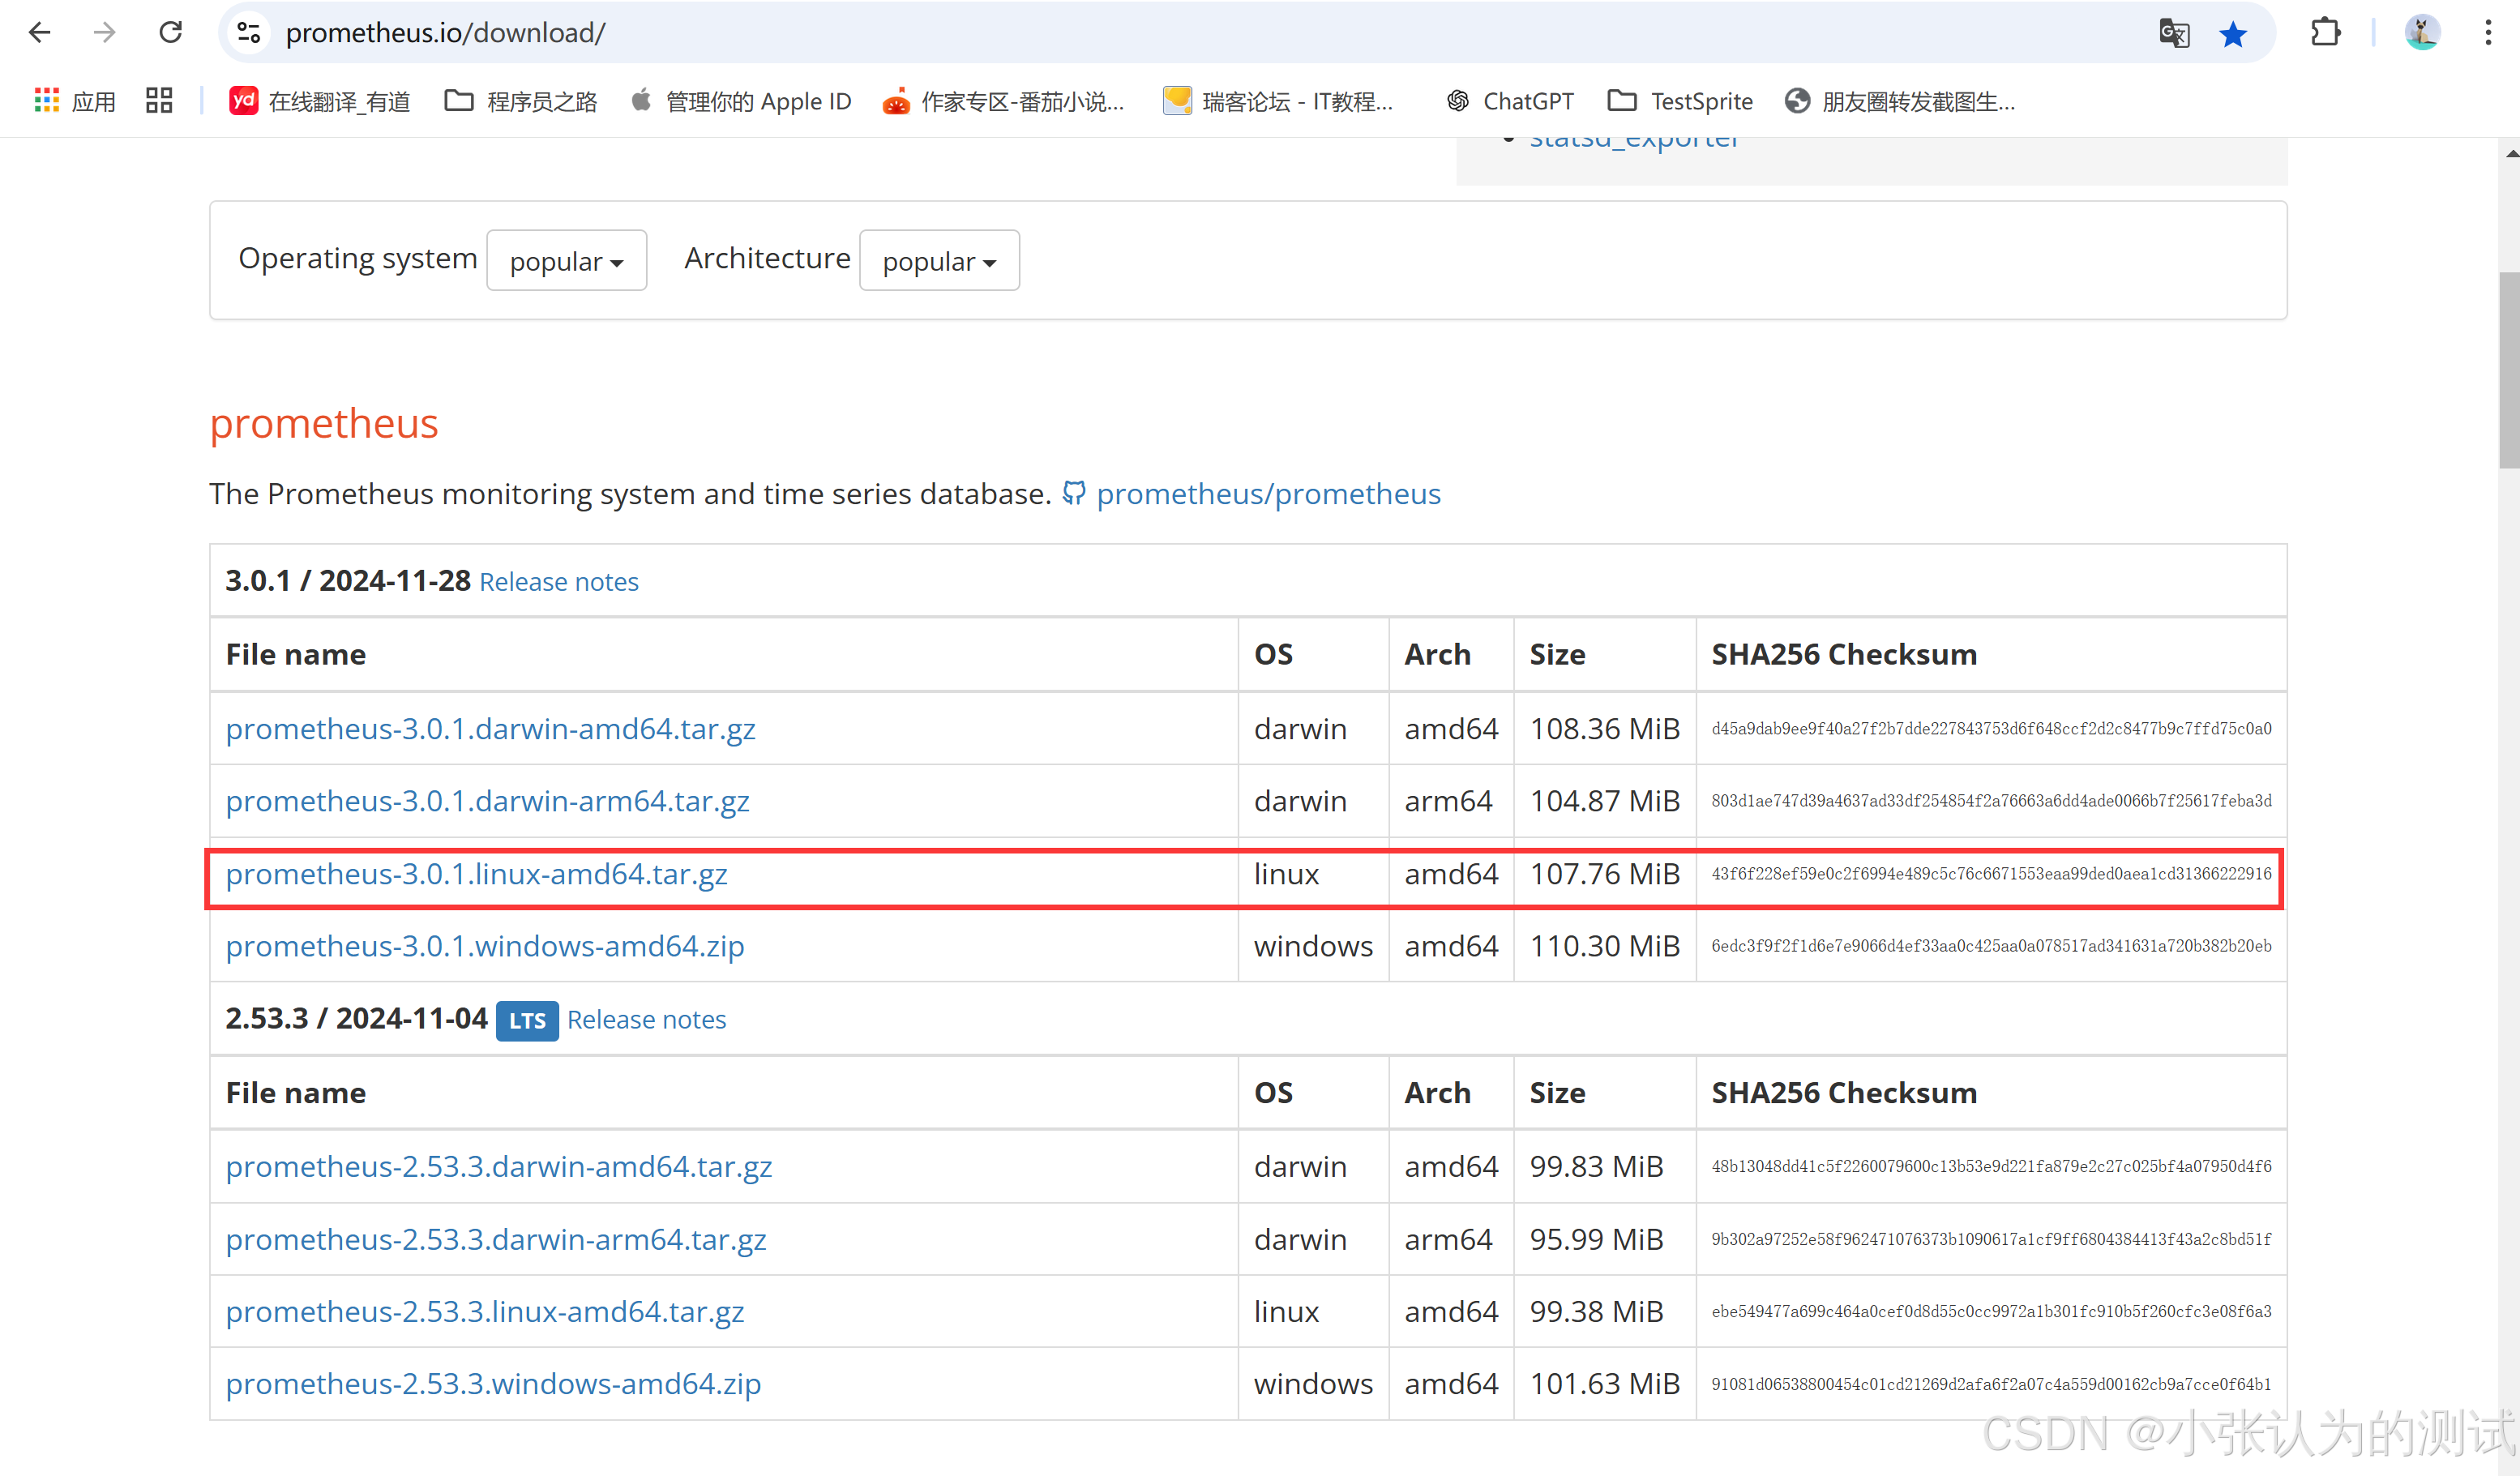
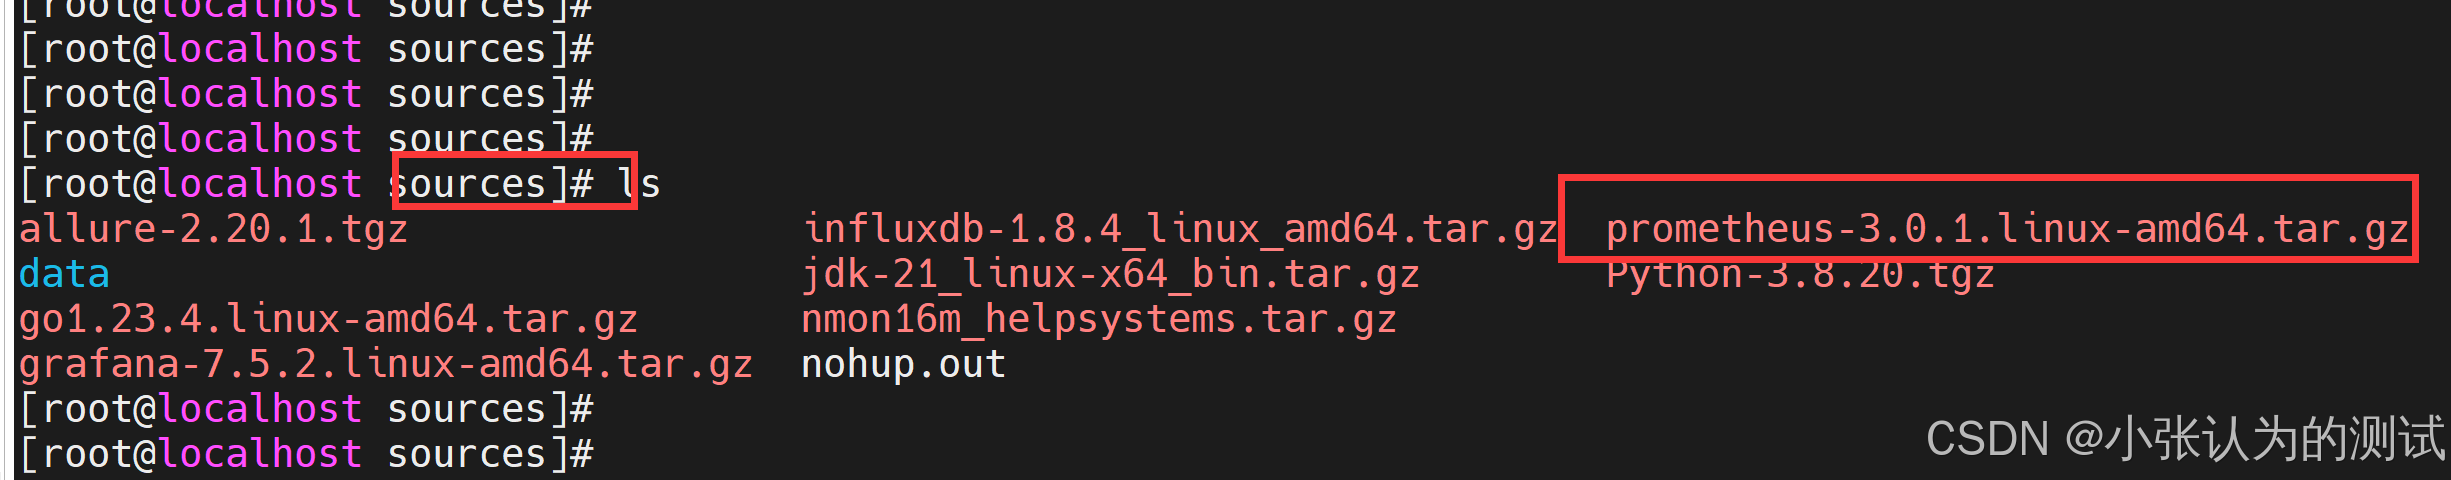
将下载好的 压缩包上传到你的虚拟机上
我在虚拟机根目录下面创建了一个sources目录,用于存放各种资源
解压promethenus
在 /usr/local 目录下创建文件夹 promethenus
mkdir /usr/local/promethenus
切换到 sources目录下
cd /sources/
将此目录下的 promethenus 压缩包解压到我们刚创建的 /usr/local/promethenus 文件夹下面
tar -zxvf prometheus-3.0.1.linux-amd64.tar.gz -C /usr/local/promethenus
配置环境变量
创建软链接
ln -s /usr/local/prometheus/prometheus/ /usr/bin/prometheus/
打开系统变量文件
vi /etc/profile
添加环境变量
export PATH=/usr/bin/prometheus:$PATH
注册环境变量
source /etc/profile
此时安装prometheus完成
安装locust-exporter
如果你想在windows电脑上运行你本地的locust代码,然后你希望在你的 grafana上展示你的压测大屏,并且你使用的是prometheus,那么你就需要安装locust-exporter
为了将Locust的性能指标发送到Prometheus,您需要使用Prometheus的locust-exporter,这是一个用来从Locust收集指标并将其暴露给Prometheus的工具
下载locust-exporter
github:locust-exporter下载地址
你需要将你下载下来的仓库地址,压缩,上传到你的虚拟机上
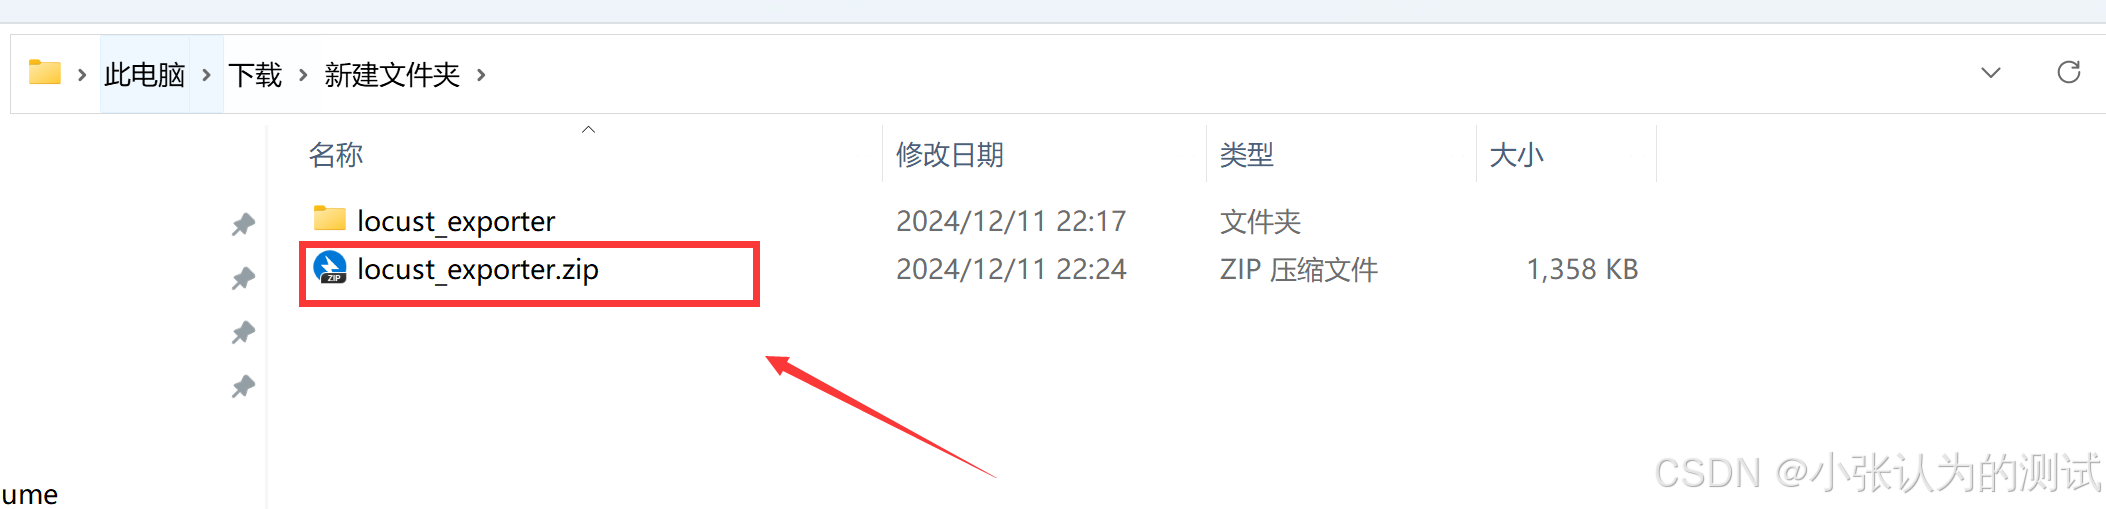
我在/usr/local/ 文件夹下面创建了一个 locust_export 用于存放我上传的压缩包
mkdir /usr/local/locust_export
解压 locust-exporter
因为是 zip格式的,在解压之前你可能需要下载 unzip 工具
sudo apt update
sudo apt install zip unzip -y
然后进行解压
进入 locust-exporter 目录下
cd /usr/local/locust_export
解压
unzip locust_exporter.zip
编译 locust_exporter
在编译时候,你需要使用go语言进行编译,因此,你需要下载go语言在你的虚拟机上
下载go语言
官网链接:go语言下载地址
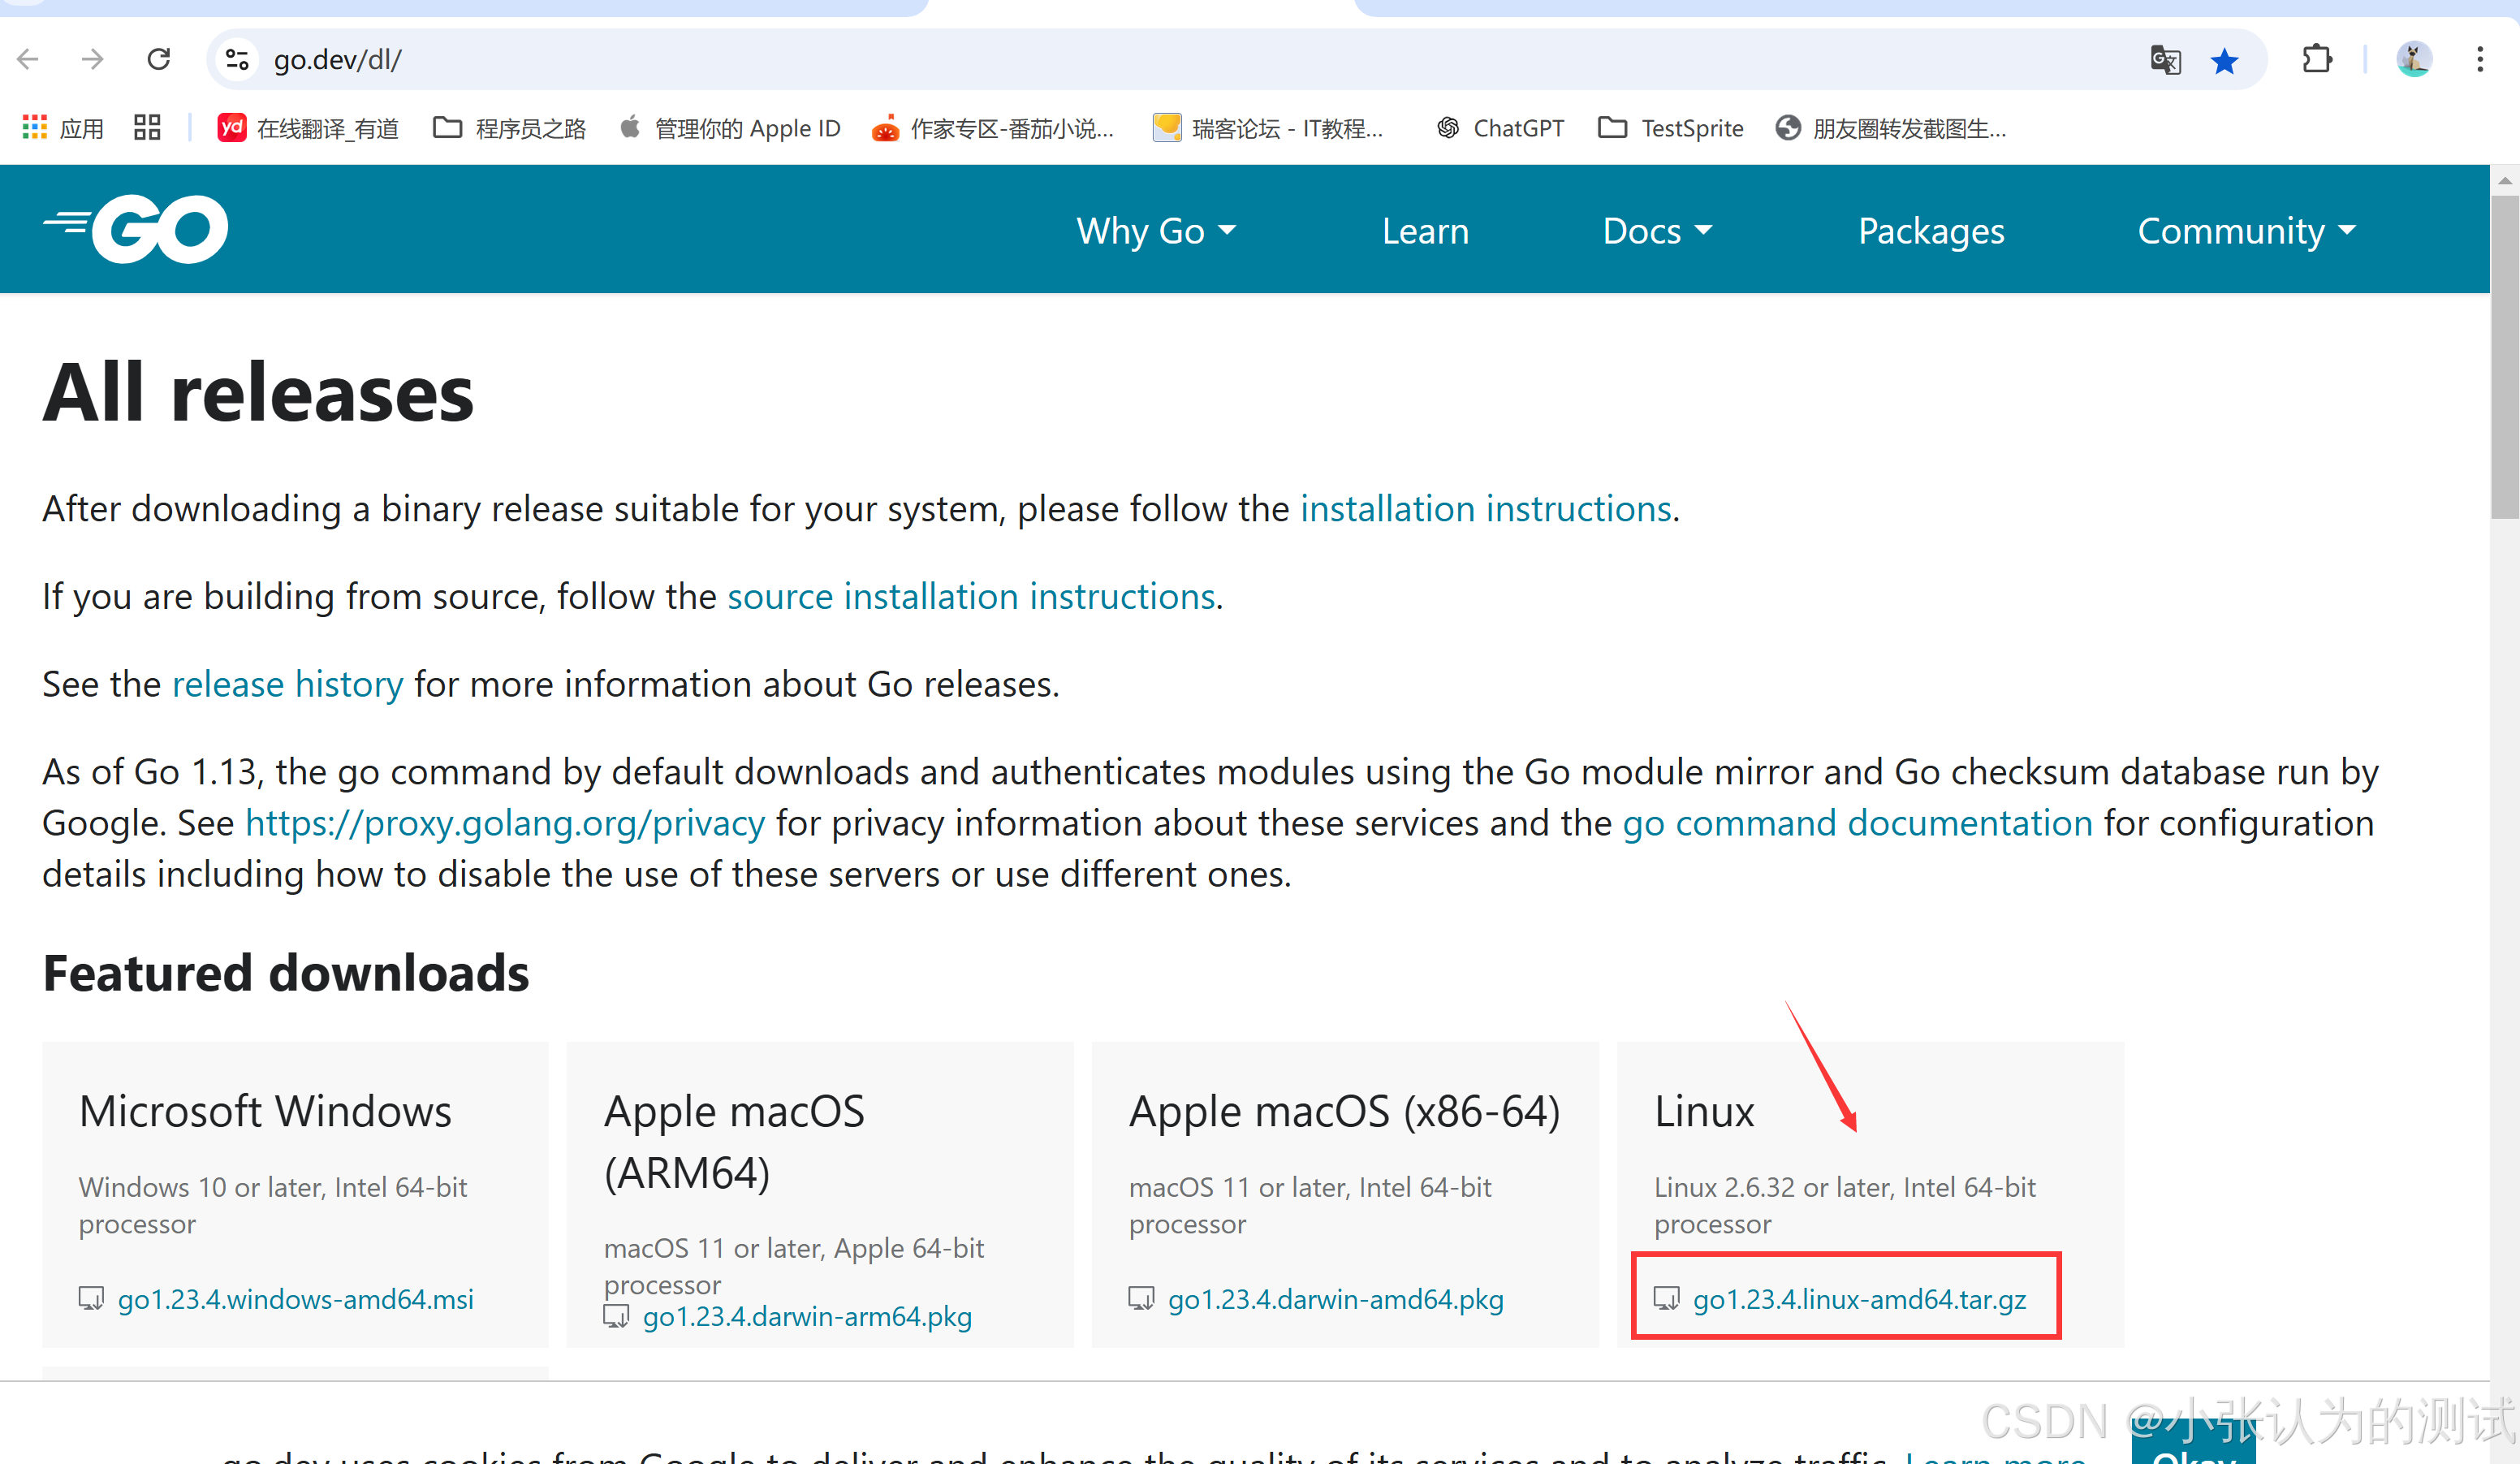
将下载好的go压缩包上传到你的虚拟机上
创建 go语言存放位置:
mkdir /usr/local/go
解压go语言
我的go压缩包上传位置是在 根目录 /sources 目录下的,下面进行解压
tar -zxvf /sources/go1.23.4.linux-amd64.tar.gz -C /usr/local/go
配置 Go 环境变量: 将 Go 的安装路径添加到您的系统环境变量中:
echo "export PATH=$PATH:/usr/local/go/go/bin" >> ~/.bashrc
source ~/.bashrc
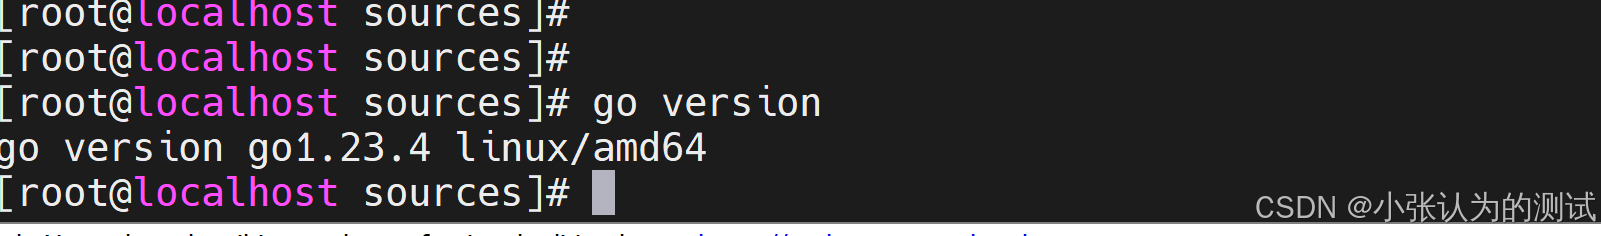
验证go是否已经安装成功
go version
设置go代理
将 Go 的模块代理设置为国内的代理服务,比如 goproxy.cn。
go env -w GO111MODULE=on
go env -w GOPROXY=https://goproxy.cn,direct
这样一会在构建 locust-exporter的时候,不至于出现错误
构建locust-exporter
进入 locust_exporter 目录下
cd /usr/local/locust_exporter
构建locust-exporter
go build -o locust_exporter .
注意的点是:
确保宿主机的防火墙允许虚拟机访问 Locust 服务的端口(通常是 8089)。
如果你的防火墙未关闭,那么需要暴露你的防火墙端口 8089
# 永久暴露端口(重启后依然有效)
sudo firewall-cmd --add-port=<PORT>/tcp --permanent
# 重新加载防火墙规则以生效
sudo firewall-cmd --reload
检查暴露的所有端口
sudo firewall-cmd --list-ports
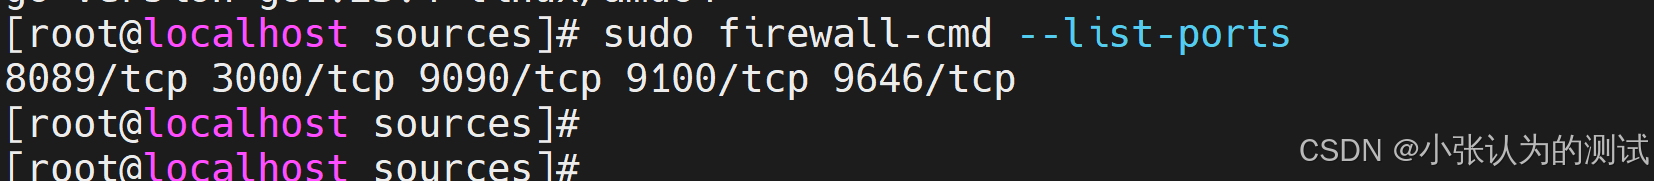
注意:如果你像我一样没有关闭虚拟机的防火墙,那么你需要暴露 grafana 的端口 3000, prometheus的端口9090等
如何使用
locust-export使用
首先启动 locust-exporter 然后,查看你的windows本地ip地址
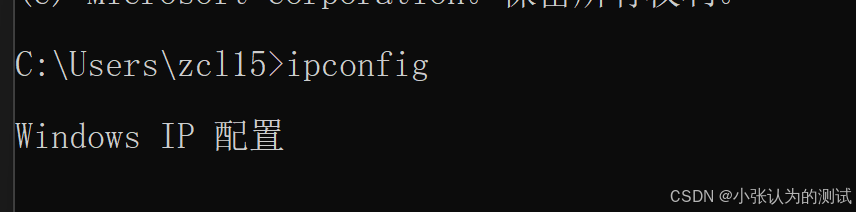
看无线局域网那一栏

切换到目录 locust-exporter 下面执行命令
查看帮助文档
./locust-exporter --help
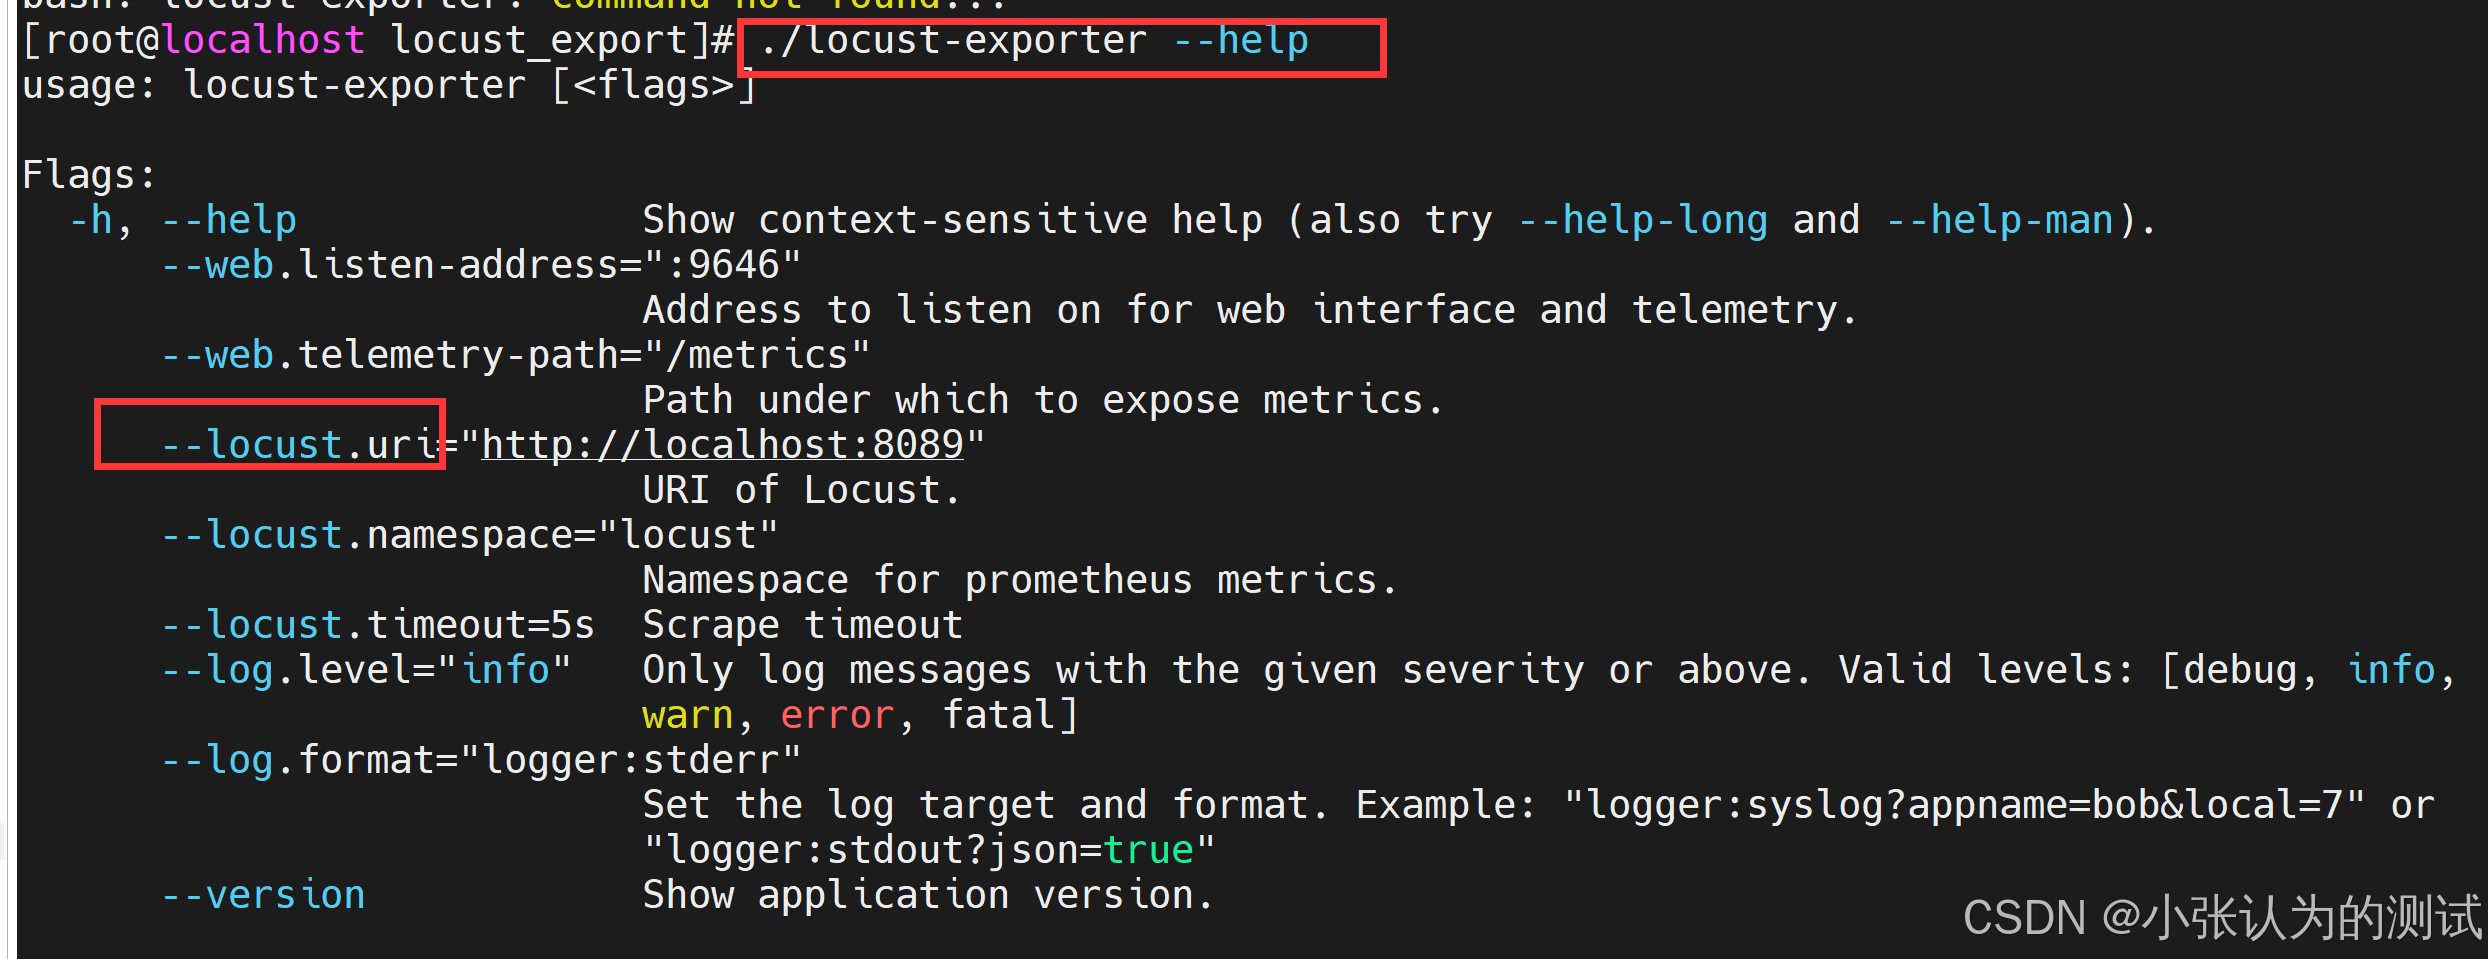
输入以下命令
./locust-exporter --locust.uri=http://<windows-host>:8089
# windows-host 是你windows本地的 ipv4地址
# 例如:./locust-exporter -locust.uri=http://192.168.123.123:8089
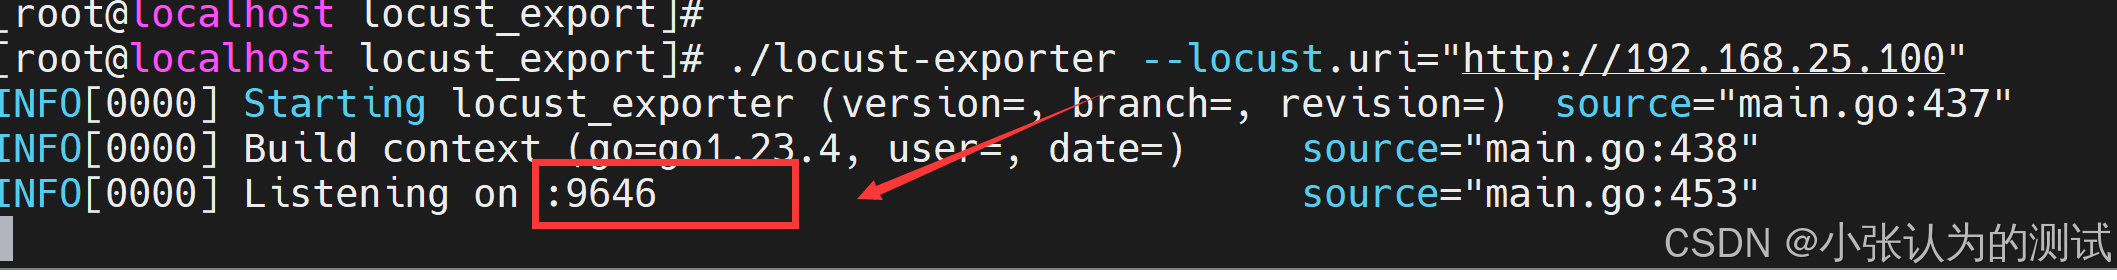
我们看到它采集的端口是 9646 如果你没关闭防火墙(默认开启) 那么要暴露这个9646端口
暴露9646端口
# 永久暴露端口(重启后依然有效)
sudo firewall-cmd --add-port=9646/tcp --permanent
# 重新加载防火墙规则以生效
sudo firewall-cmd --reload
我们可以看一下它默认采集数据的地址:你的虚拟机ip+9646+/metrics
例如:http://192.168.40.128:9646/metrics
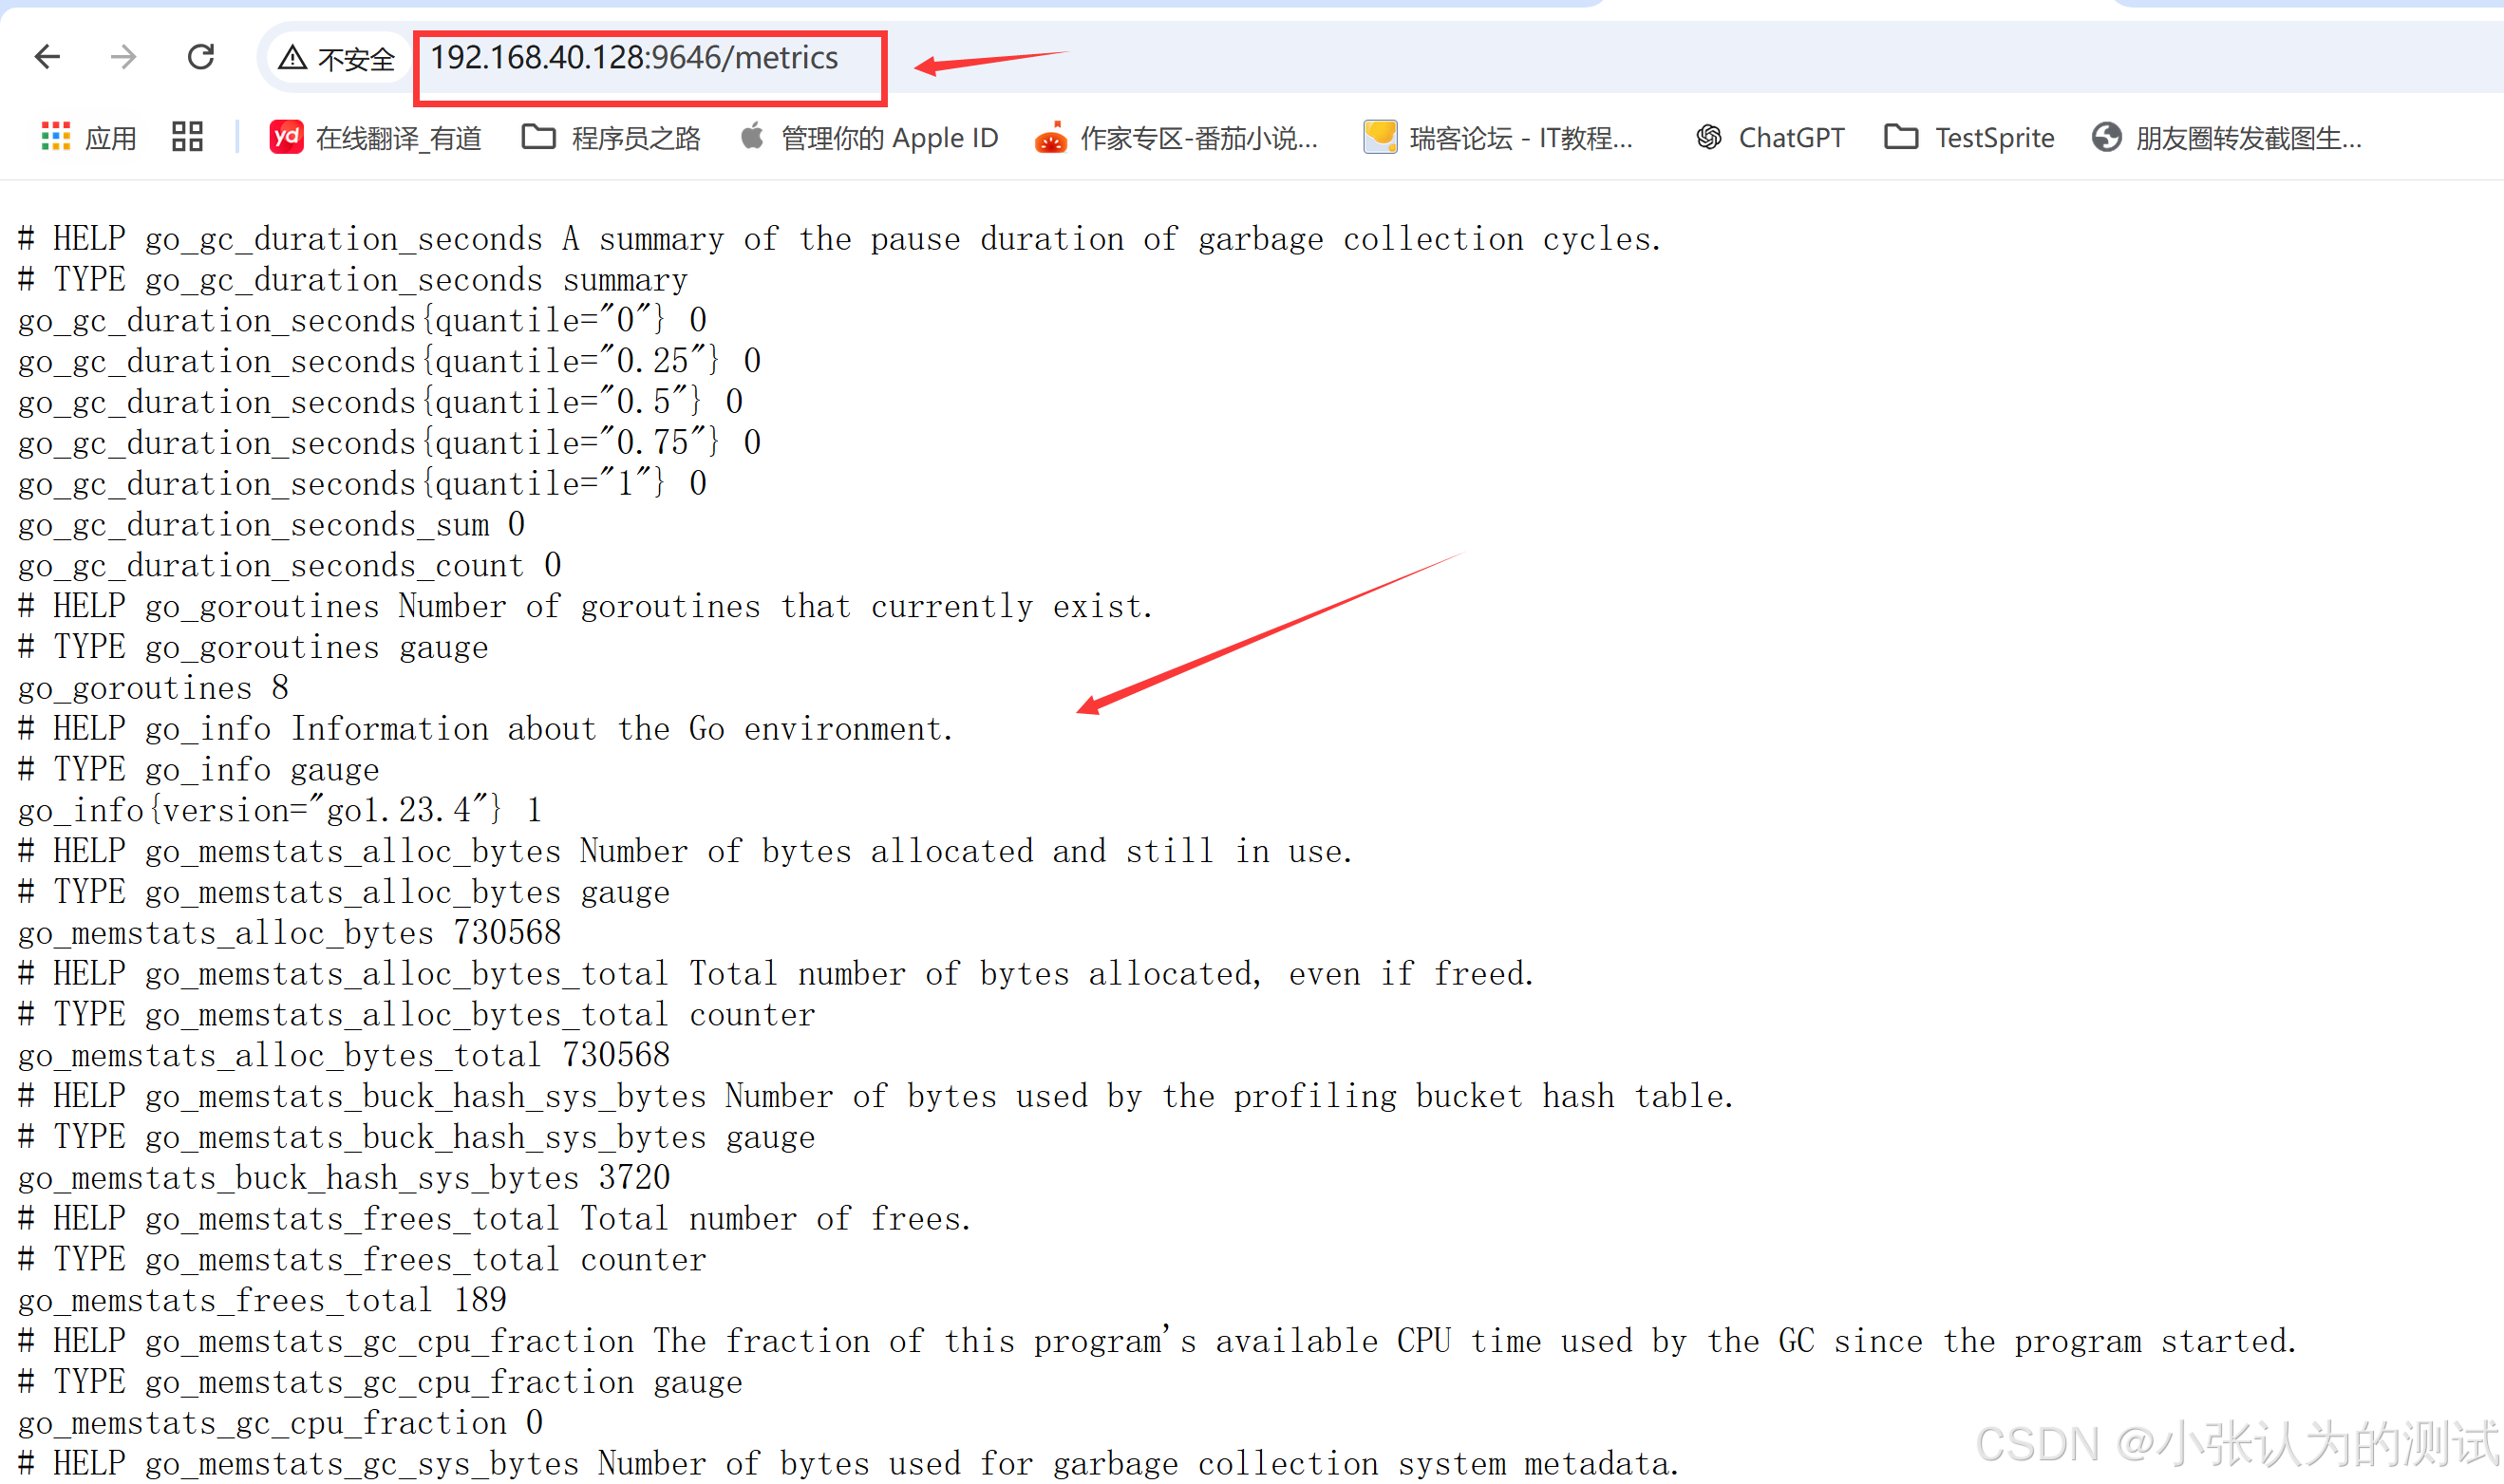
出现这个就证明你的locust-exporter是正确运行的
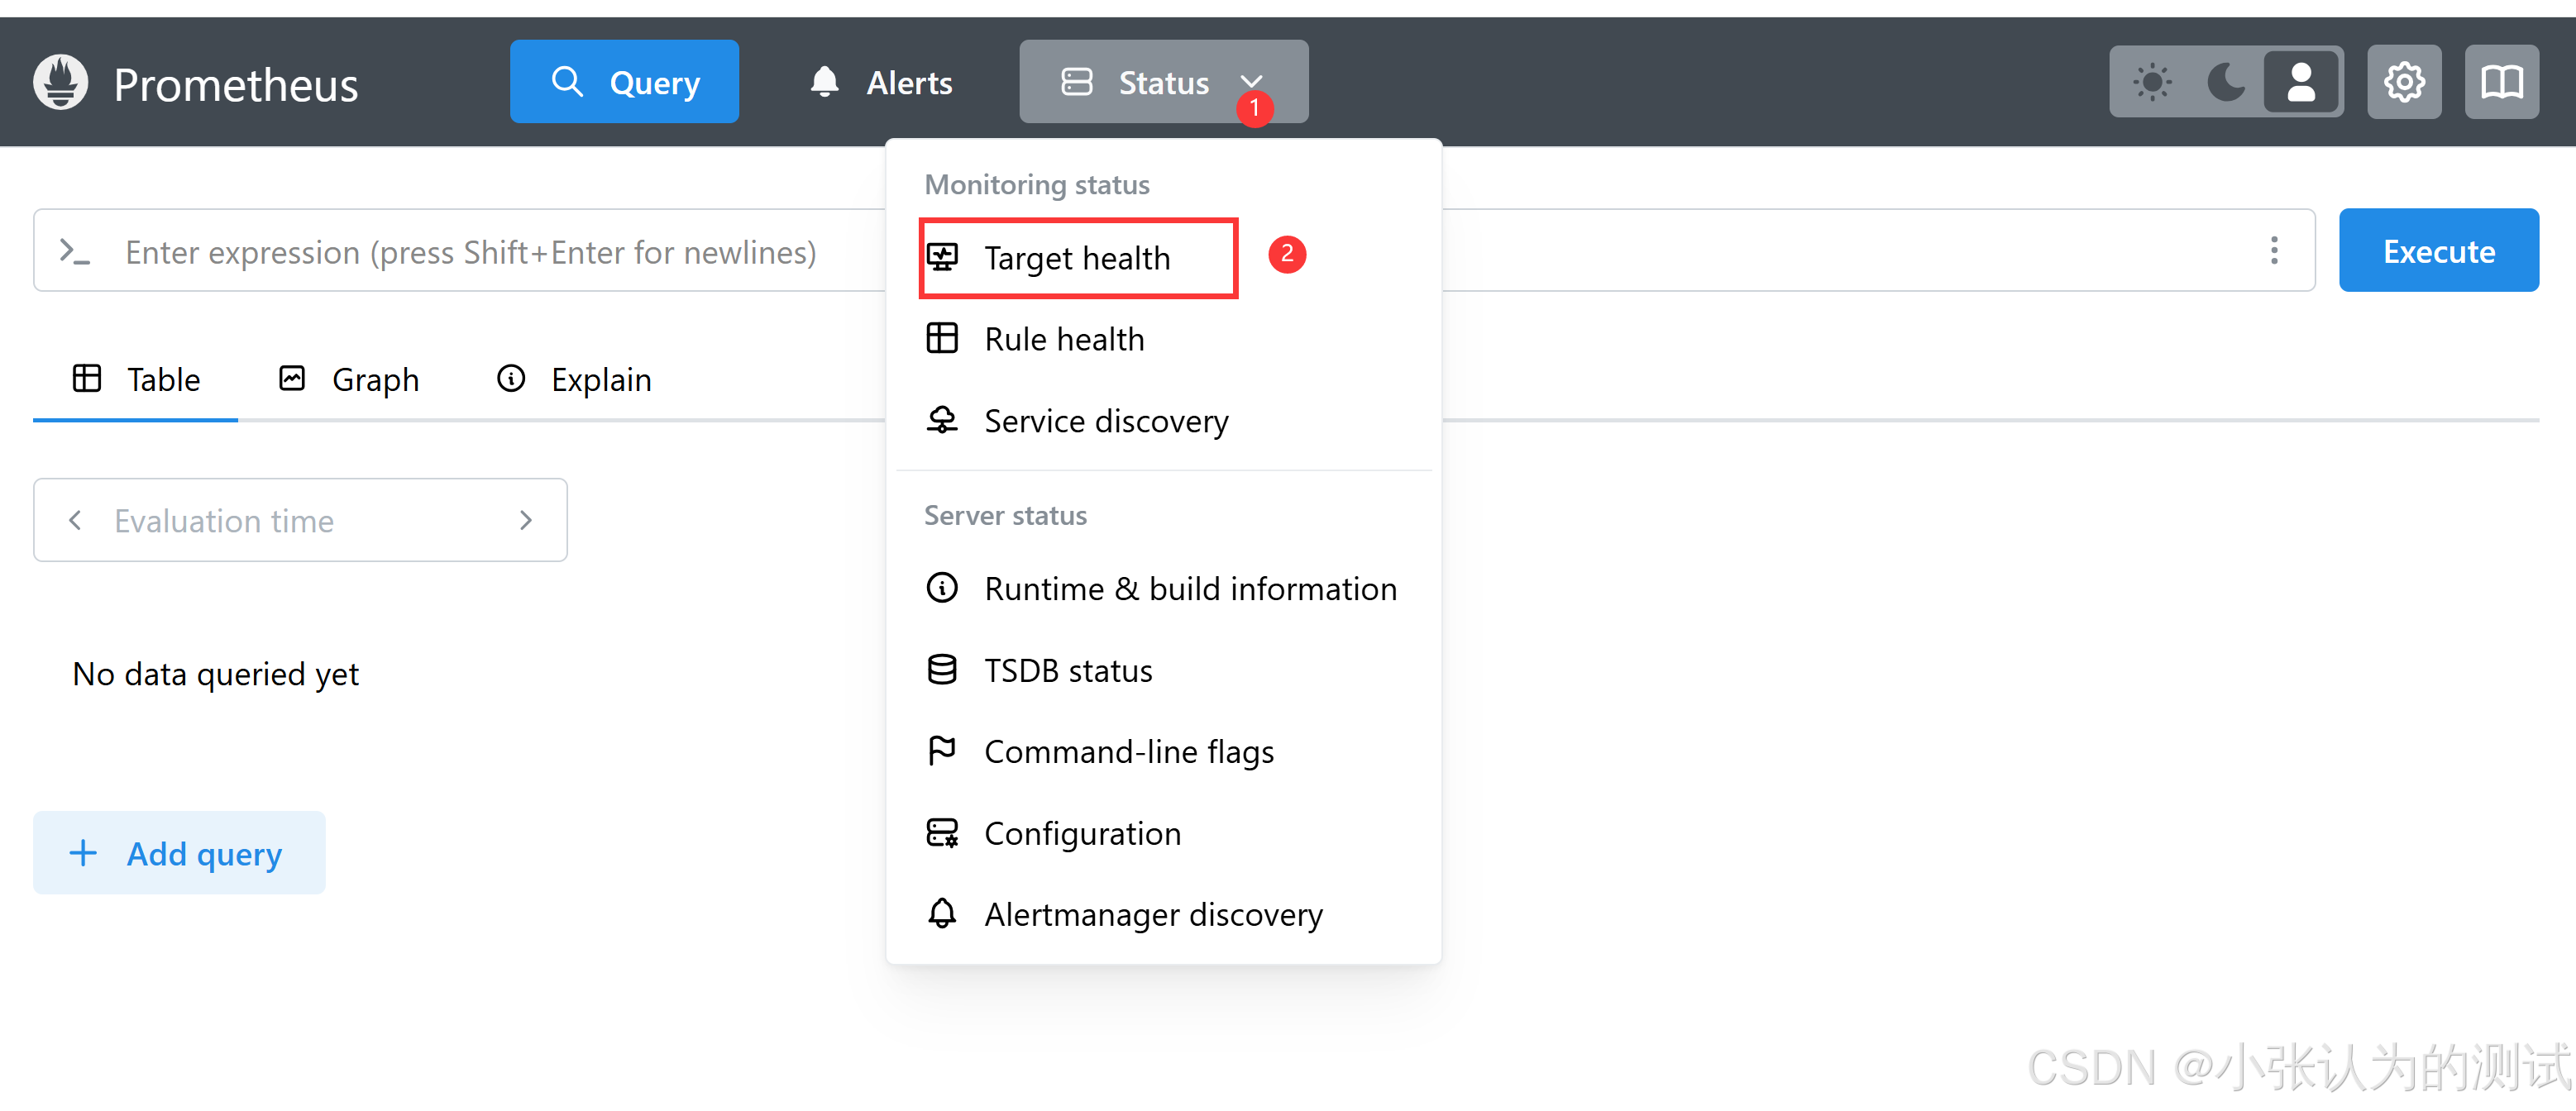
promethenus 使用
切回到promethenus目录下
cd /usr/local/prometheus/prometheus/
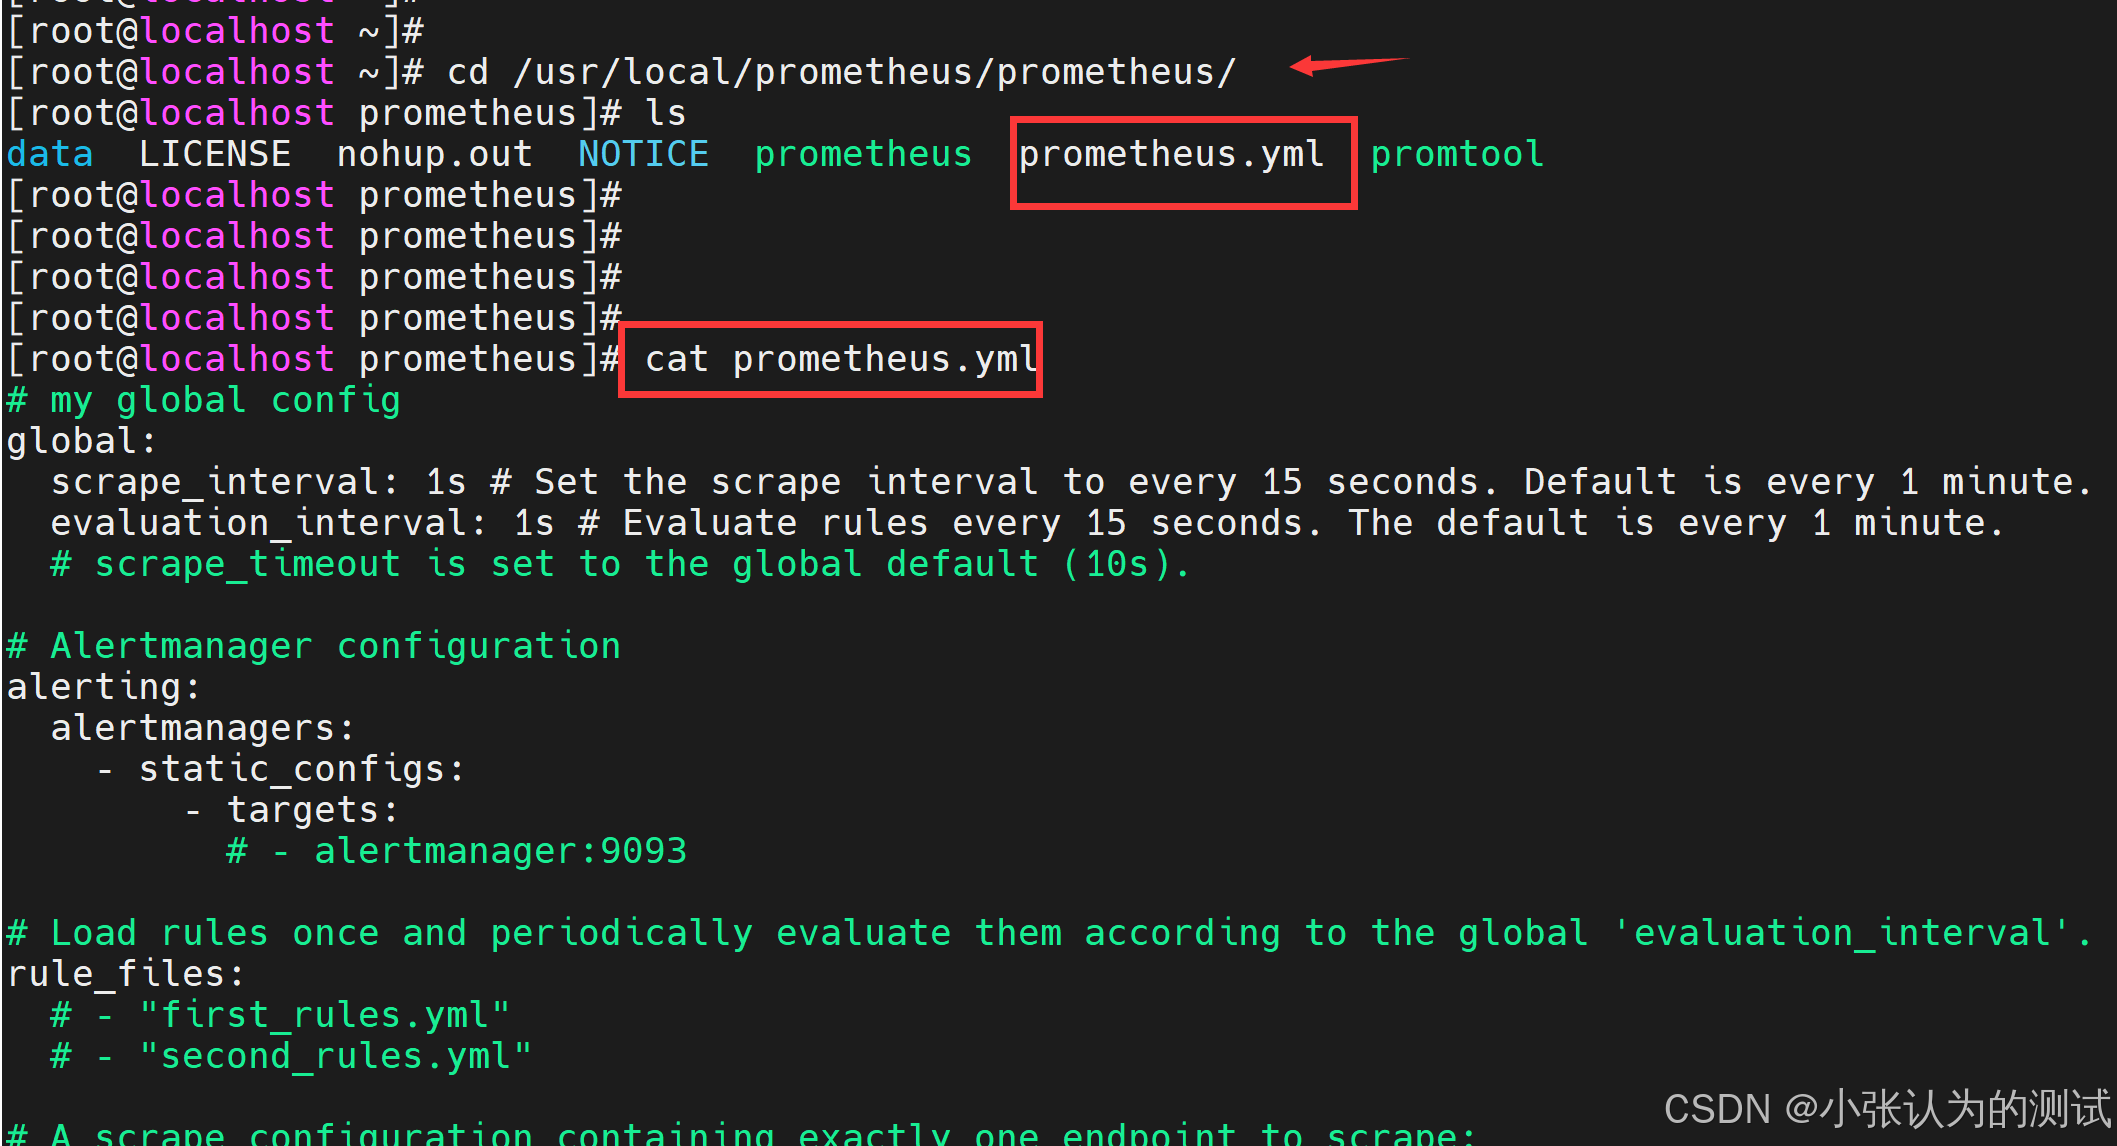
我们需要编写 prometheus.yml中的任务指定
打开prometheus.yml
vi prometheus.yml
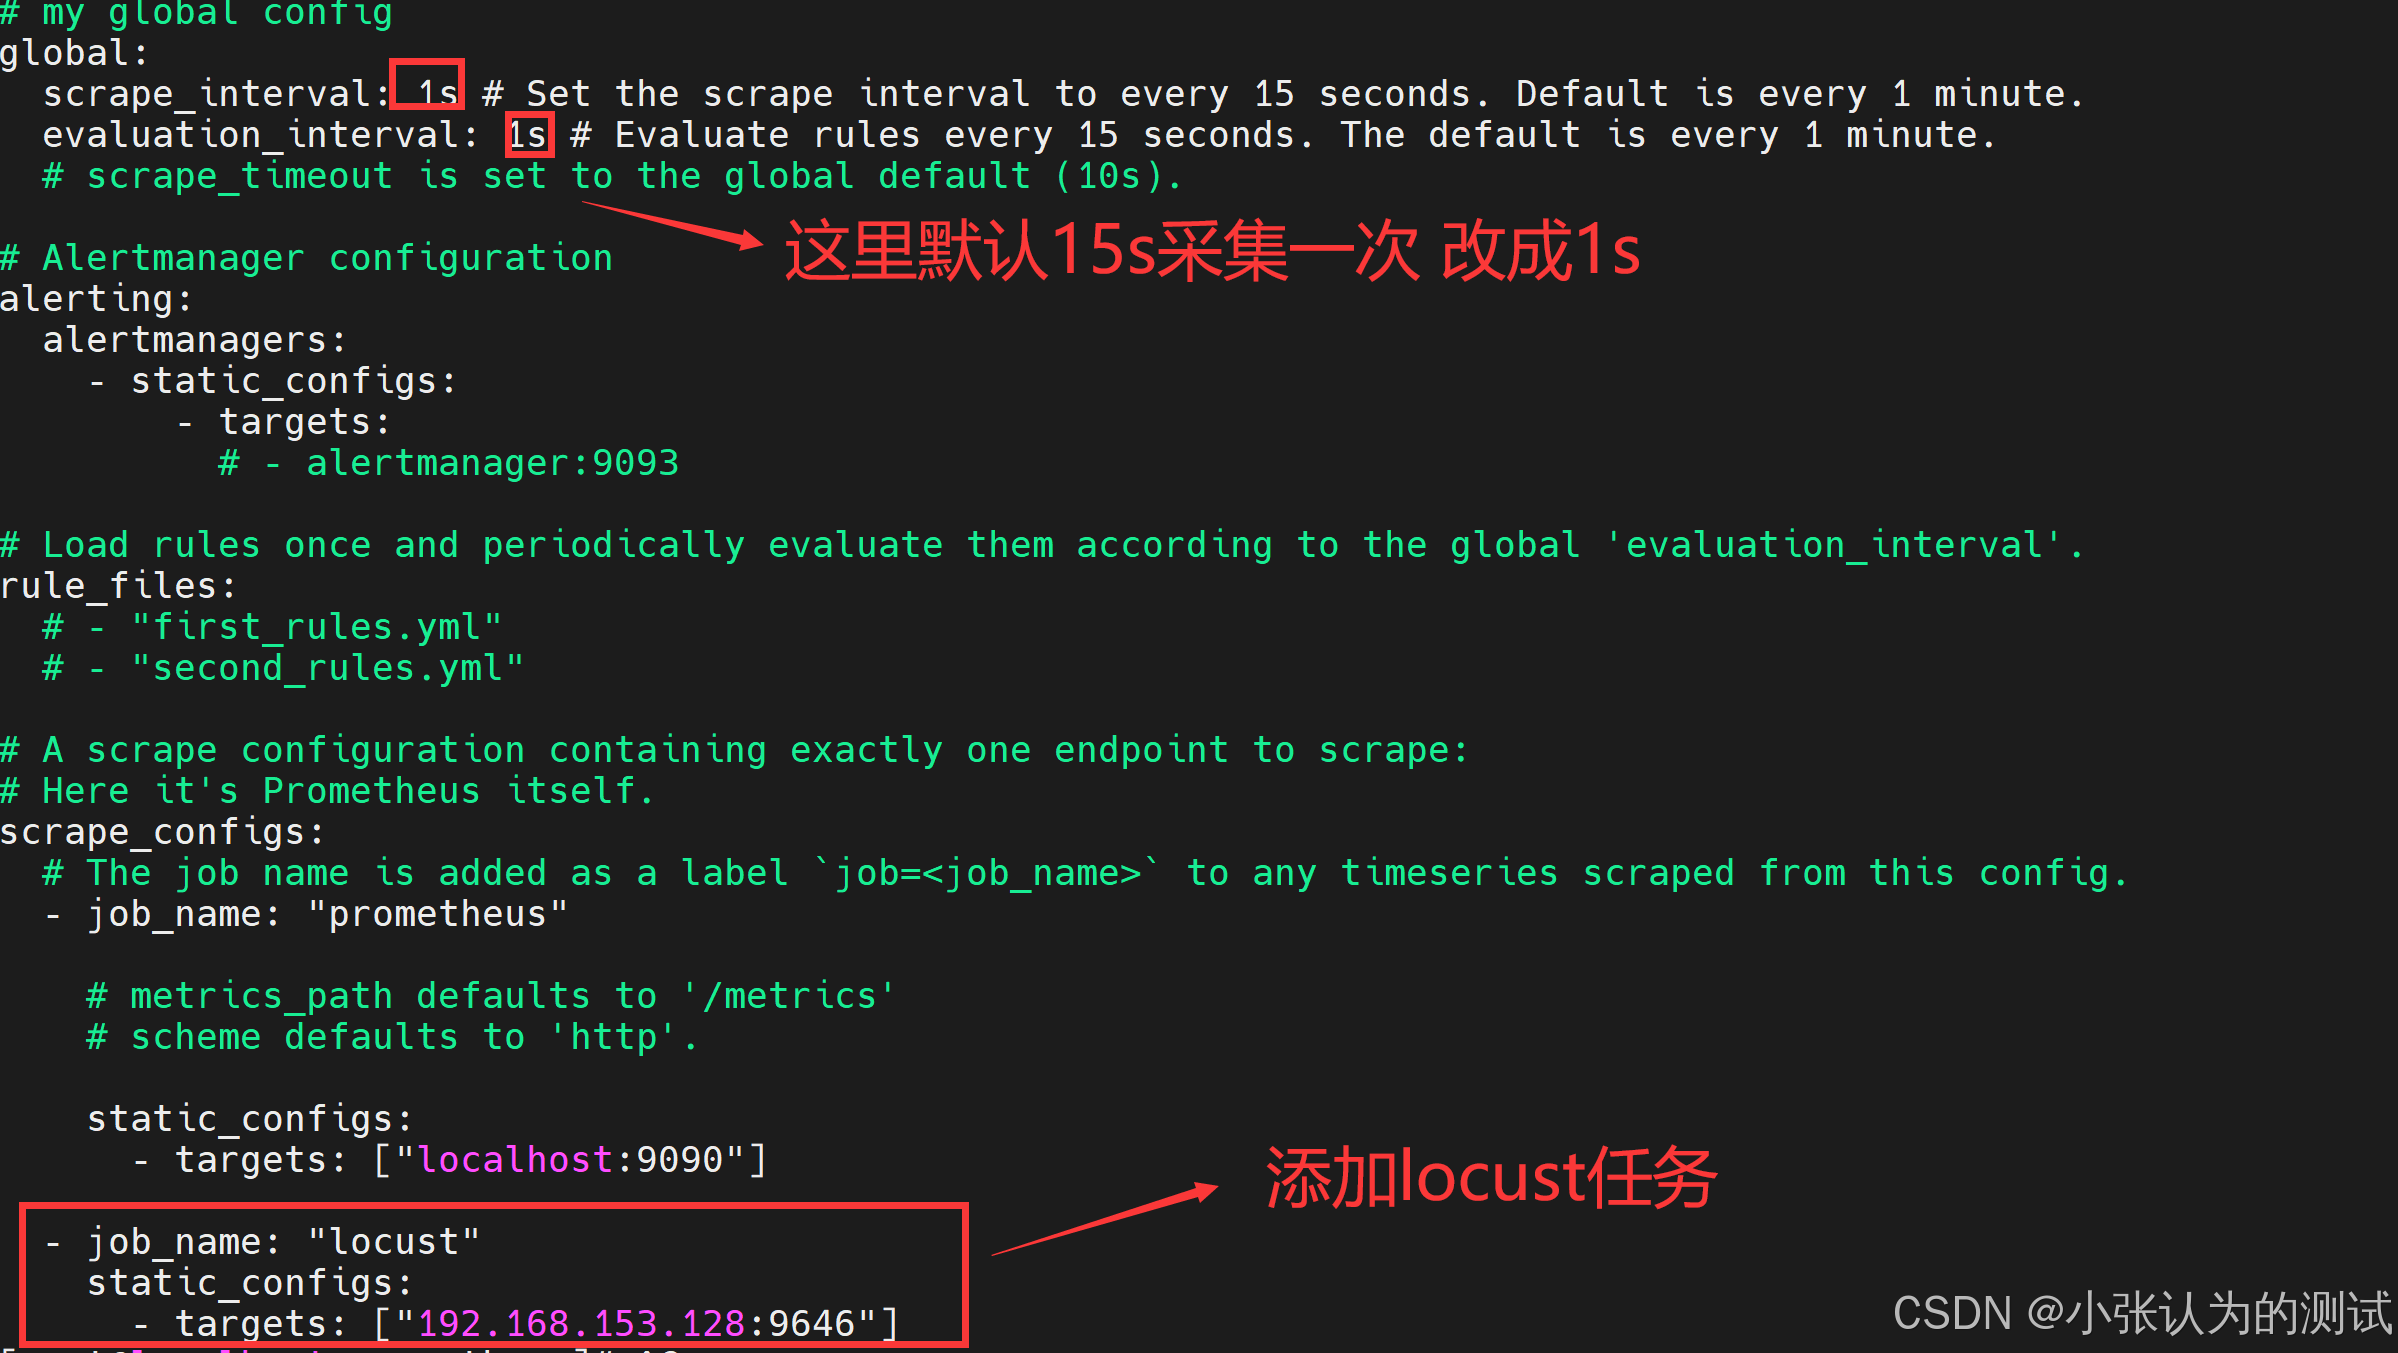
# my global config
global:
  scrape_interval: 1s # Set the scrape interval to every 15 seconds. Default is every 1 minute.
  evaluation_interval: 1s # Evaluate rules every 15 seconds. The default is every 1 minute.
  # scrape_timeout is set to the global default (10s).

# Alertmanager configuration
alerting:
  alertmanagers:
    - static_configs:
        - targets:
          # - alertmanager:9093

# Load rules once and periodically evaluate them according to the global 'evaluation_interval'.
rule_files:
  # - "first_rules.yml"
  # - "second_rules.yml"

# A scrape configuration containing exactly one endpoint to scrape:
# Here it's Prometheus itself.
scrape_configs:
  # The job name is added as a label `job=<job_name>` to any timeseries scraped from this config.
  - job_name: "prometheus"

    # metrics_path defaults to '/metrics'
    # scheme defaults to 'http'.

    static_configs:
      - targets: ["localhost:9090"]

  - job_name: "locust"
    static_configs:
    # 这里的ip地址就是你虚拟机的地址 这里的端口 就是 locust-exporter 暴露的端口 9646
      - targets: ["192.168.153.128:9646"]
然后执行prometheus
nohup prometheus --config.file="/usr/local/prometheus/prometheus/prometheus.yml" &
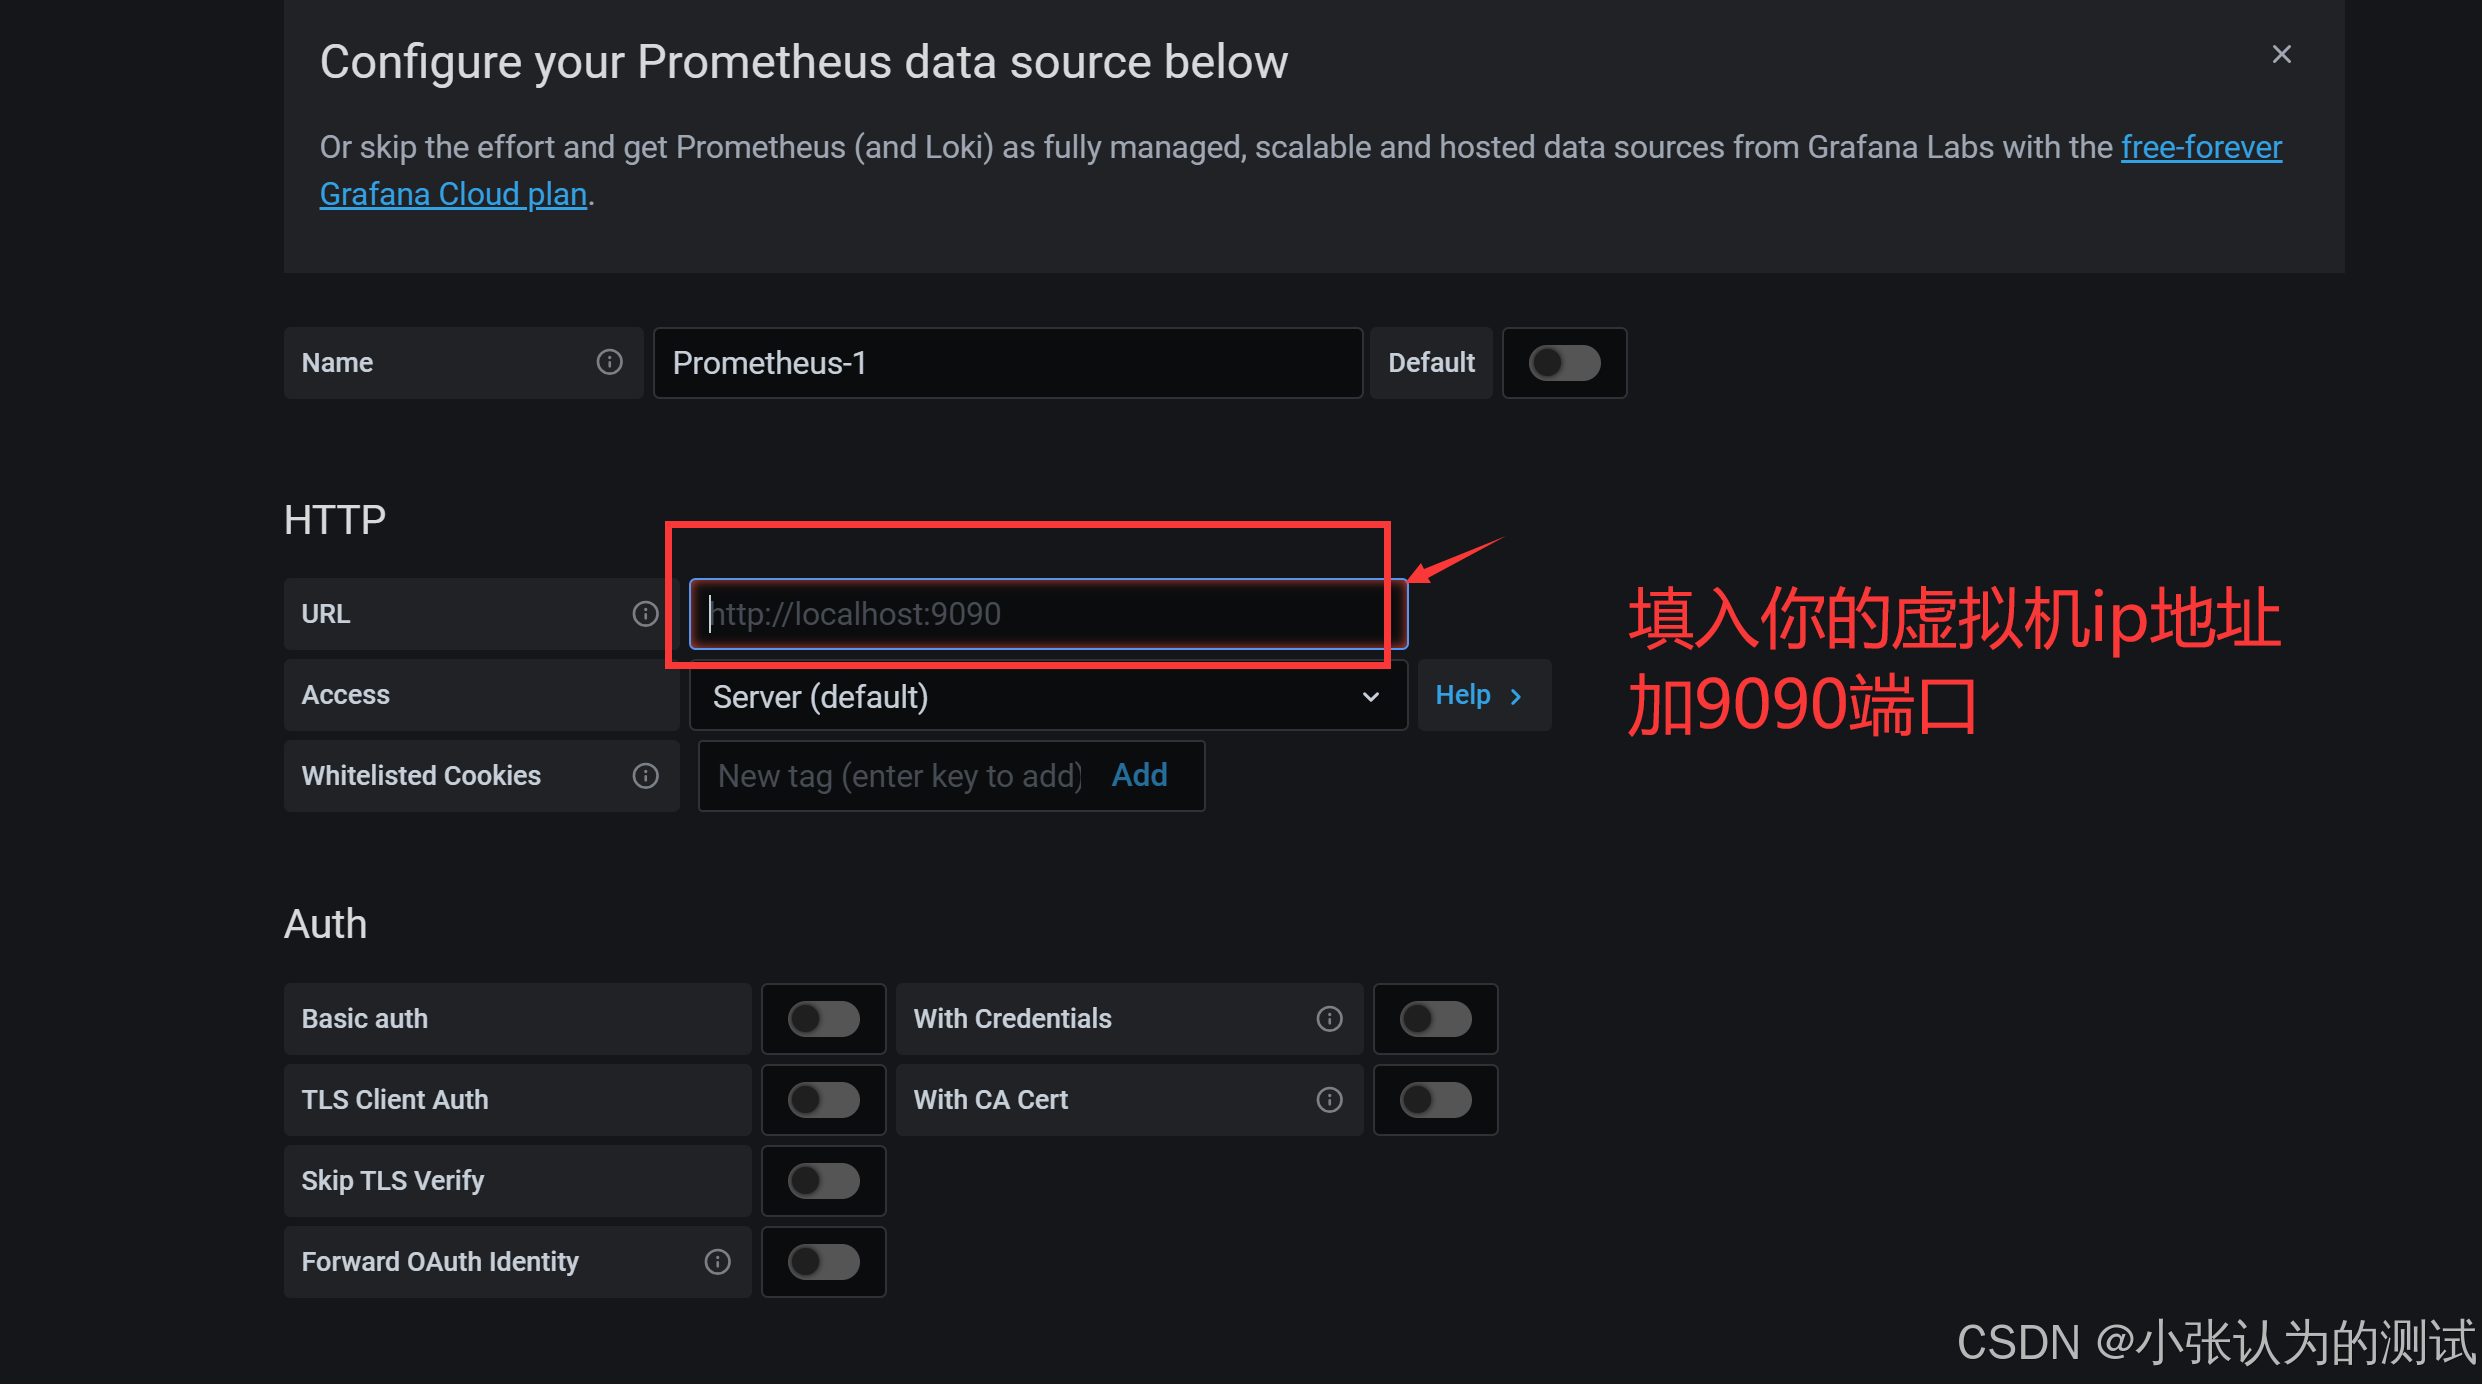
访问地址:http://192.168.40.128:9090
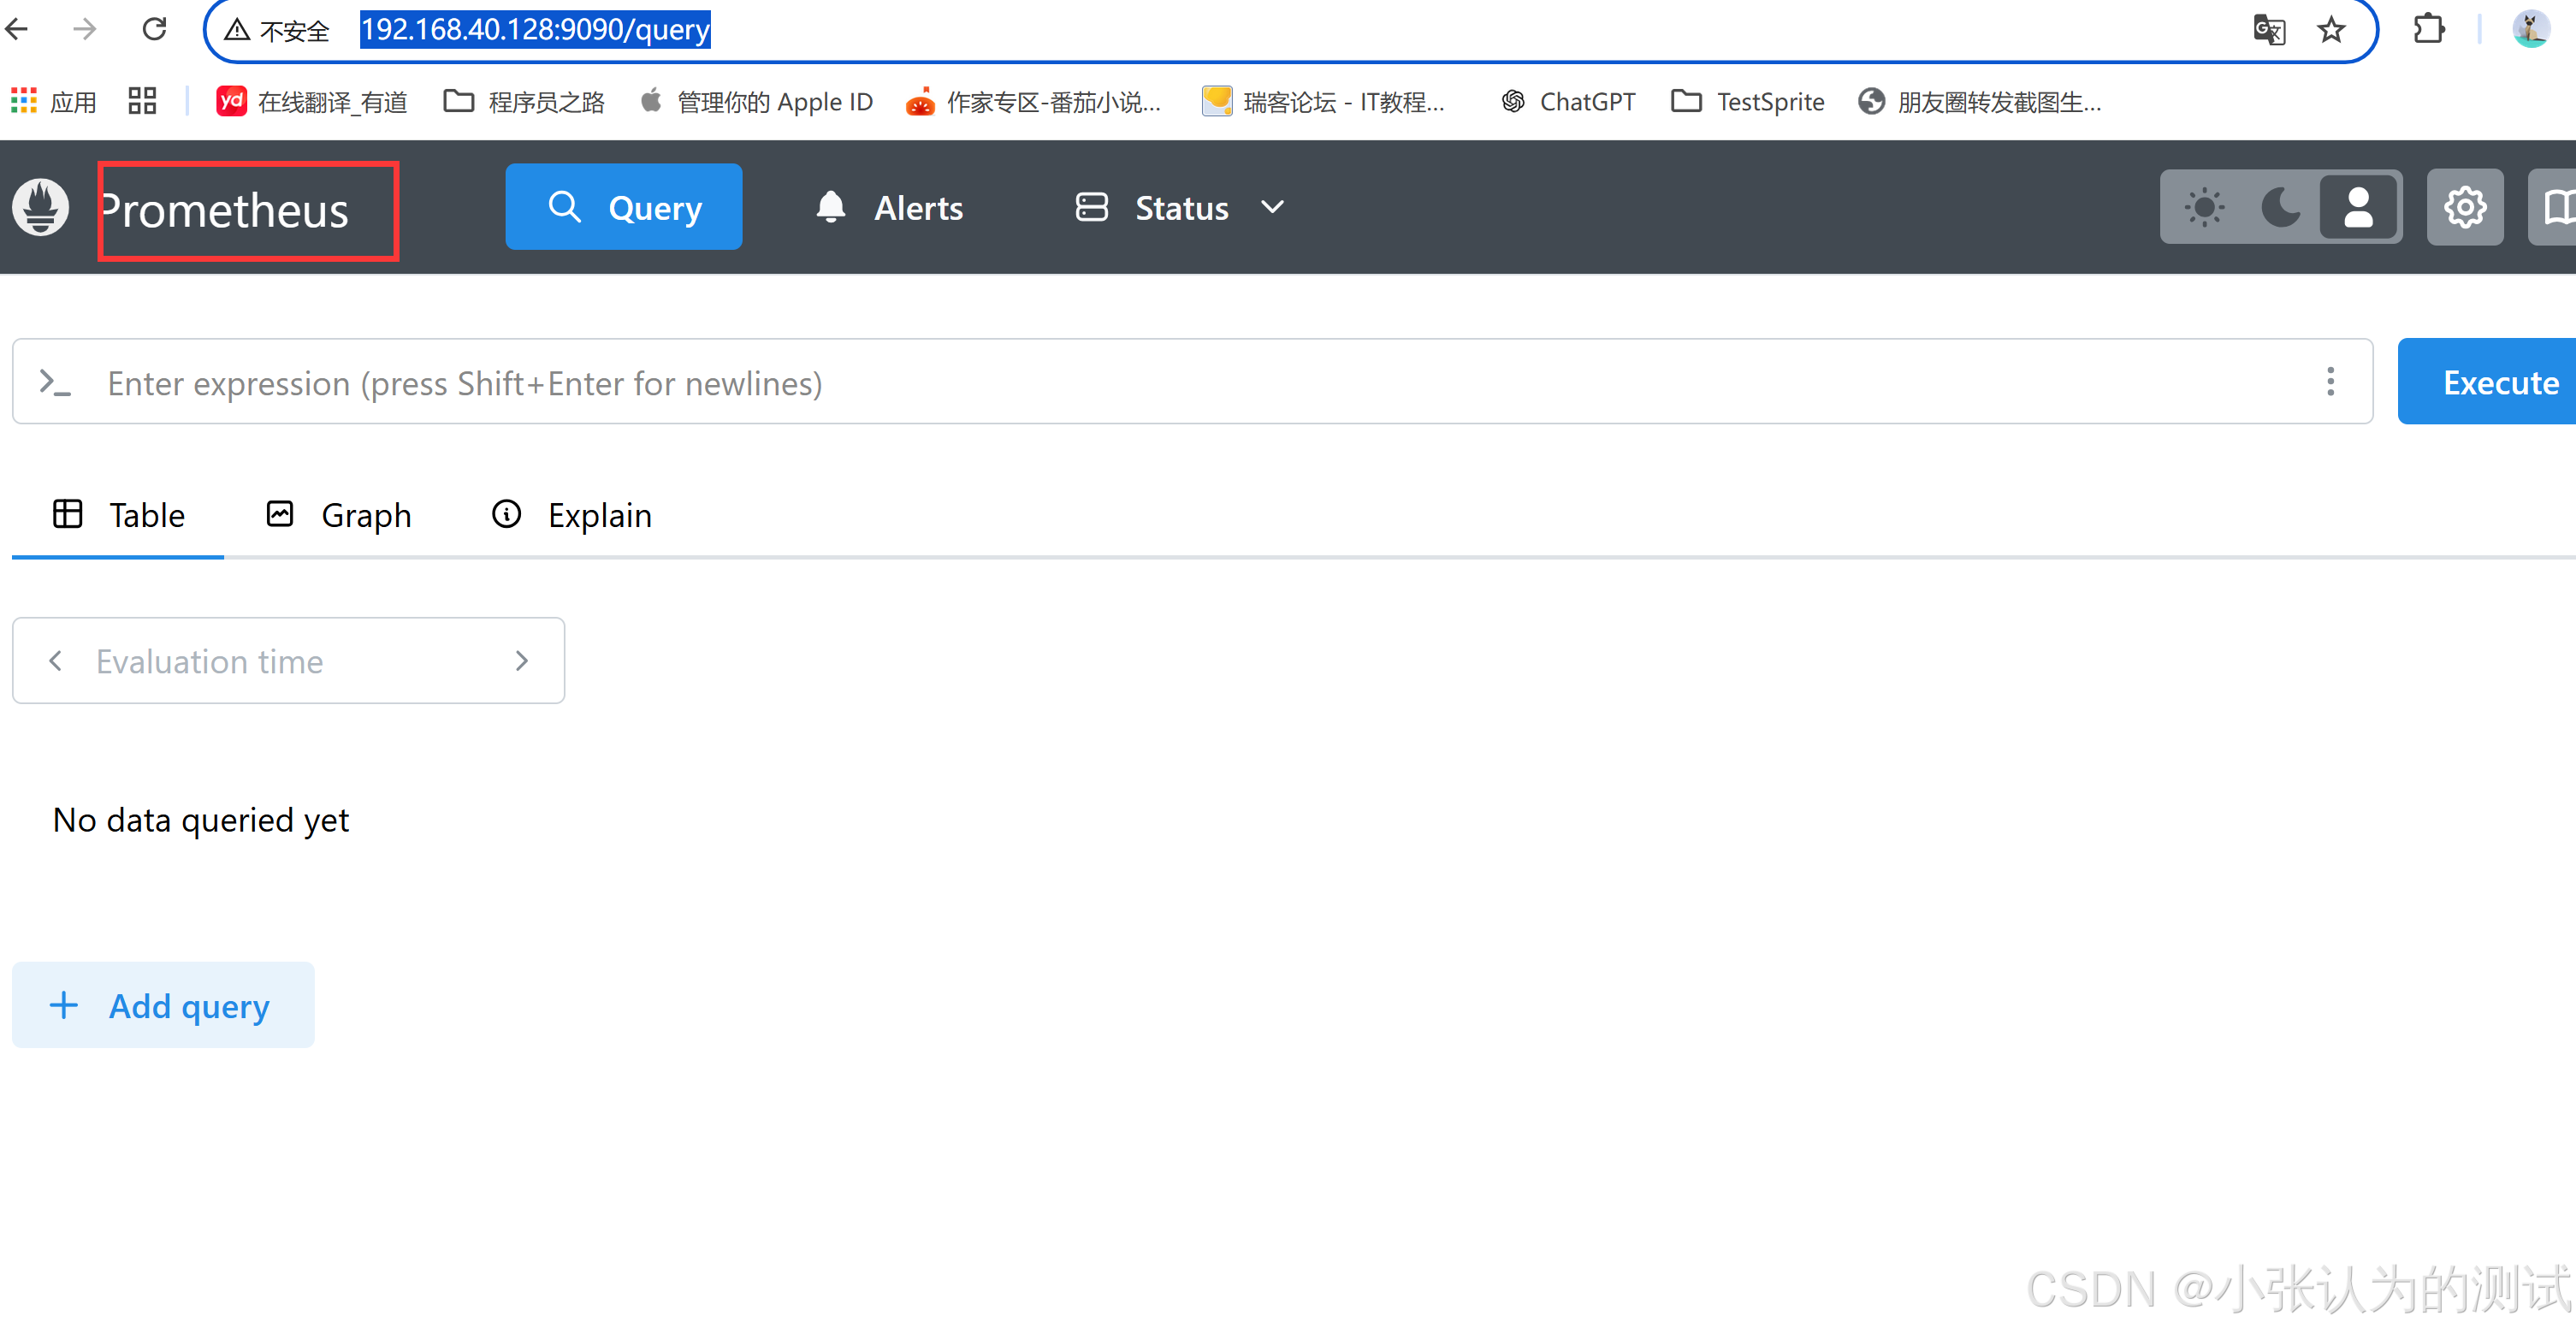
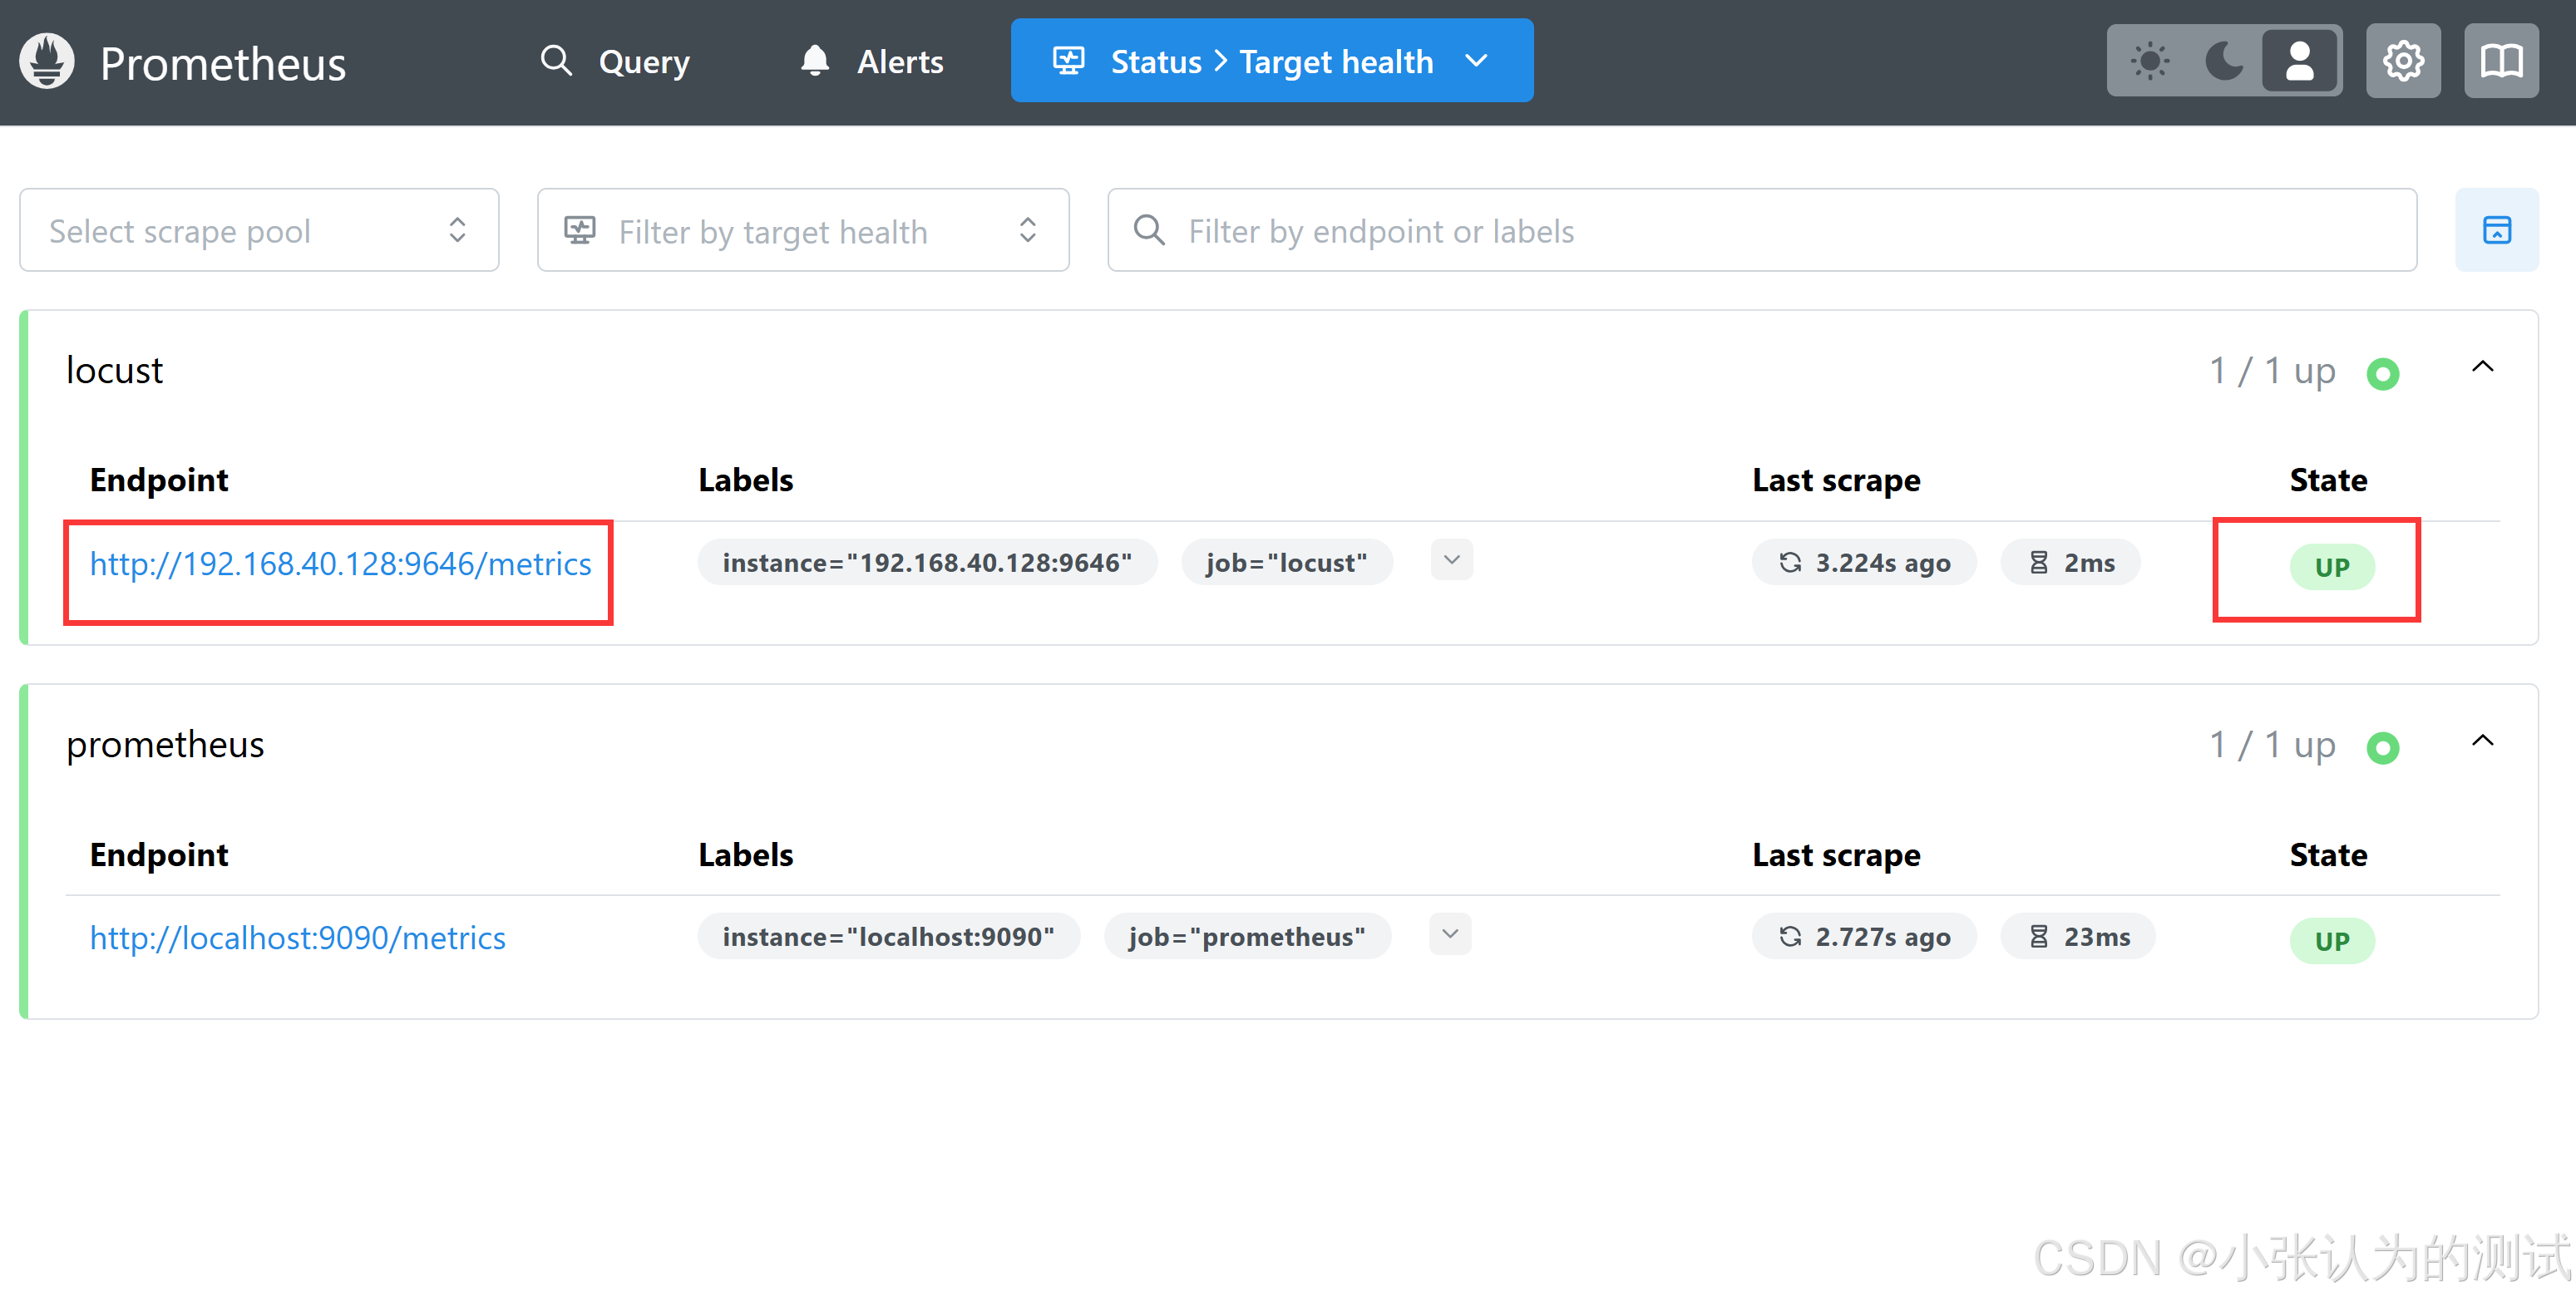
如果能看到prometheus有以上显示,表明是能正确采集到你的信息的,证明环境没问题
如果你访问不了,请检查你的防火墙是否关闭,或者在开启的状态下(默认是开启的)暴露prometheus需要的端口 9090
以下是如何暴露9090端口
暴露9090端口
# 永久暴露端口(重启后依然有效)
sudo firewall-cmd --add-port=9090/tcp --permanent
# 重新加载防火墙规则以生效
sudo firewall-cmd --reload
再次访问 地址 http://192.168.40.128:9090 应该就可以看到了
配置service 启动 prometheus
在 /usr/lib/systemd/system 下面创建 prometheus.service
touch /usr/lib/systemd/system/prometheus.service
配置prometheus.service
vi prometheus.service
插入以下内容
[Unit]
Description=Prometheus Server
Documentation=https://prometheus.io/docs/introduction/overview/
After=network.target

[Service]
#User=prometheus
#Group=prometheus
Type=simple   #这里设置为 simple
# 这里的ExecStart 路径换成自己安装prometheus的路径
# --config.file 是安装目录下面的prometheus.yml的配置文件
ExecStart=/usr/local/prometheus/prometheus/prometheus --config.file=/usr/local/prometheus/prometheus/prometheus.yml
Restart=always

[Install]
WantedBy=multi-user.target
保存文件后,重新加载 Systemd 服务配置
sudo systemctl daemon-reload
启动 prometheus.service
systemctl start prometheus.service
设置自启动
systemctl enable prometheus.service
查看prometheus.service状态:
systemctl status prometheus.service
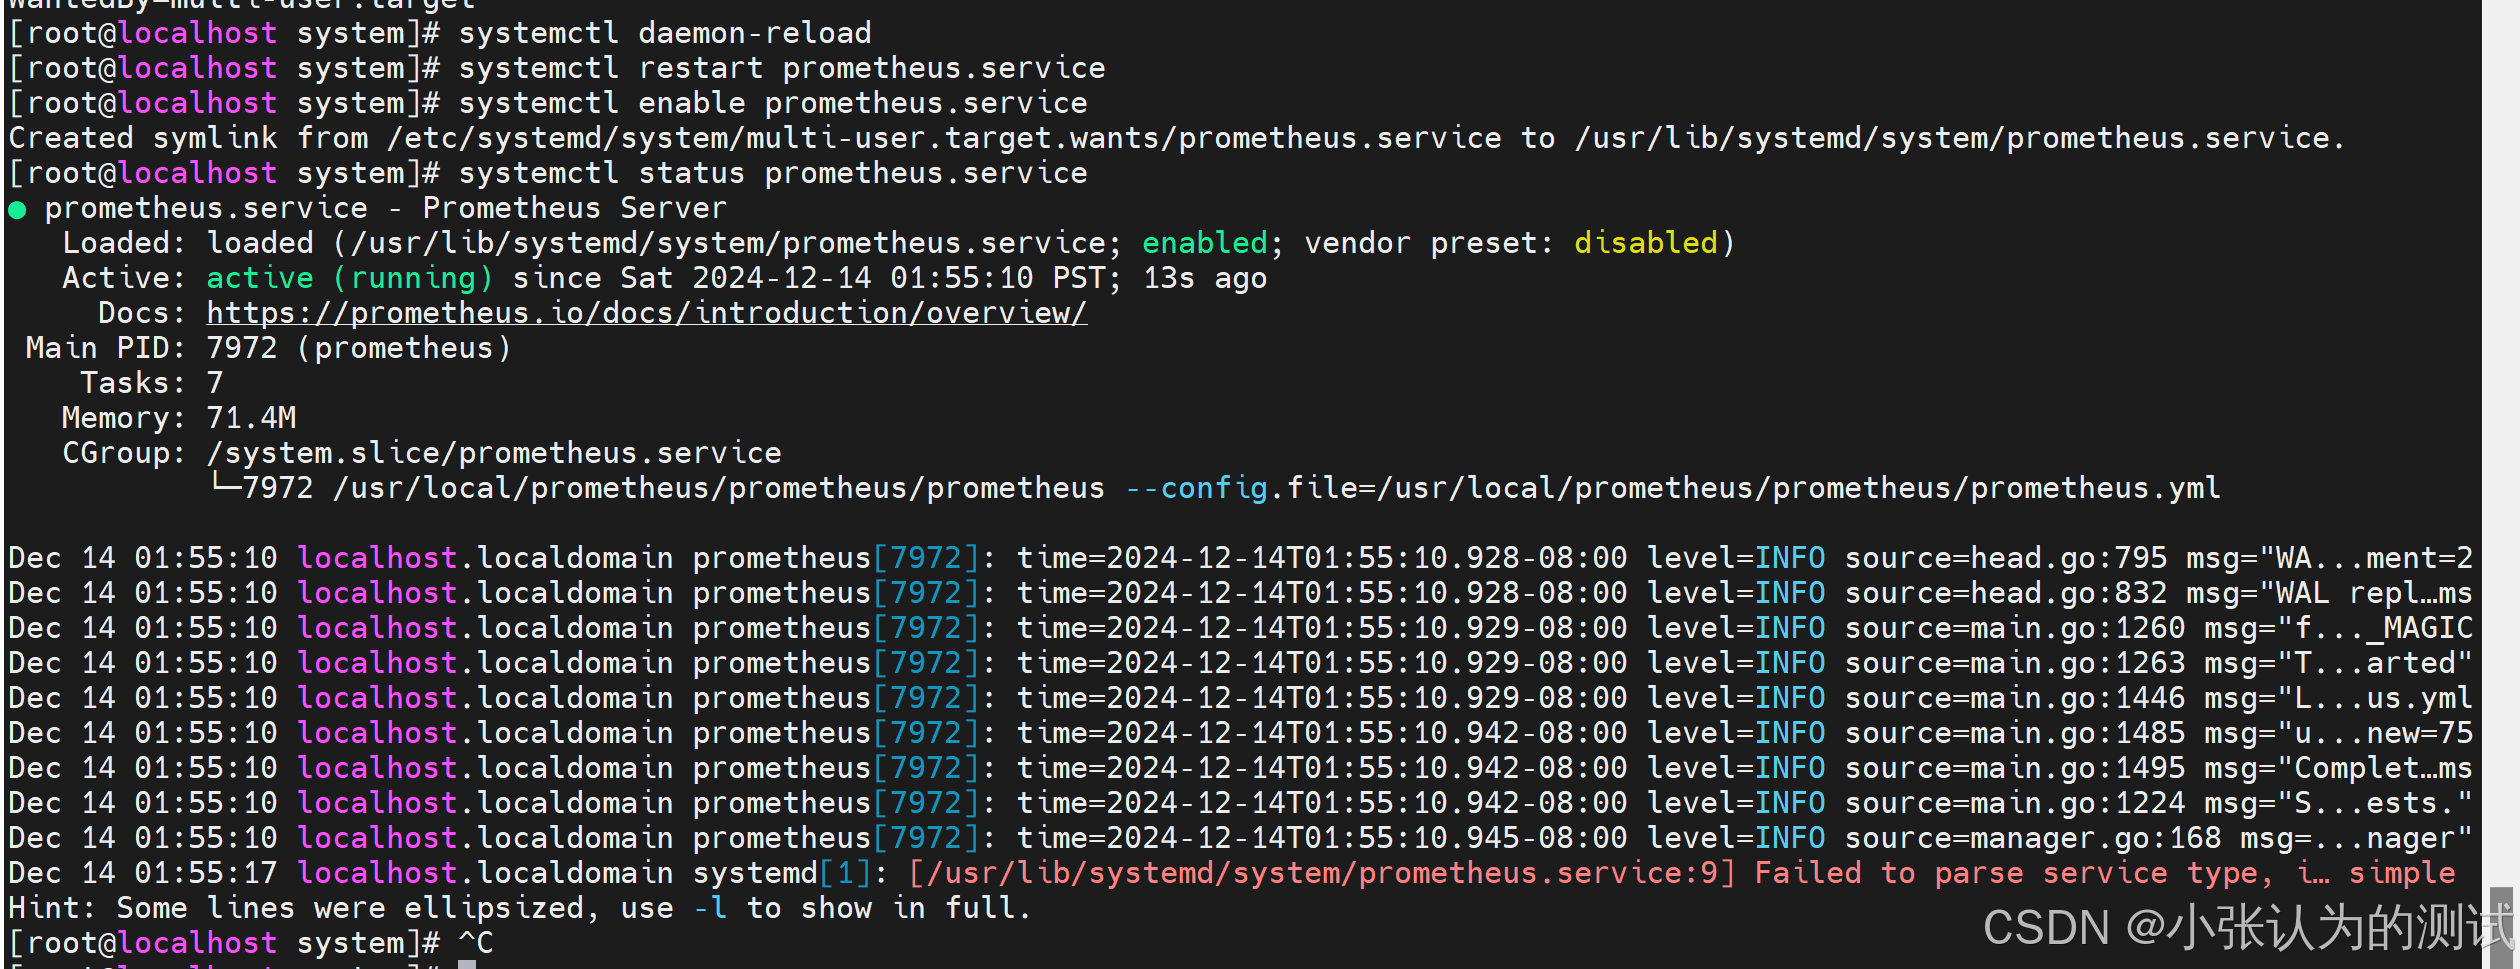
表示已经启动成功
locust如何去使用
在locust最新版本中,默认已经暴露给了 prometheus的数据采集
因此你在执行你本地的locust脚本的时候,你需要执行如下命令
locust -f .\testcases\MainScripts.py --web-host 192.168.25.100 --web-port 8089
其中
--web-host 192.168.25.100 # 后面的 ip地址是你的windows 本地的 ipv4地址
--web-port 8089 # 是你本地执行的端口 默认是8089
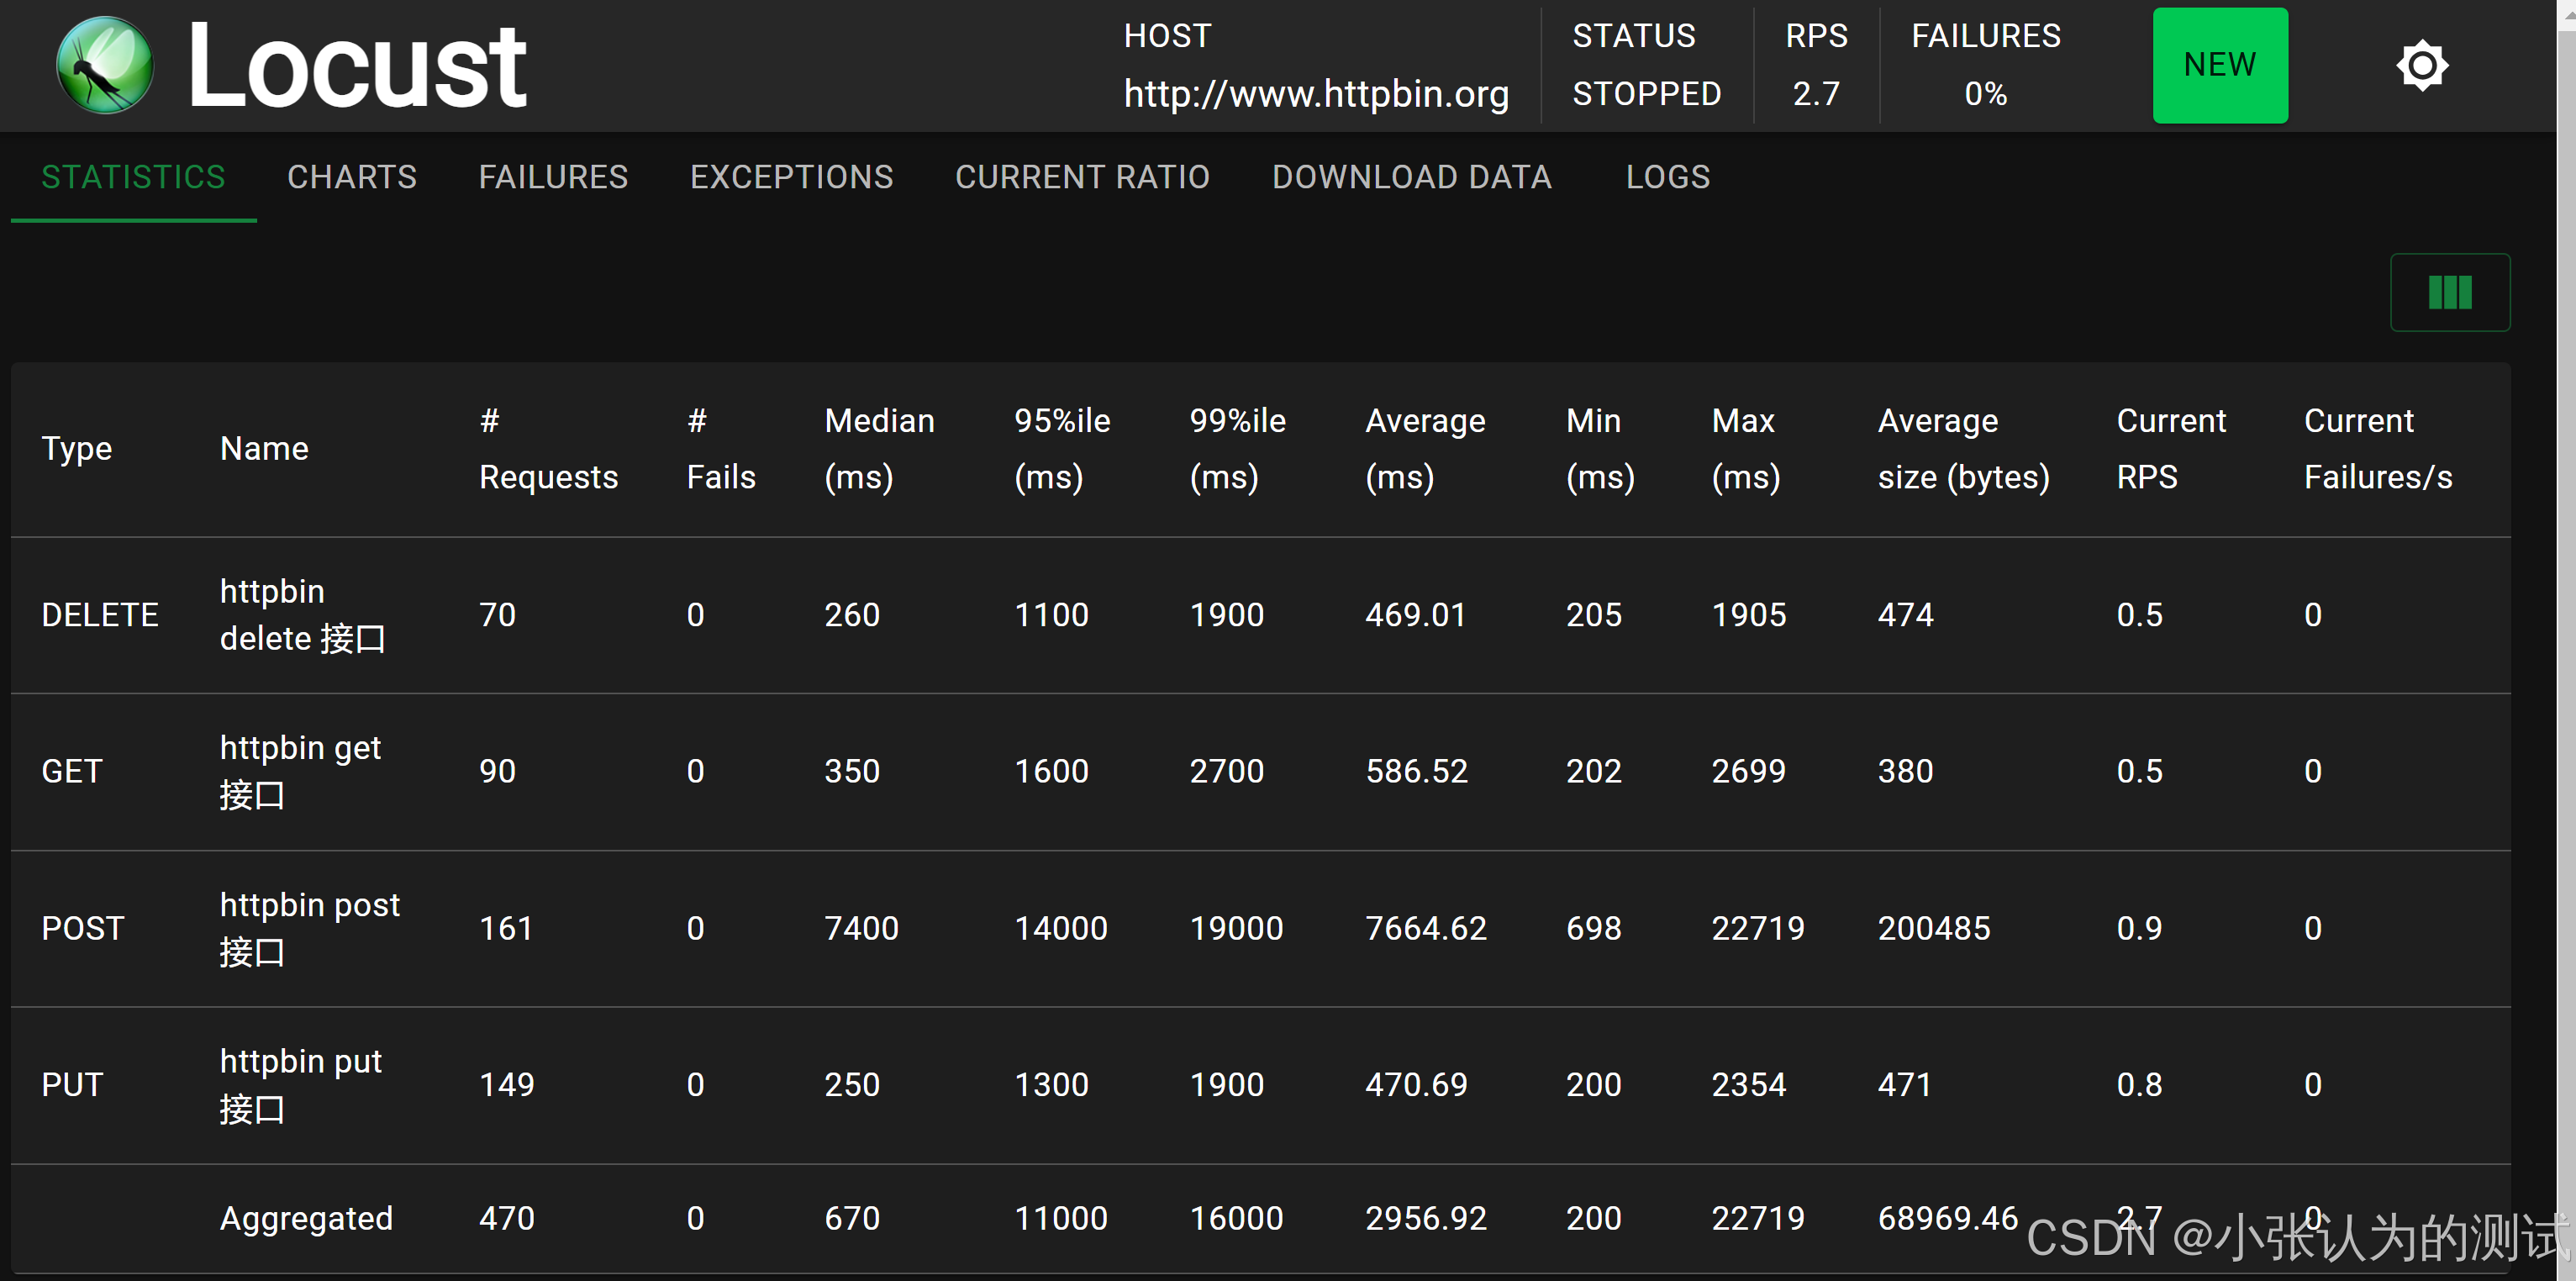
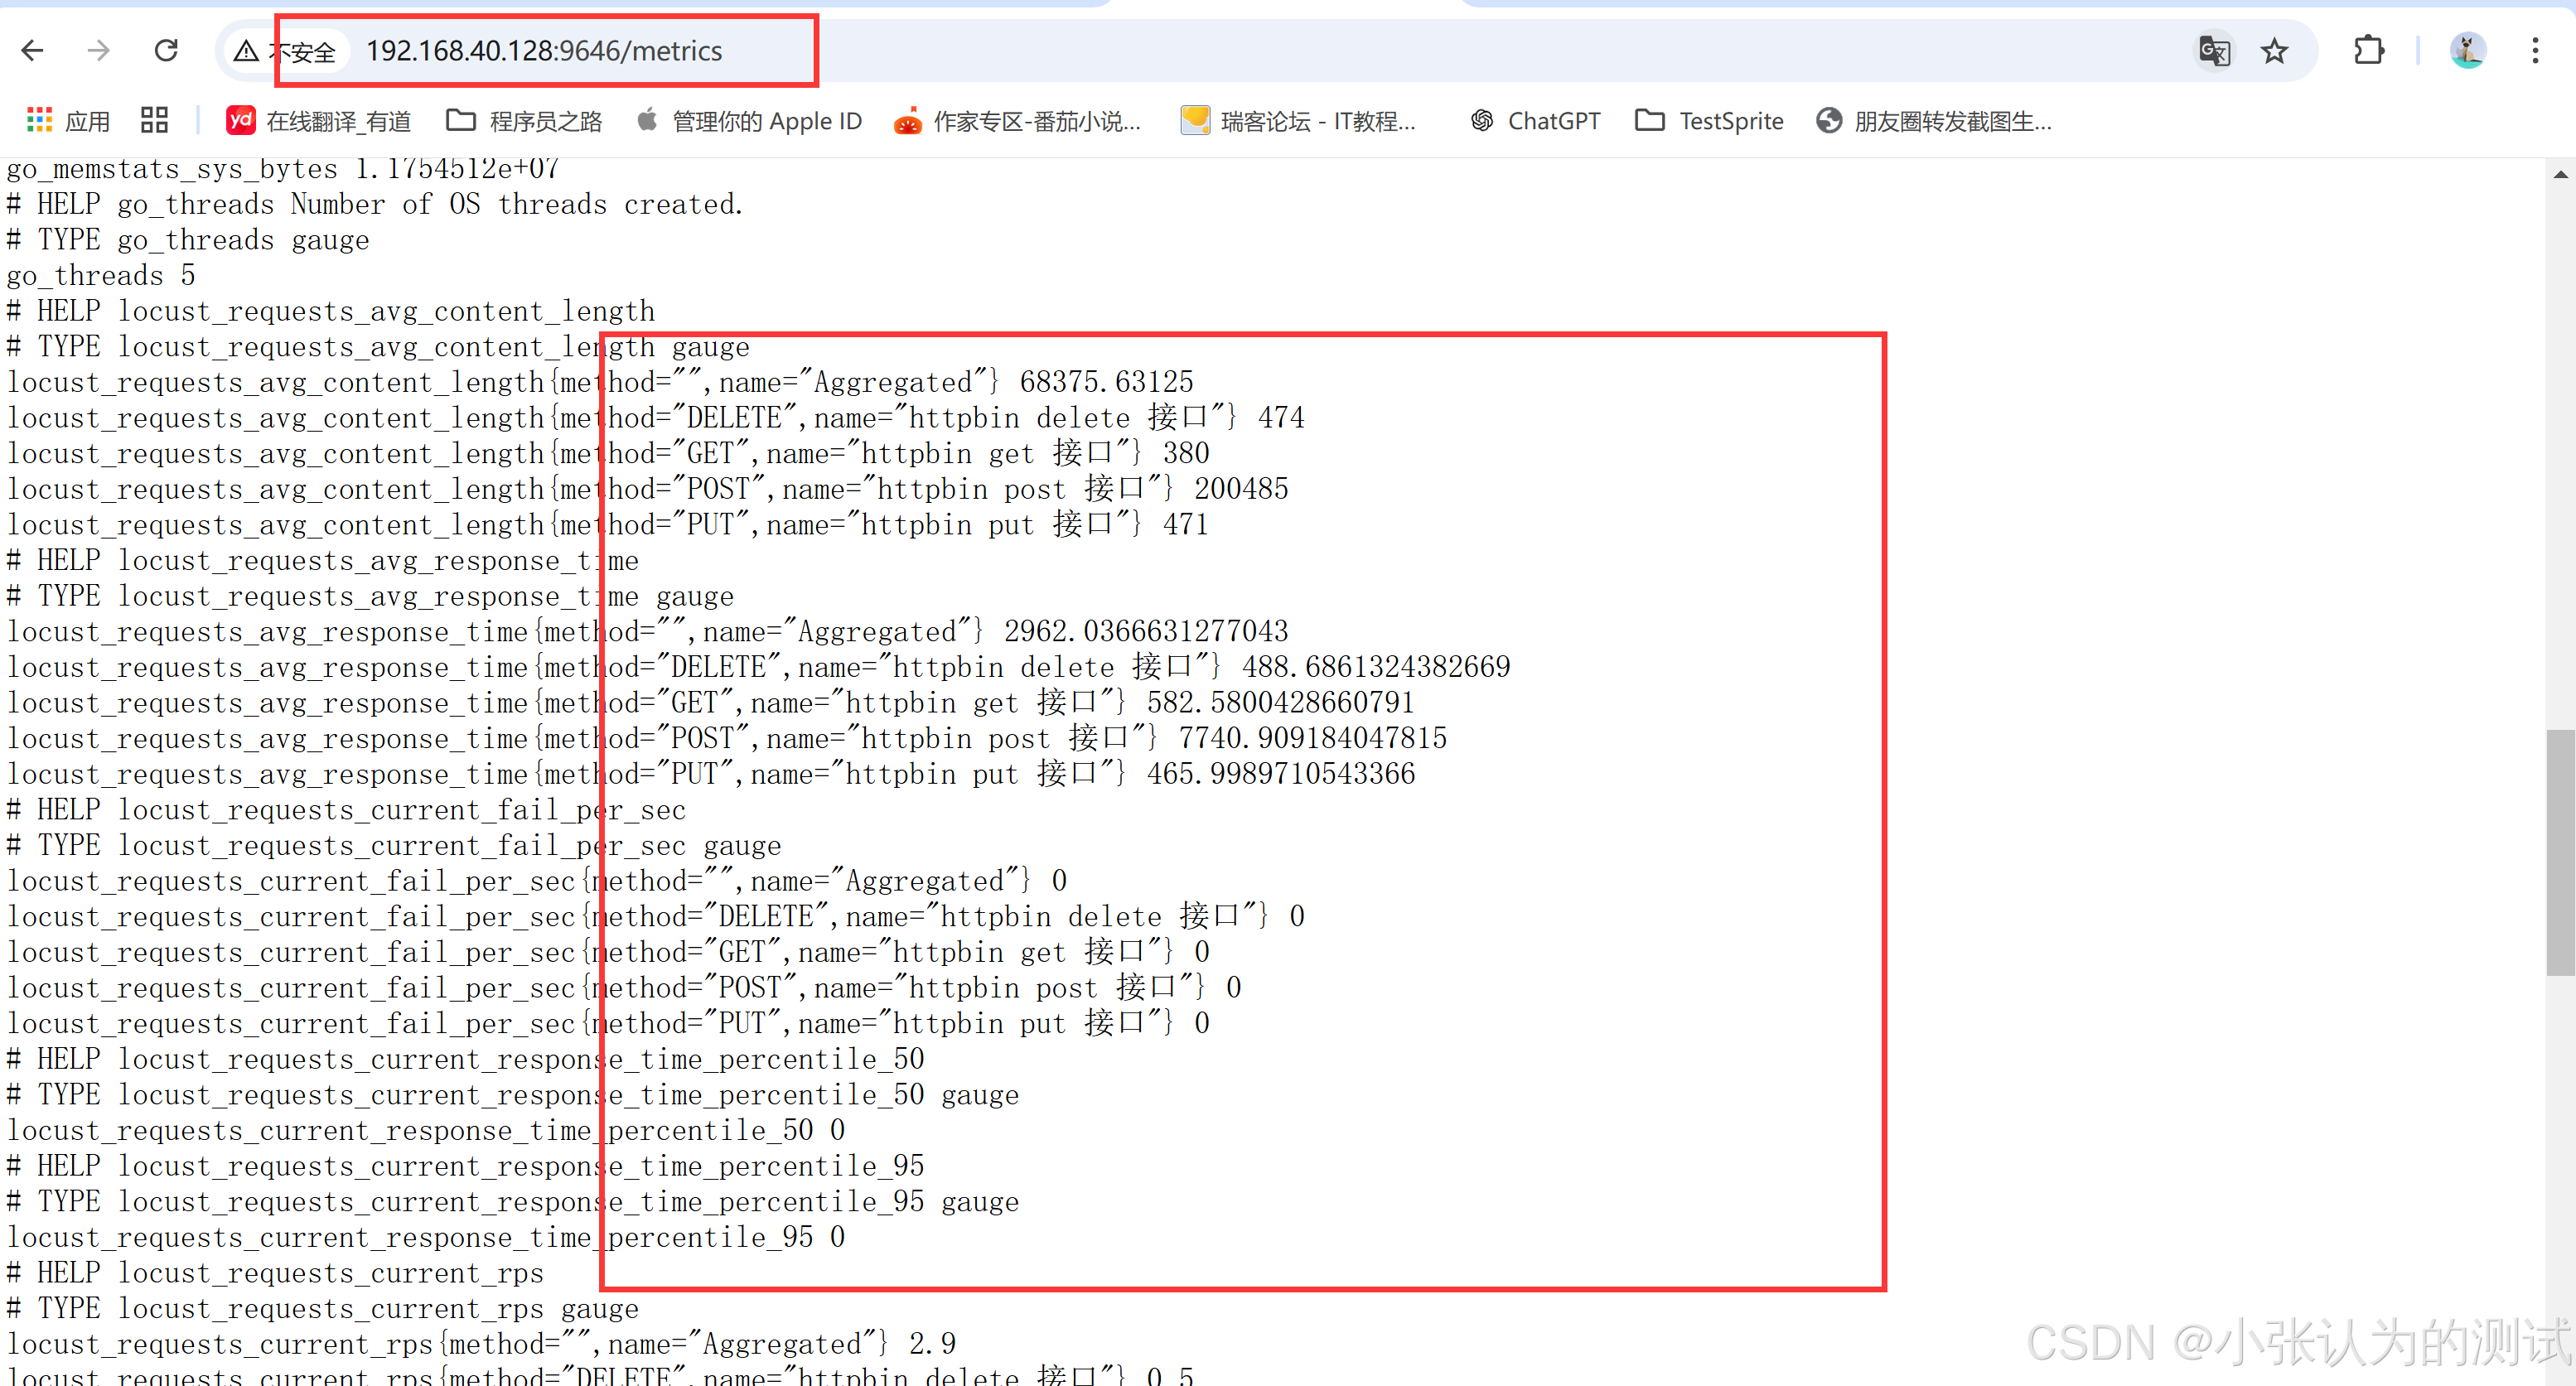
注意:当你再次访问 http://192.168.40.128:9646/metrics 时候,你会看到你的压测的接口详细信息
Grafana 使用
如果你没安装 Grafana ,那么请看这篇文章:超详细!手把手教你 搭建 Jmeter + Influxdb + Grafana 性能监控大屏
首先需要切换到 Grafana 安装目录下
执行
nohup grafana-server web > /usr/local/grafana/grafana-7.5.2/grafana-server.log 2>&1 &
注意:如果你设置了 grafana 服务文件启动方式,并配置了开机自己启动,那么你就可以不用频繁的执行上述命令
(具体服务文件方式启动看这篇文章:超详细!手把手教你 搭建 Jmeter + Influxdb + Grafana 性能监控大屏)
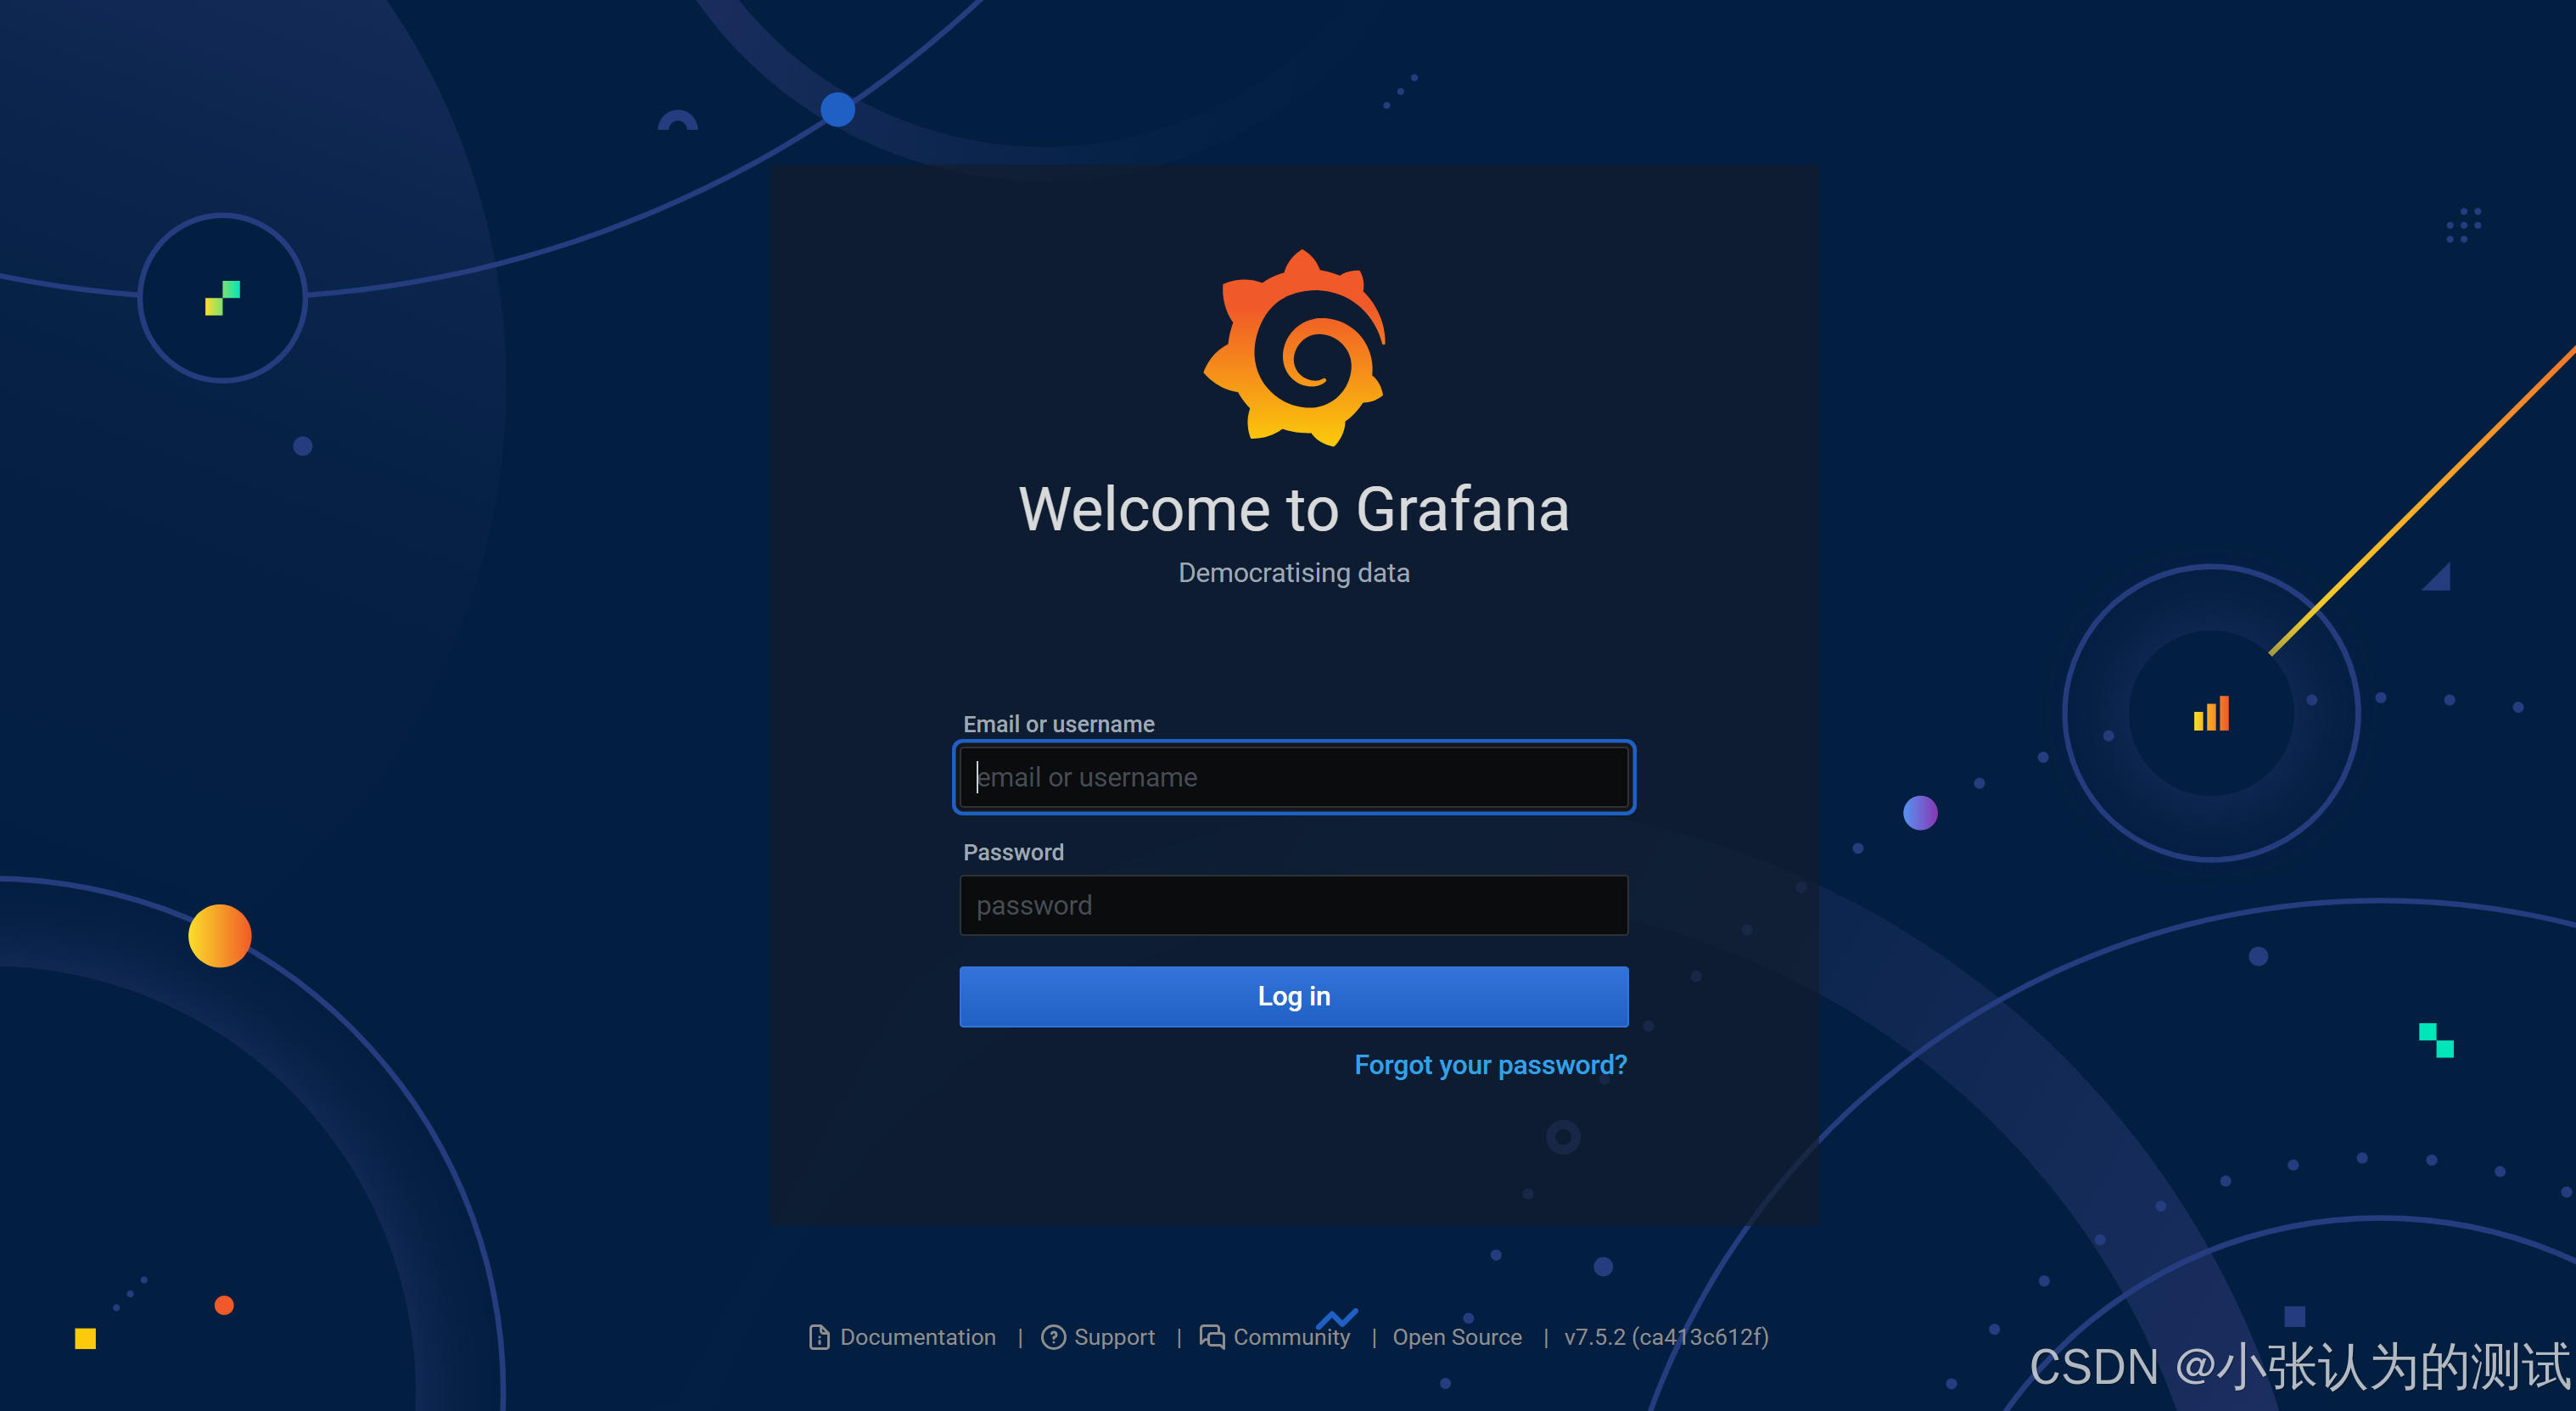
访问:http://192.168.40.128:3000/login
Grafana 默认用户名 和 密码都是 admin
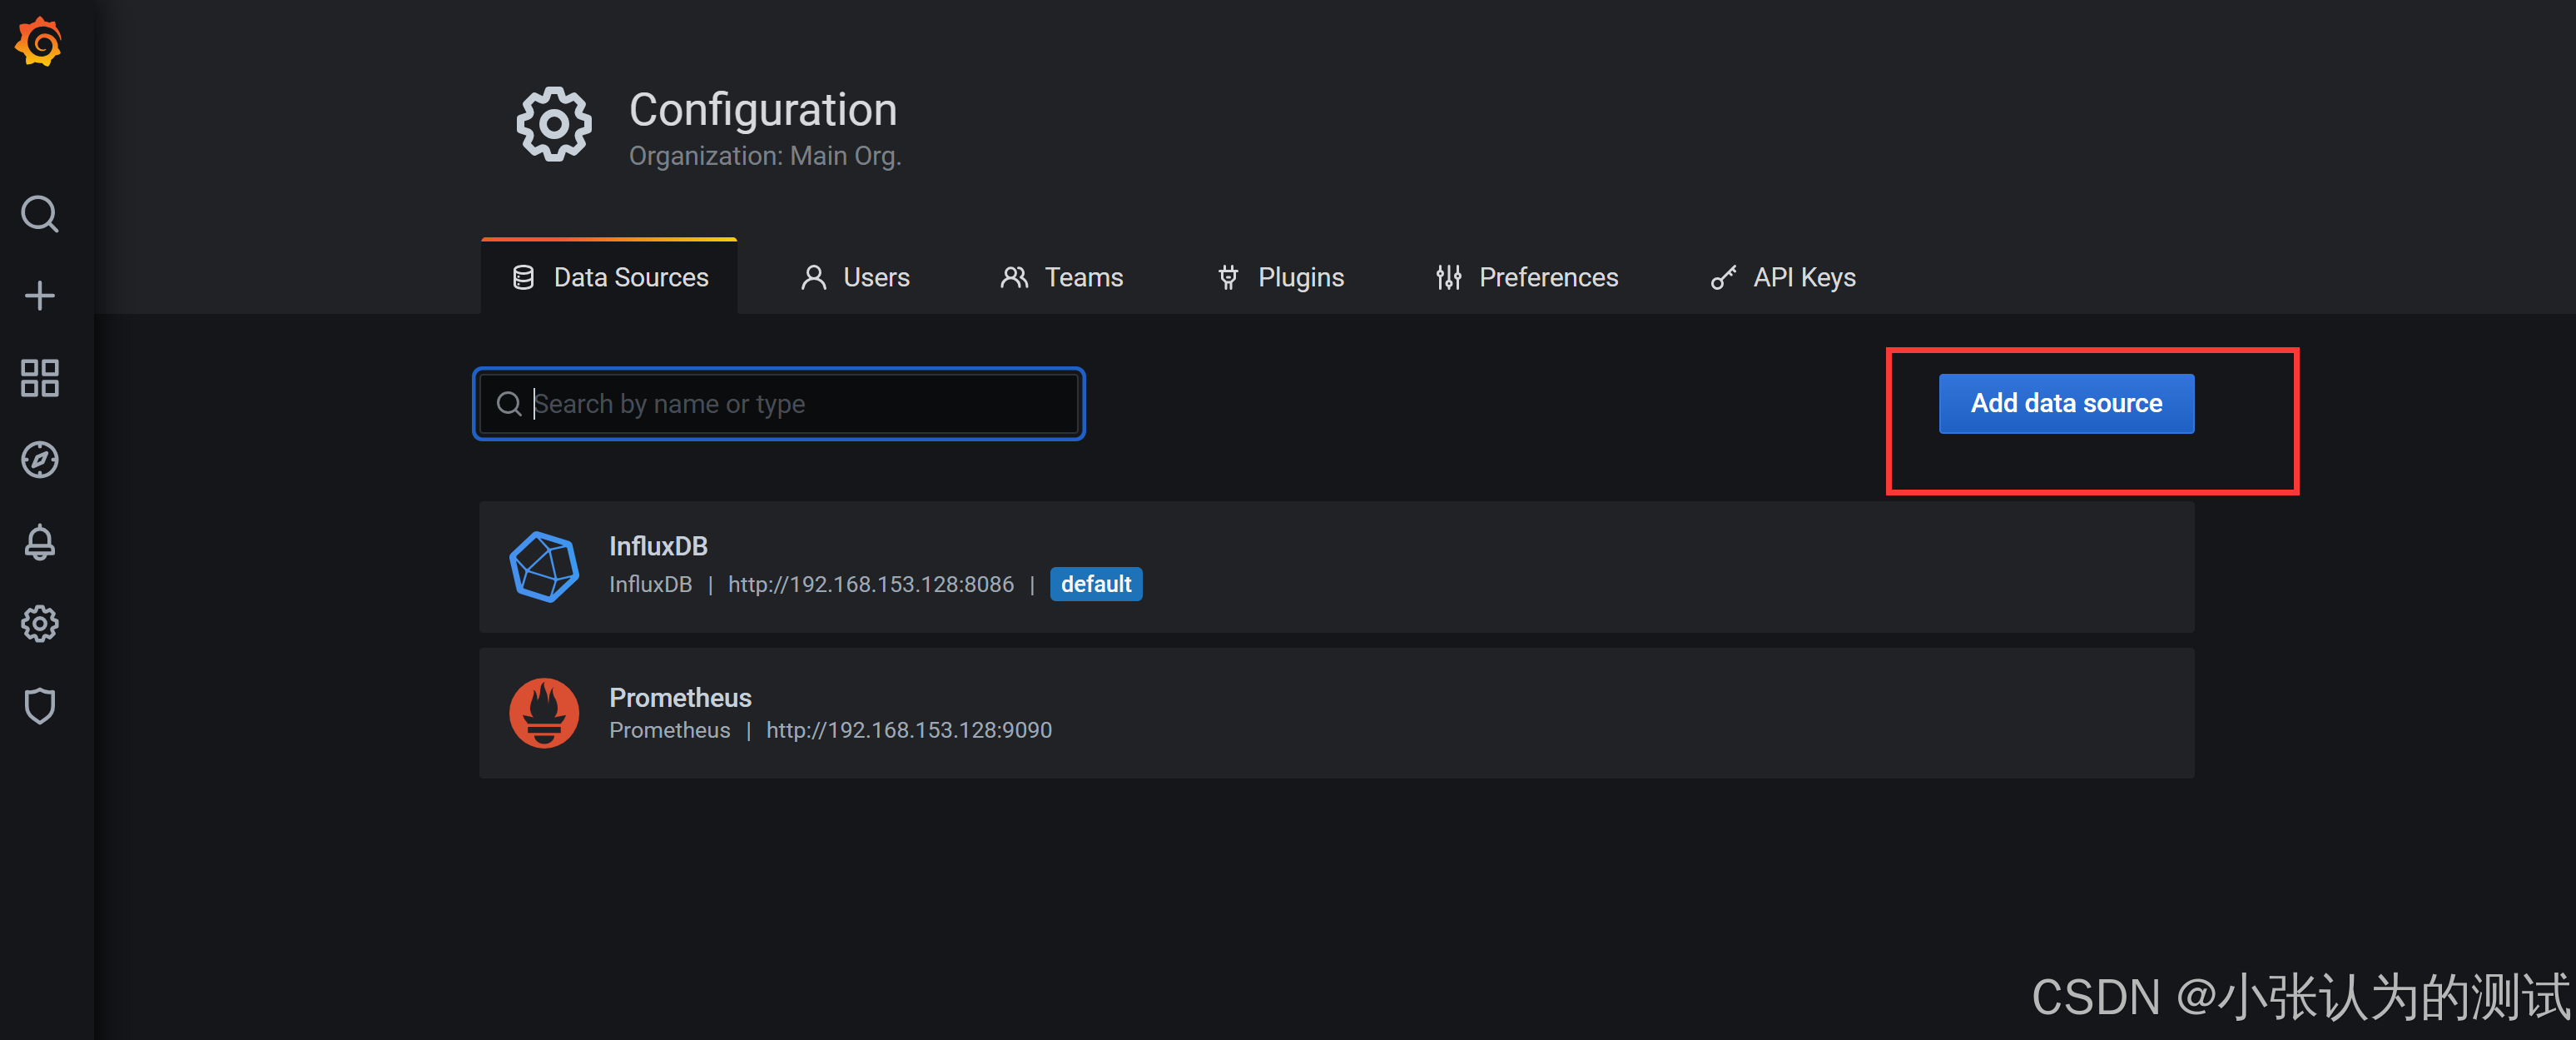
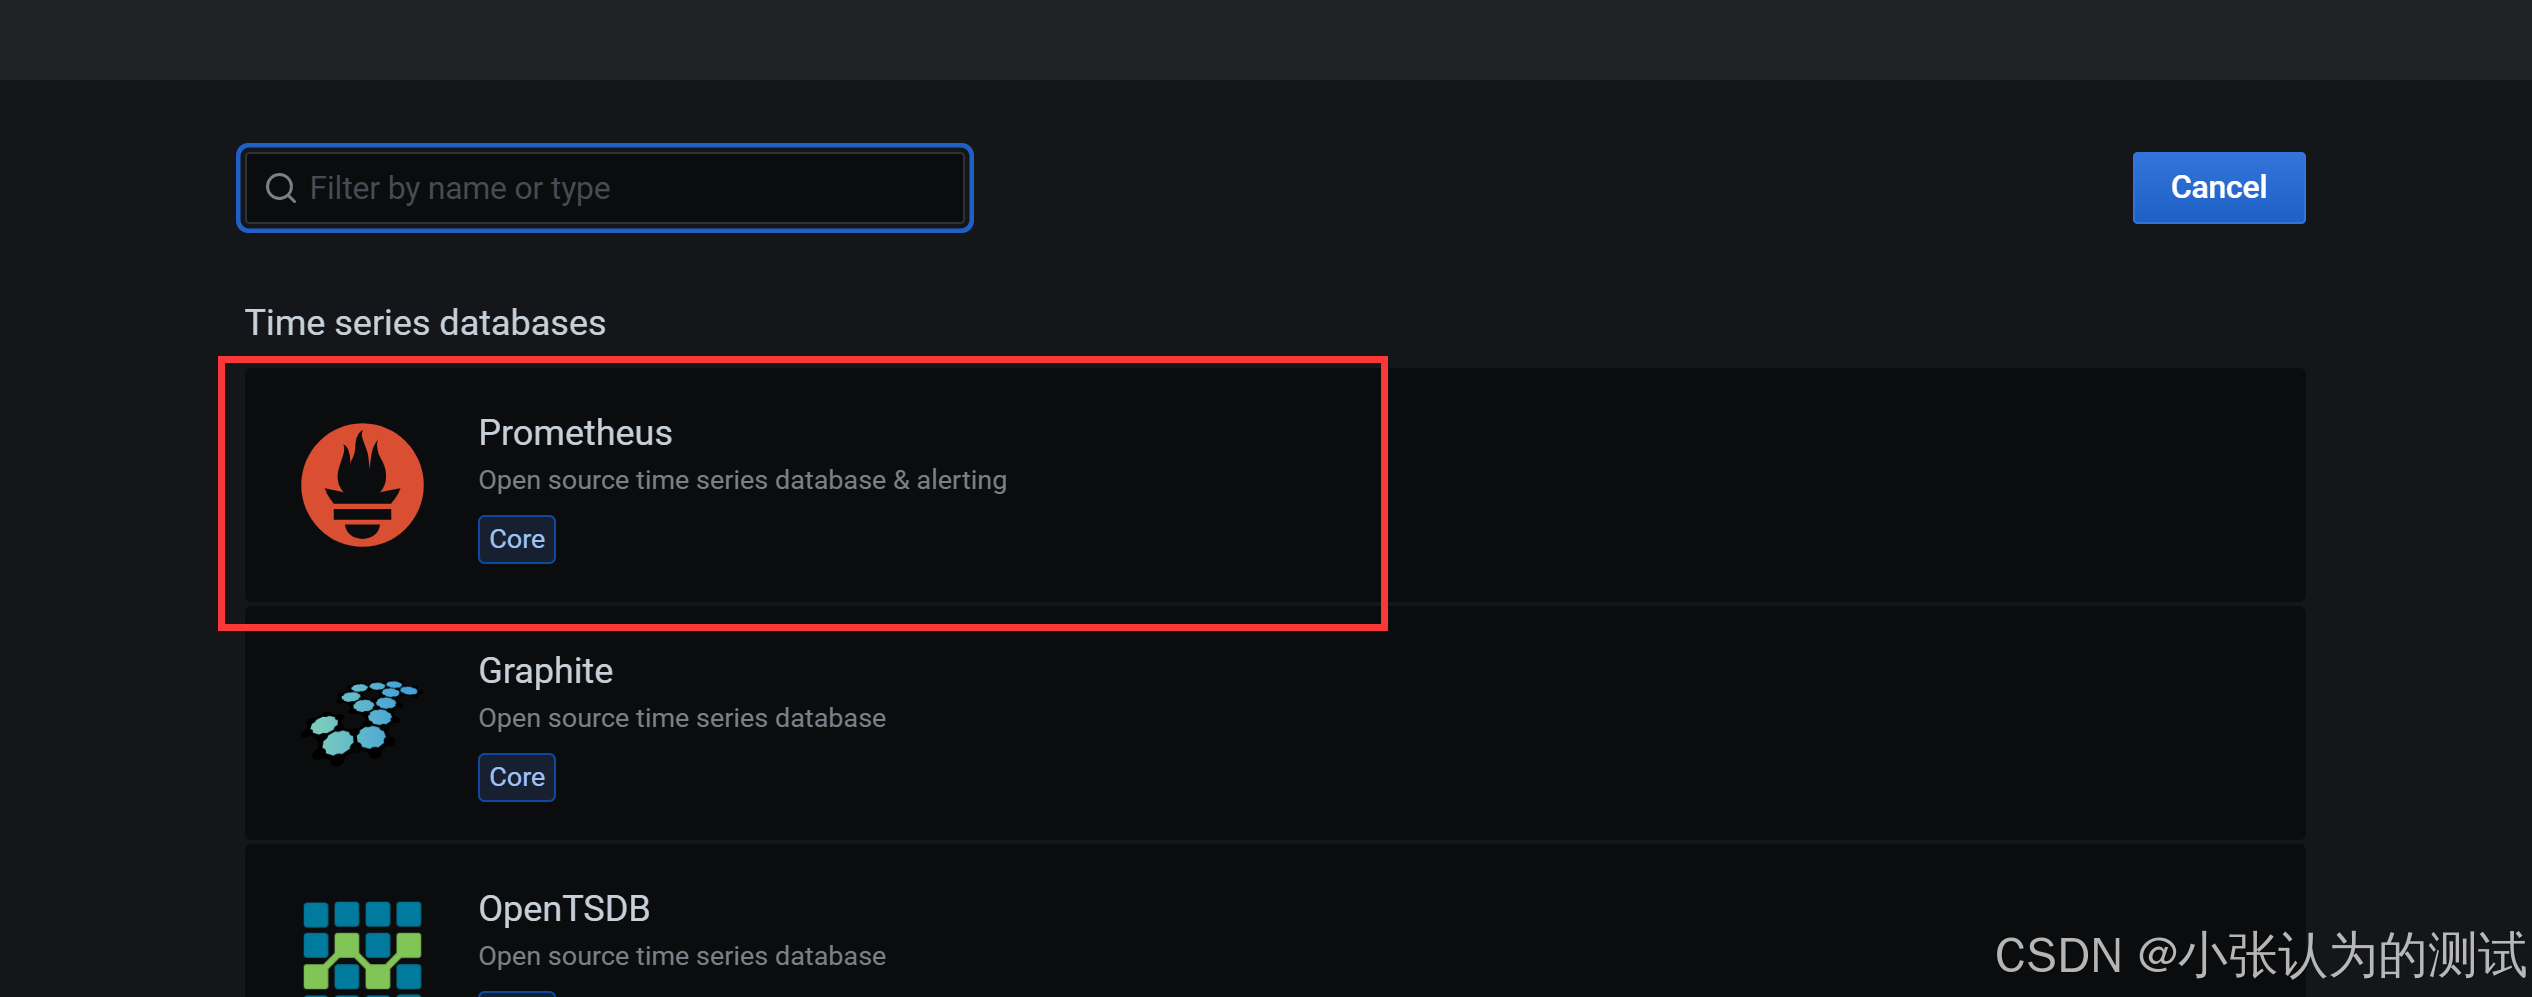
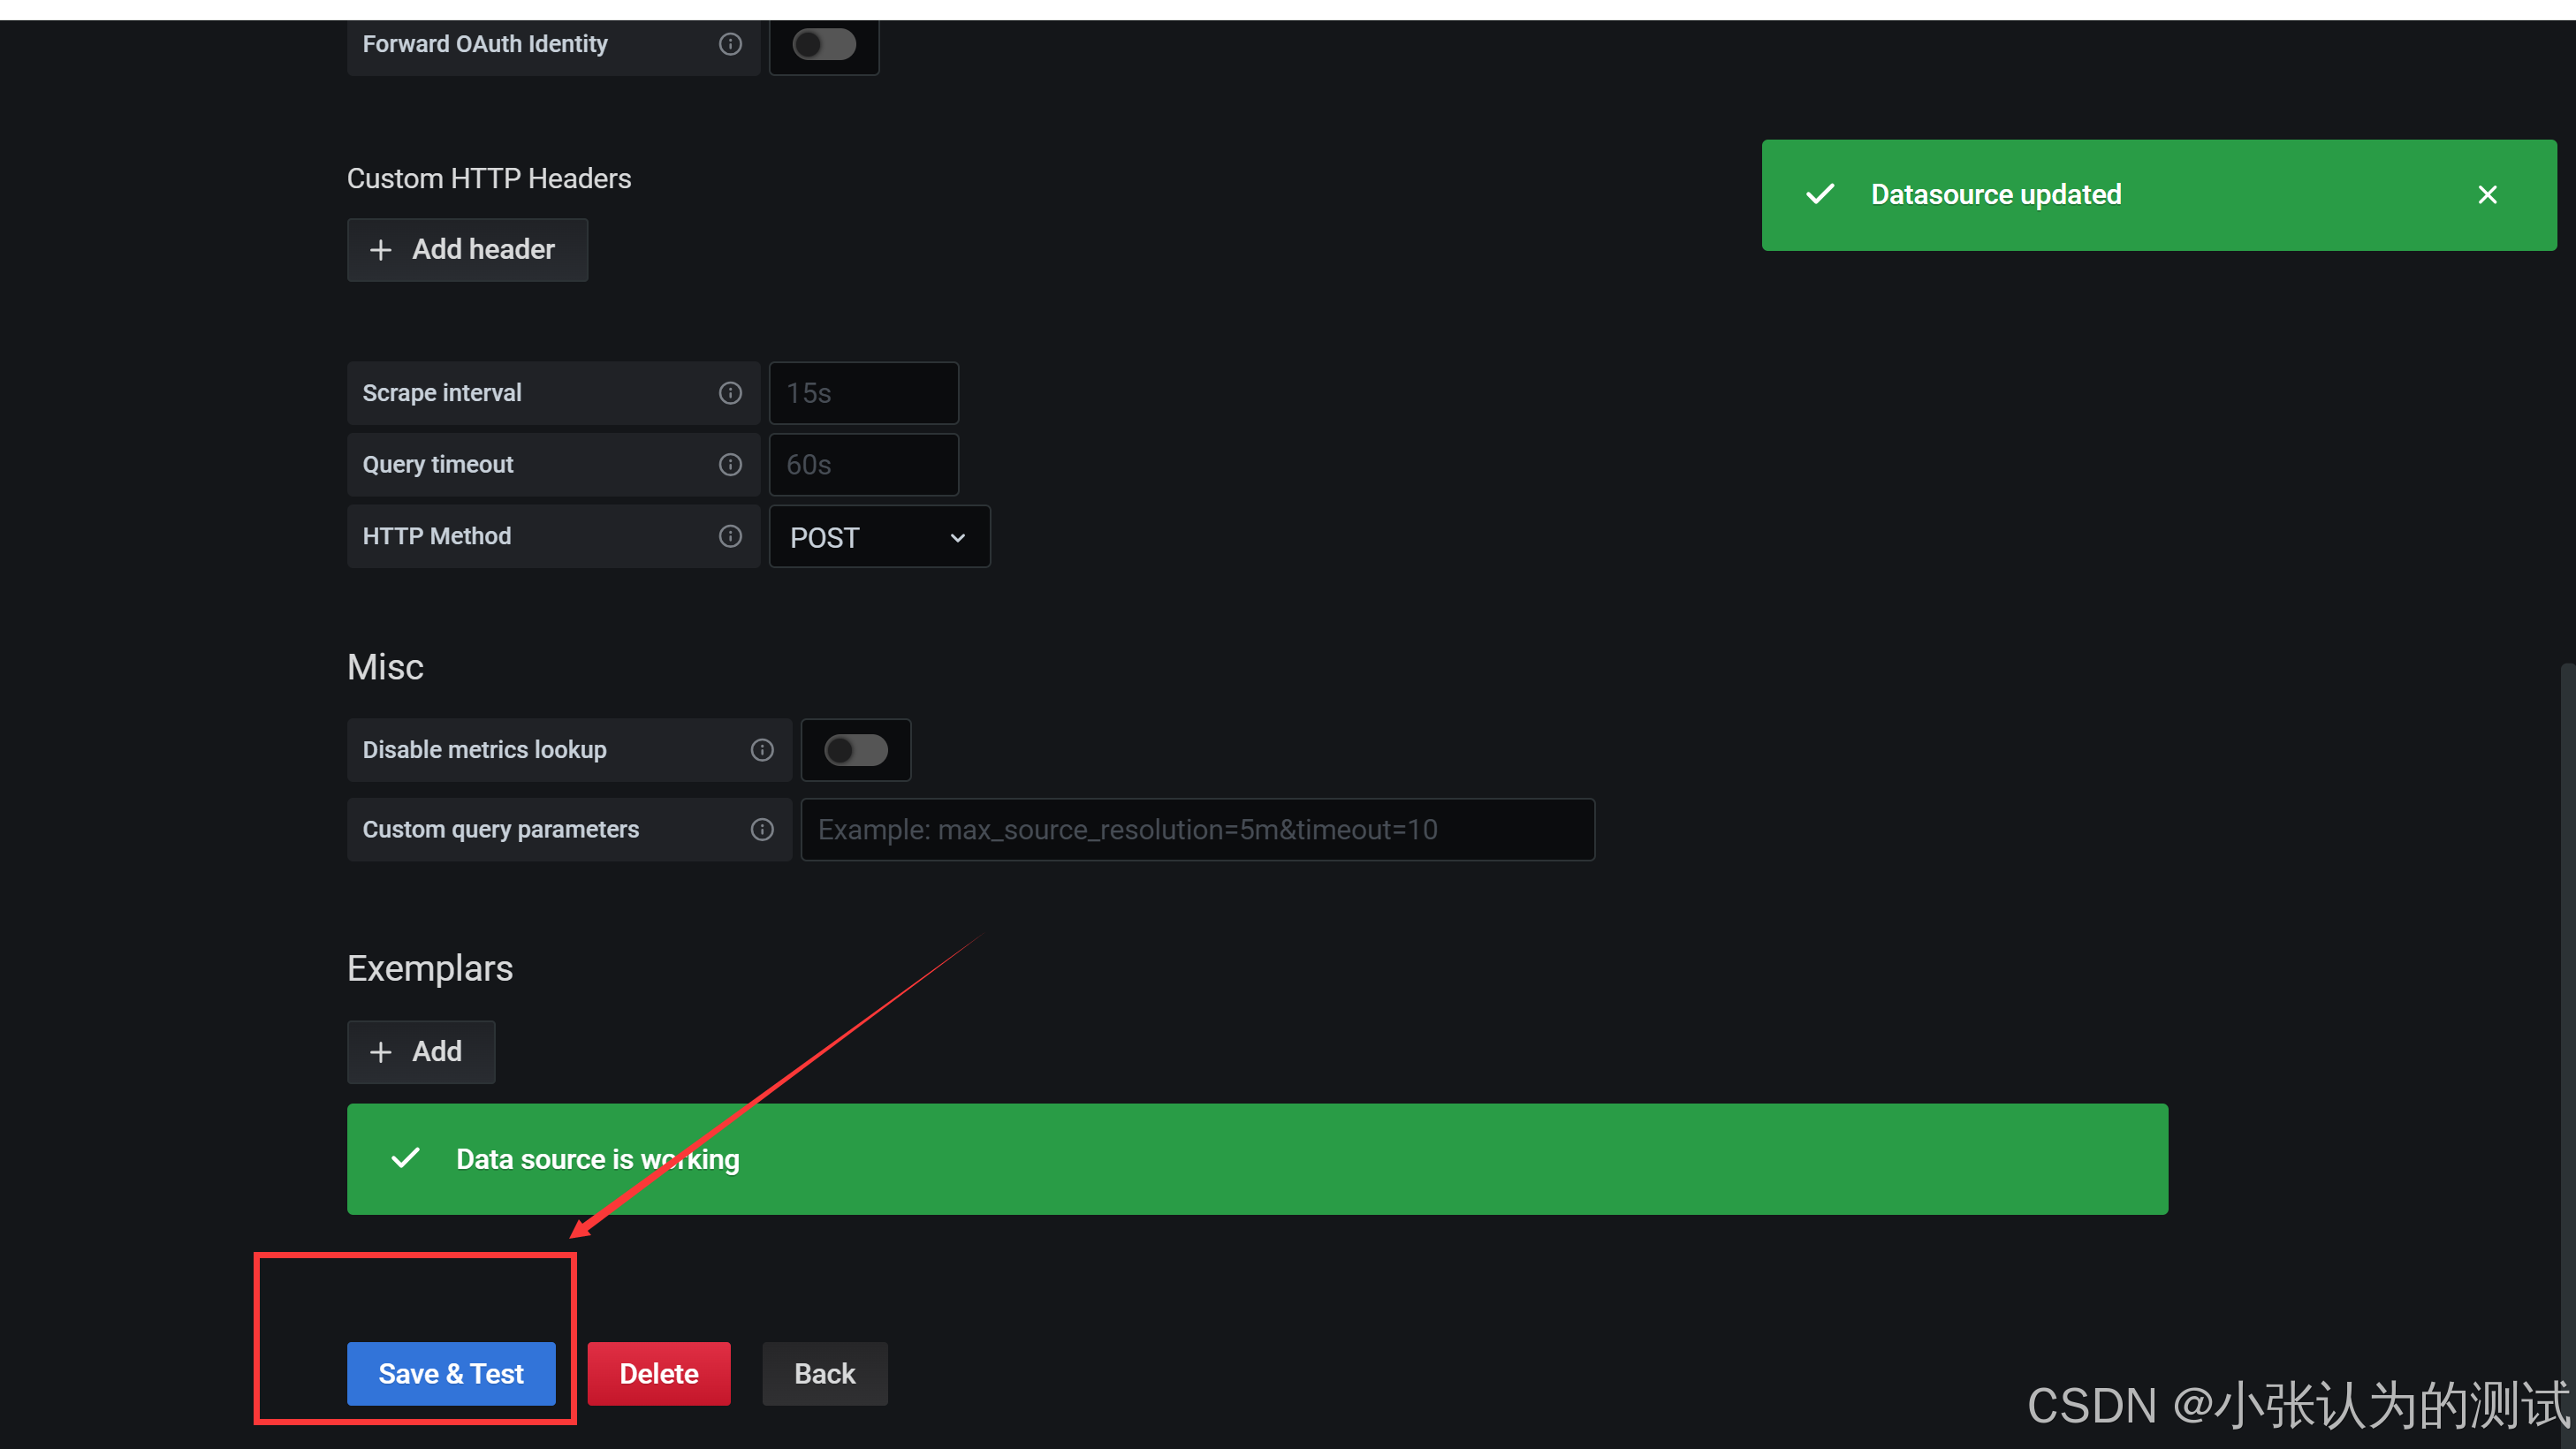
在grafana上配置 prometheus

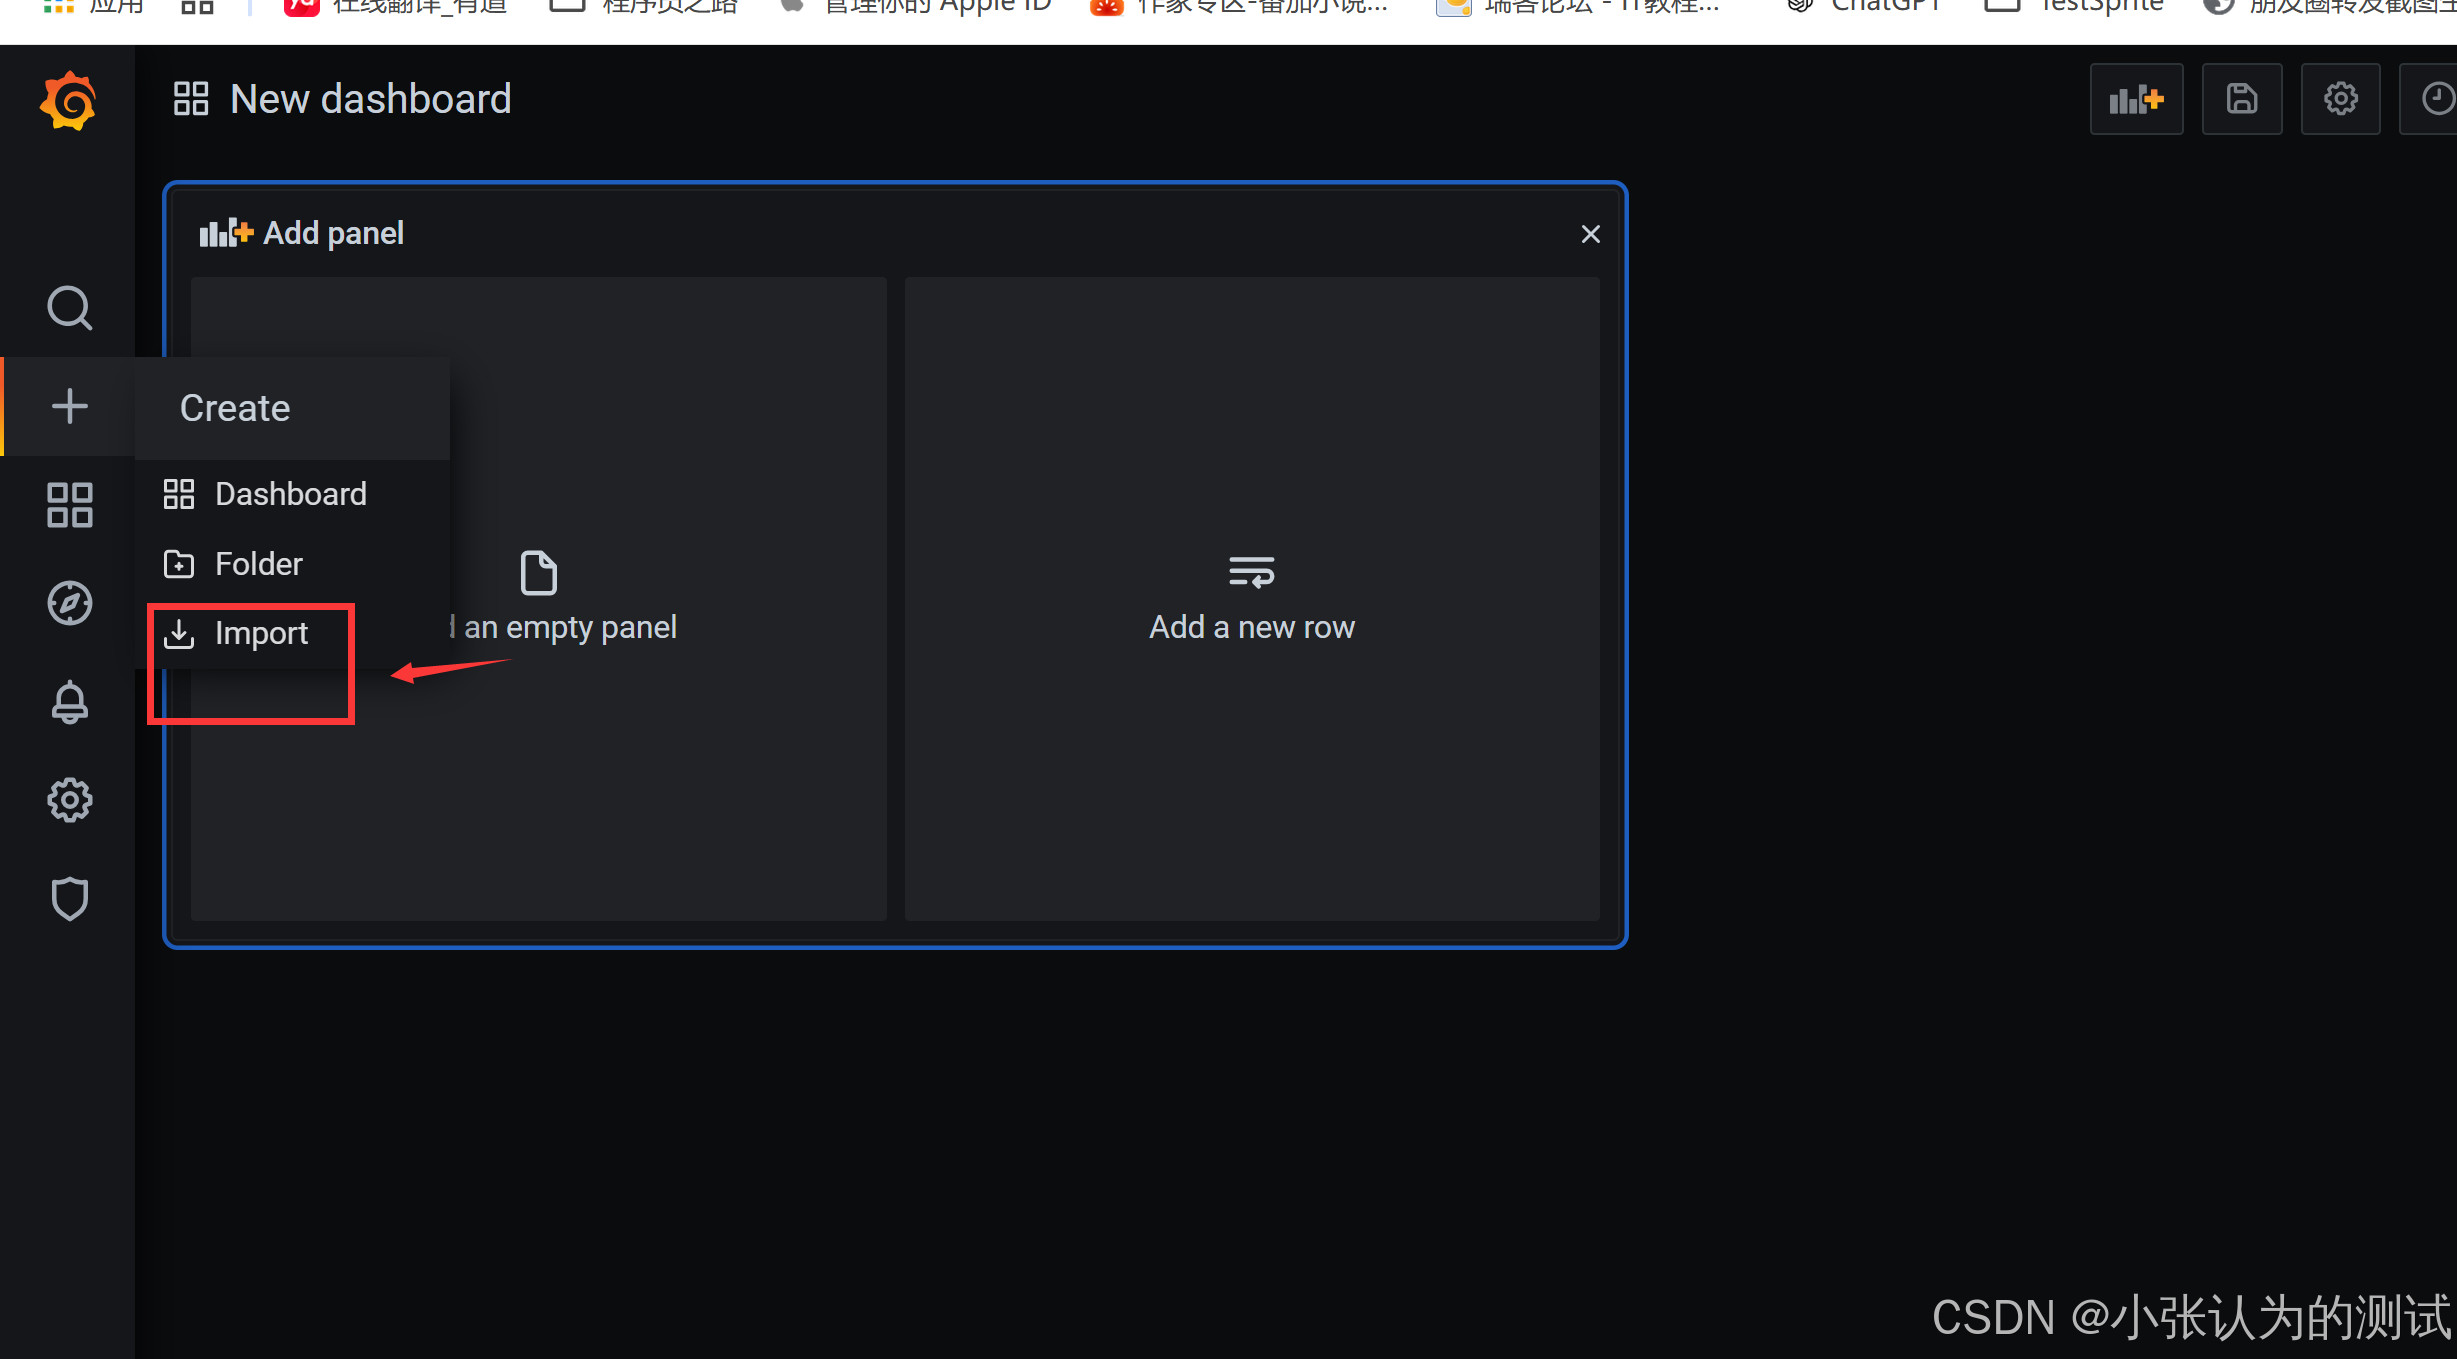
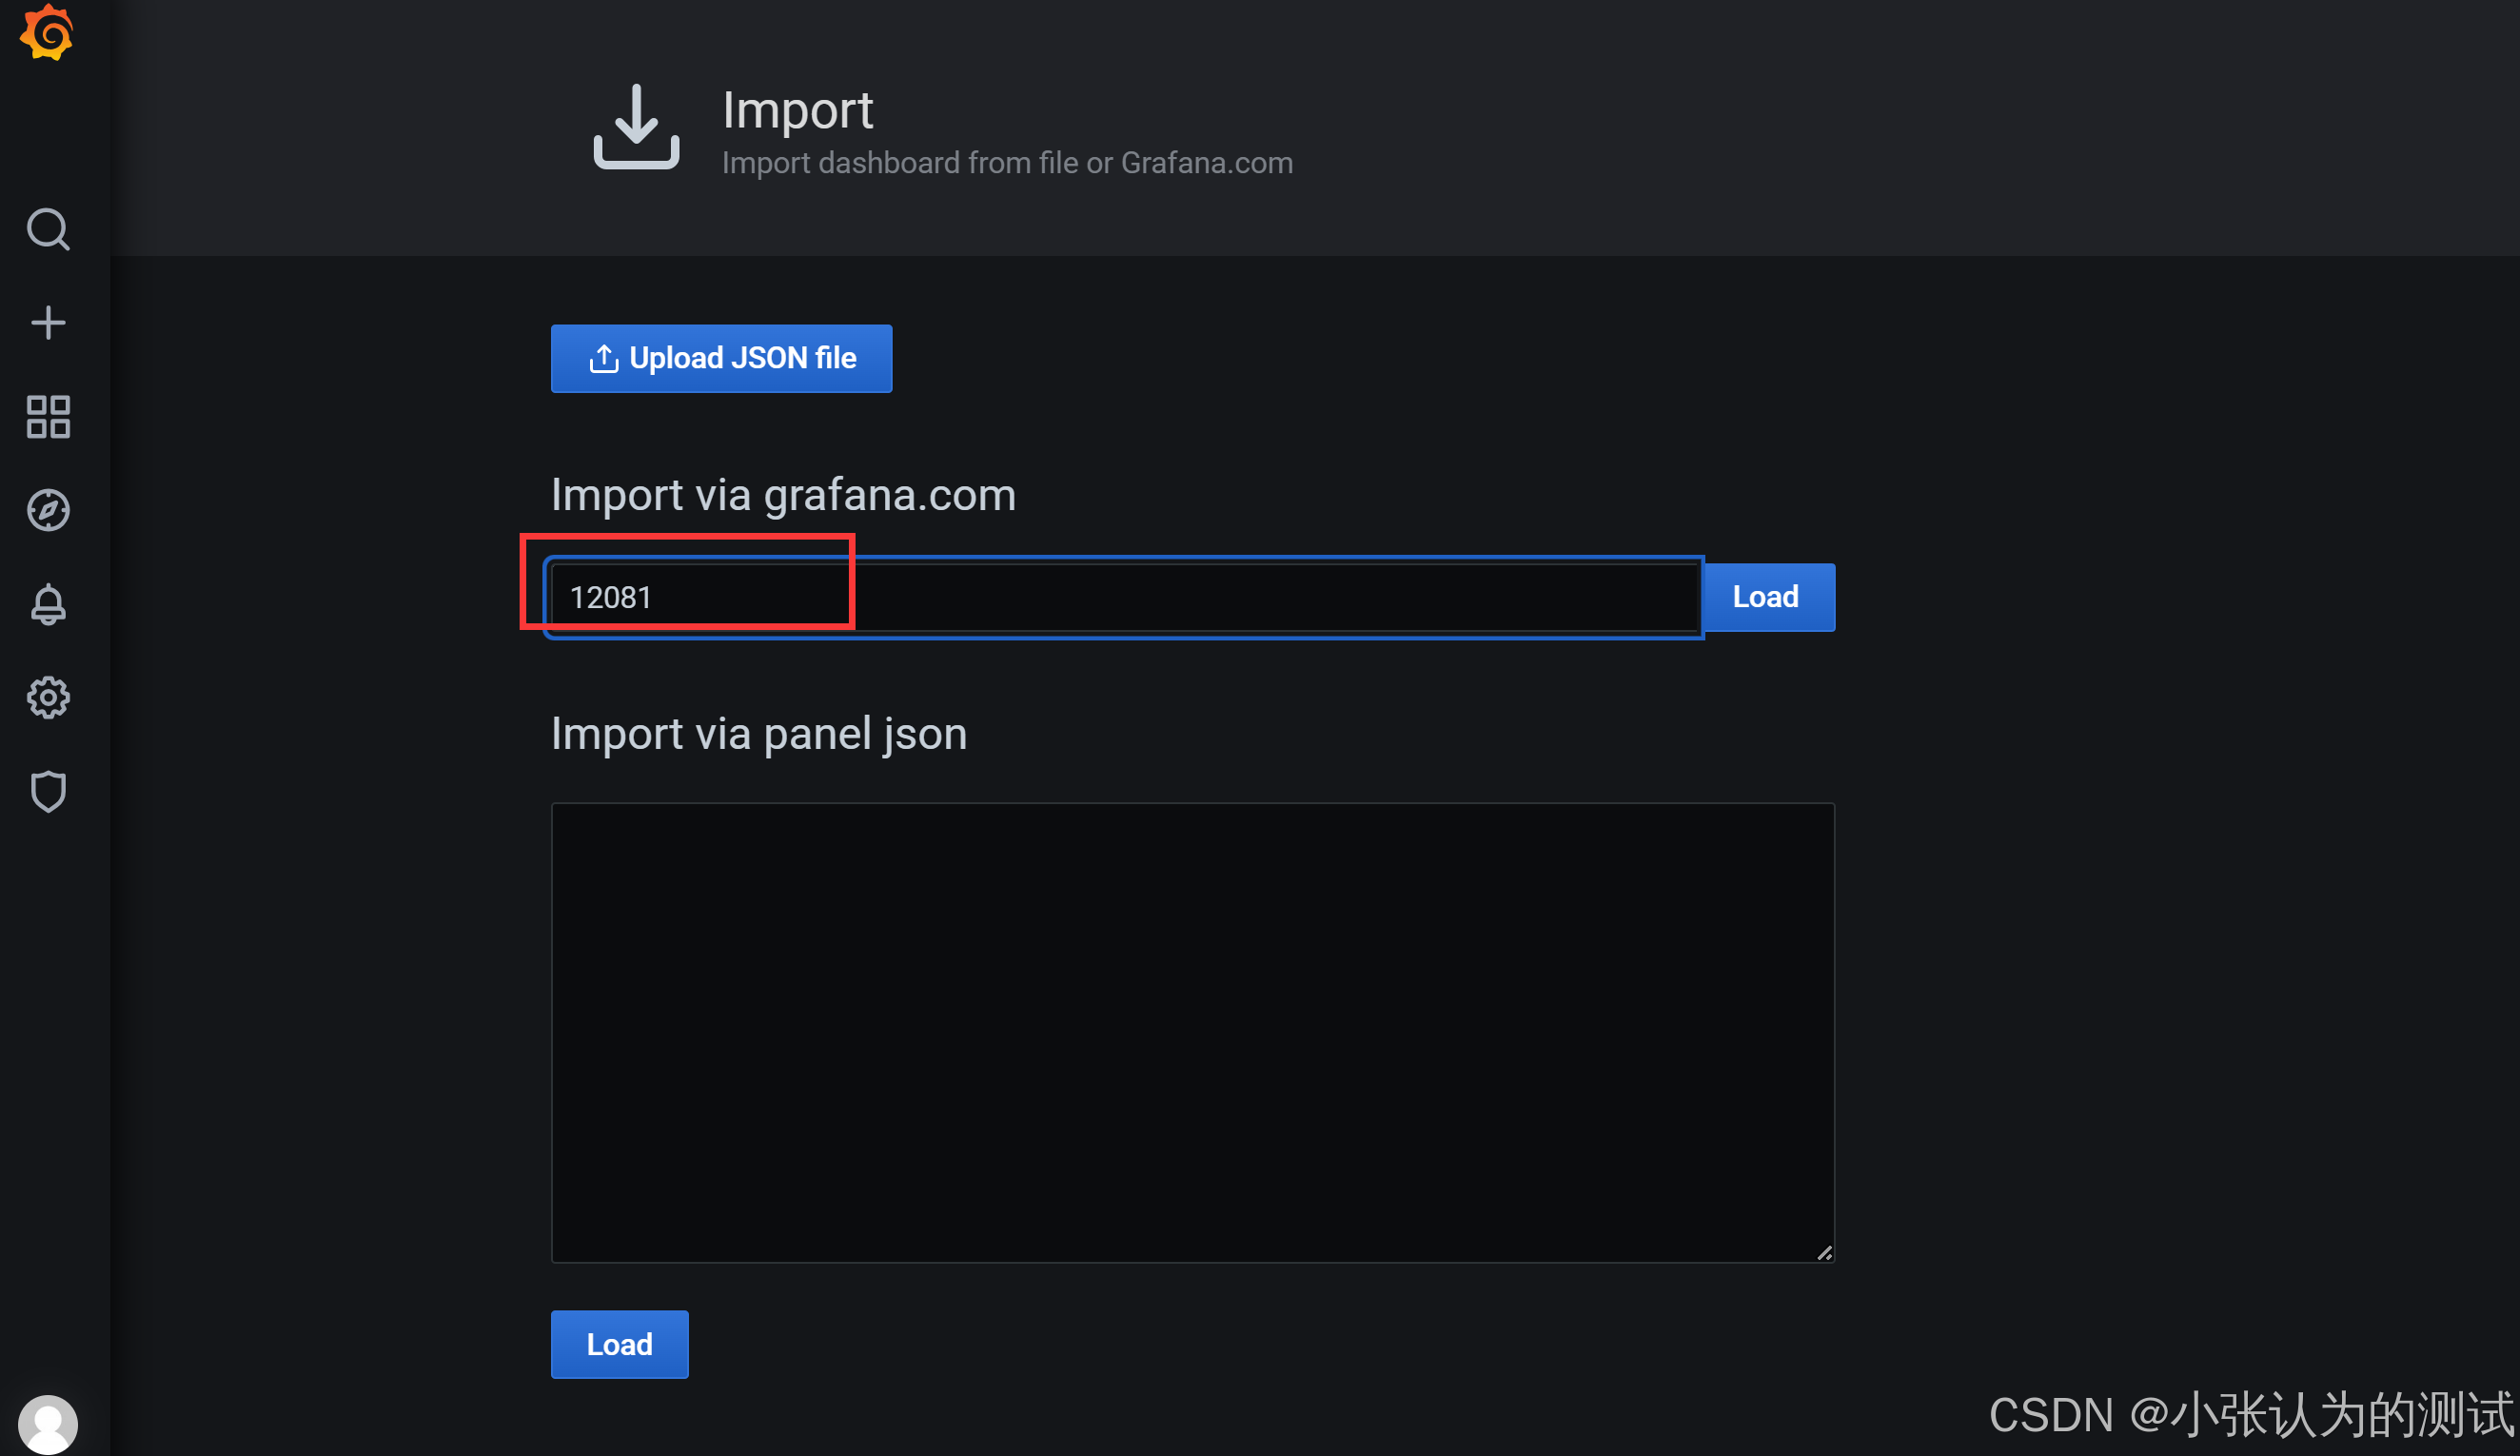
导入locust监控大屏看板
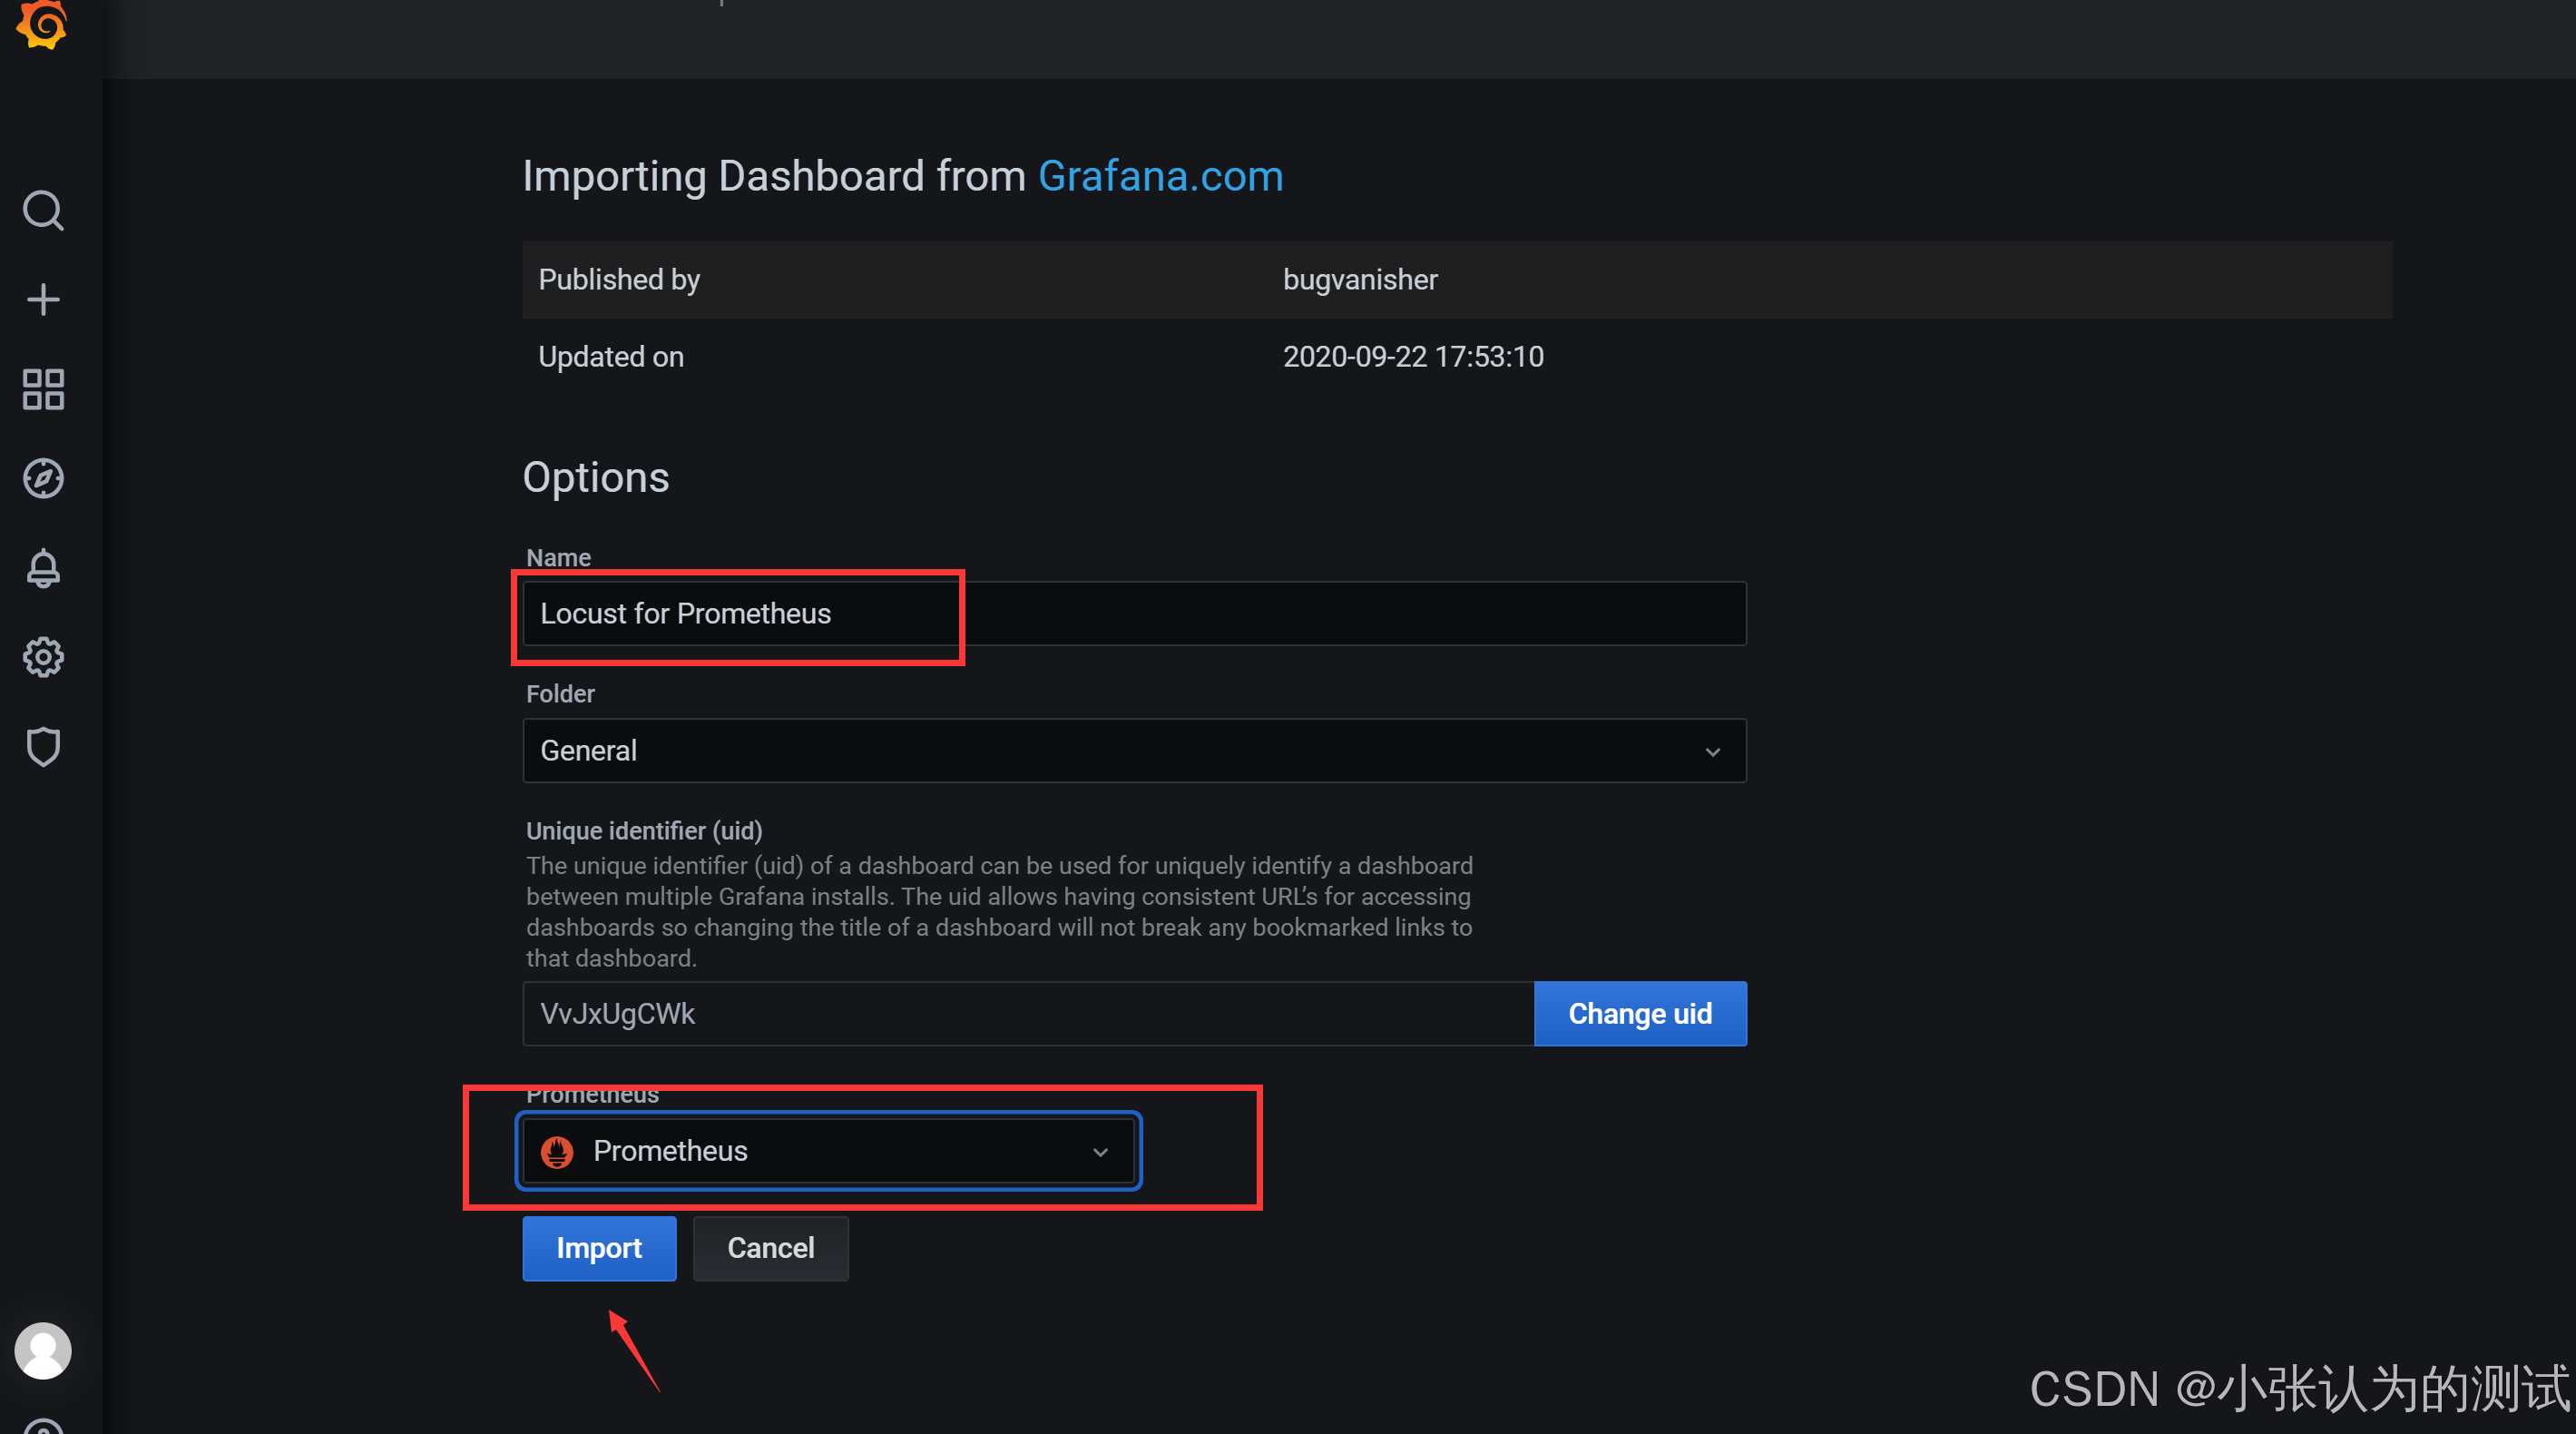
配置数据
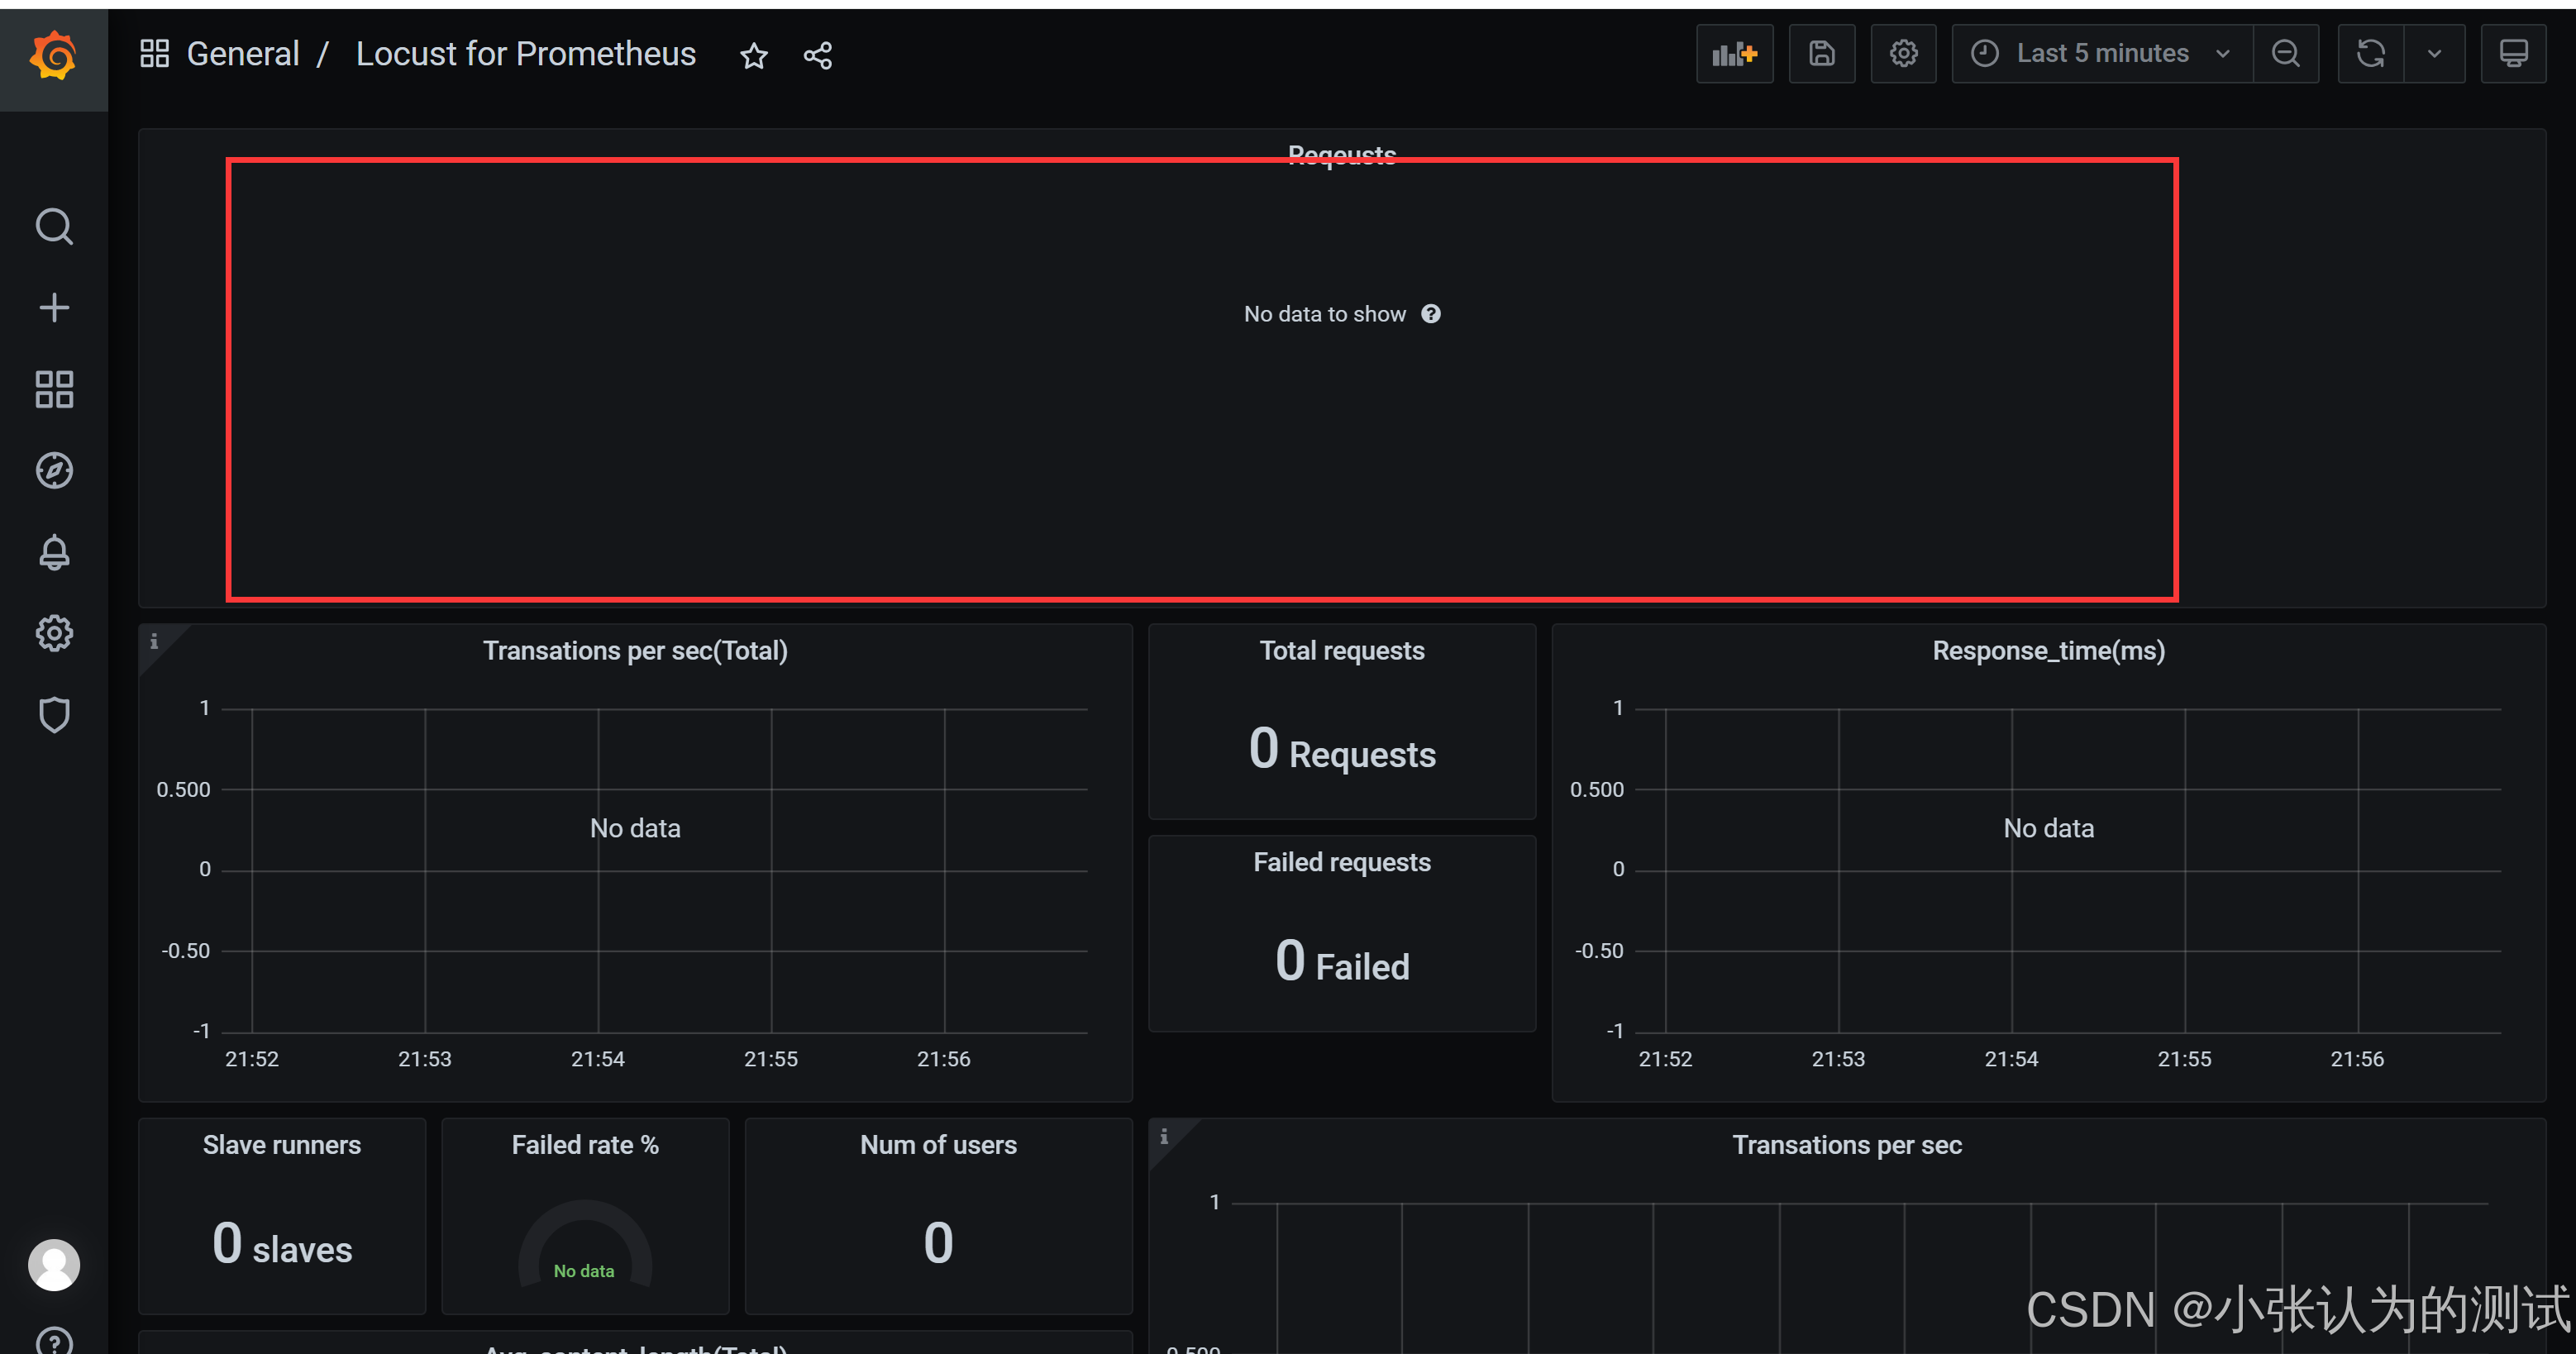
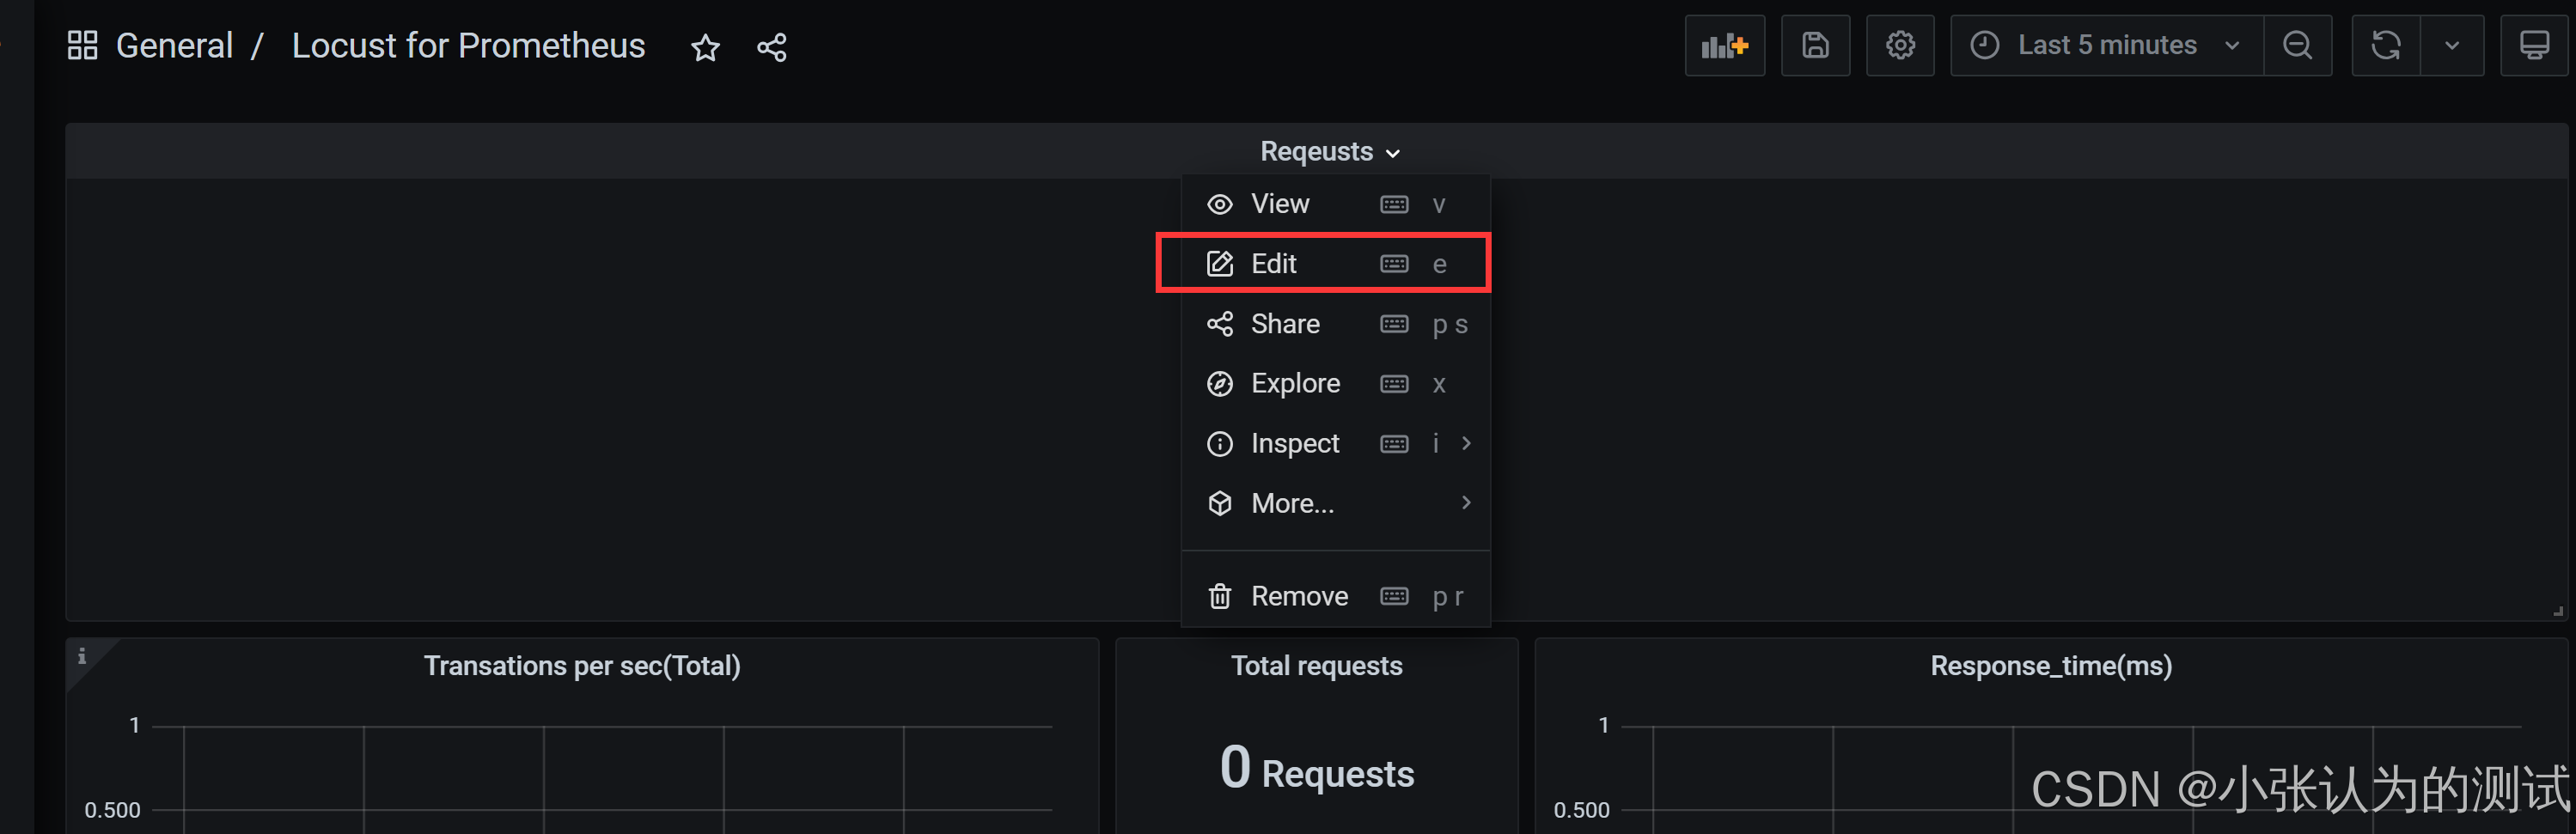
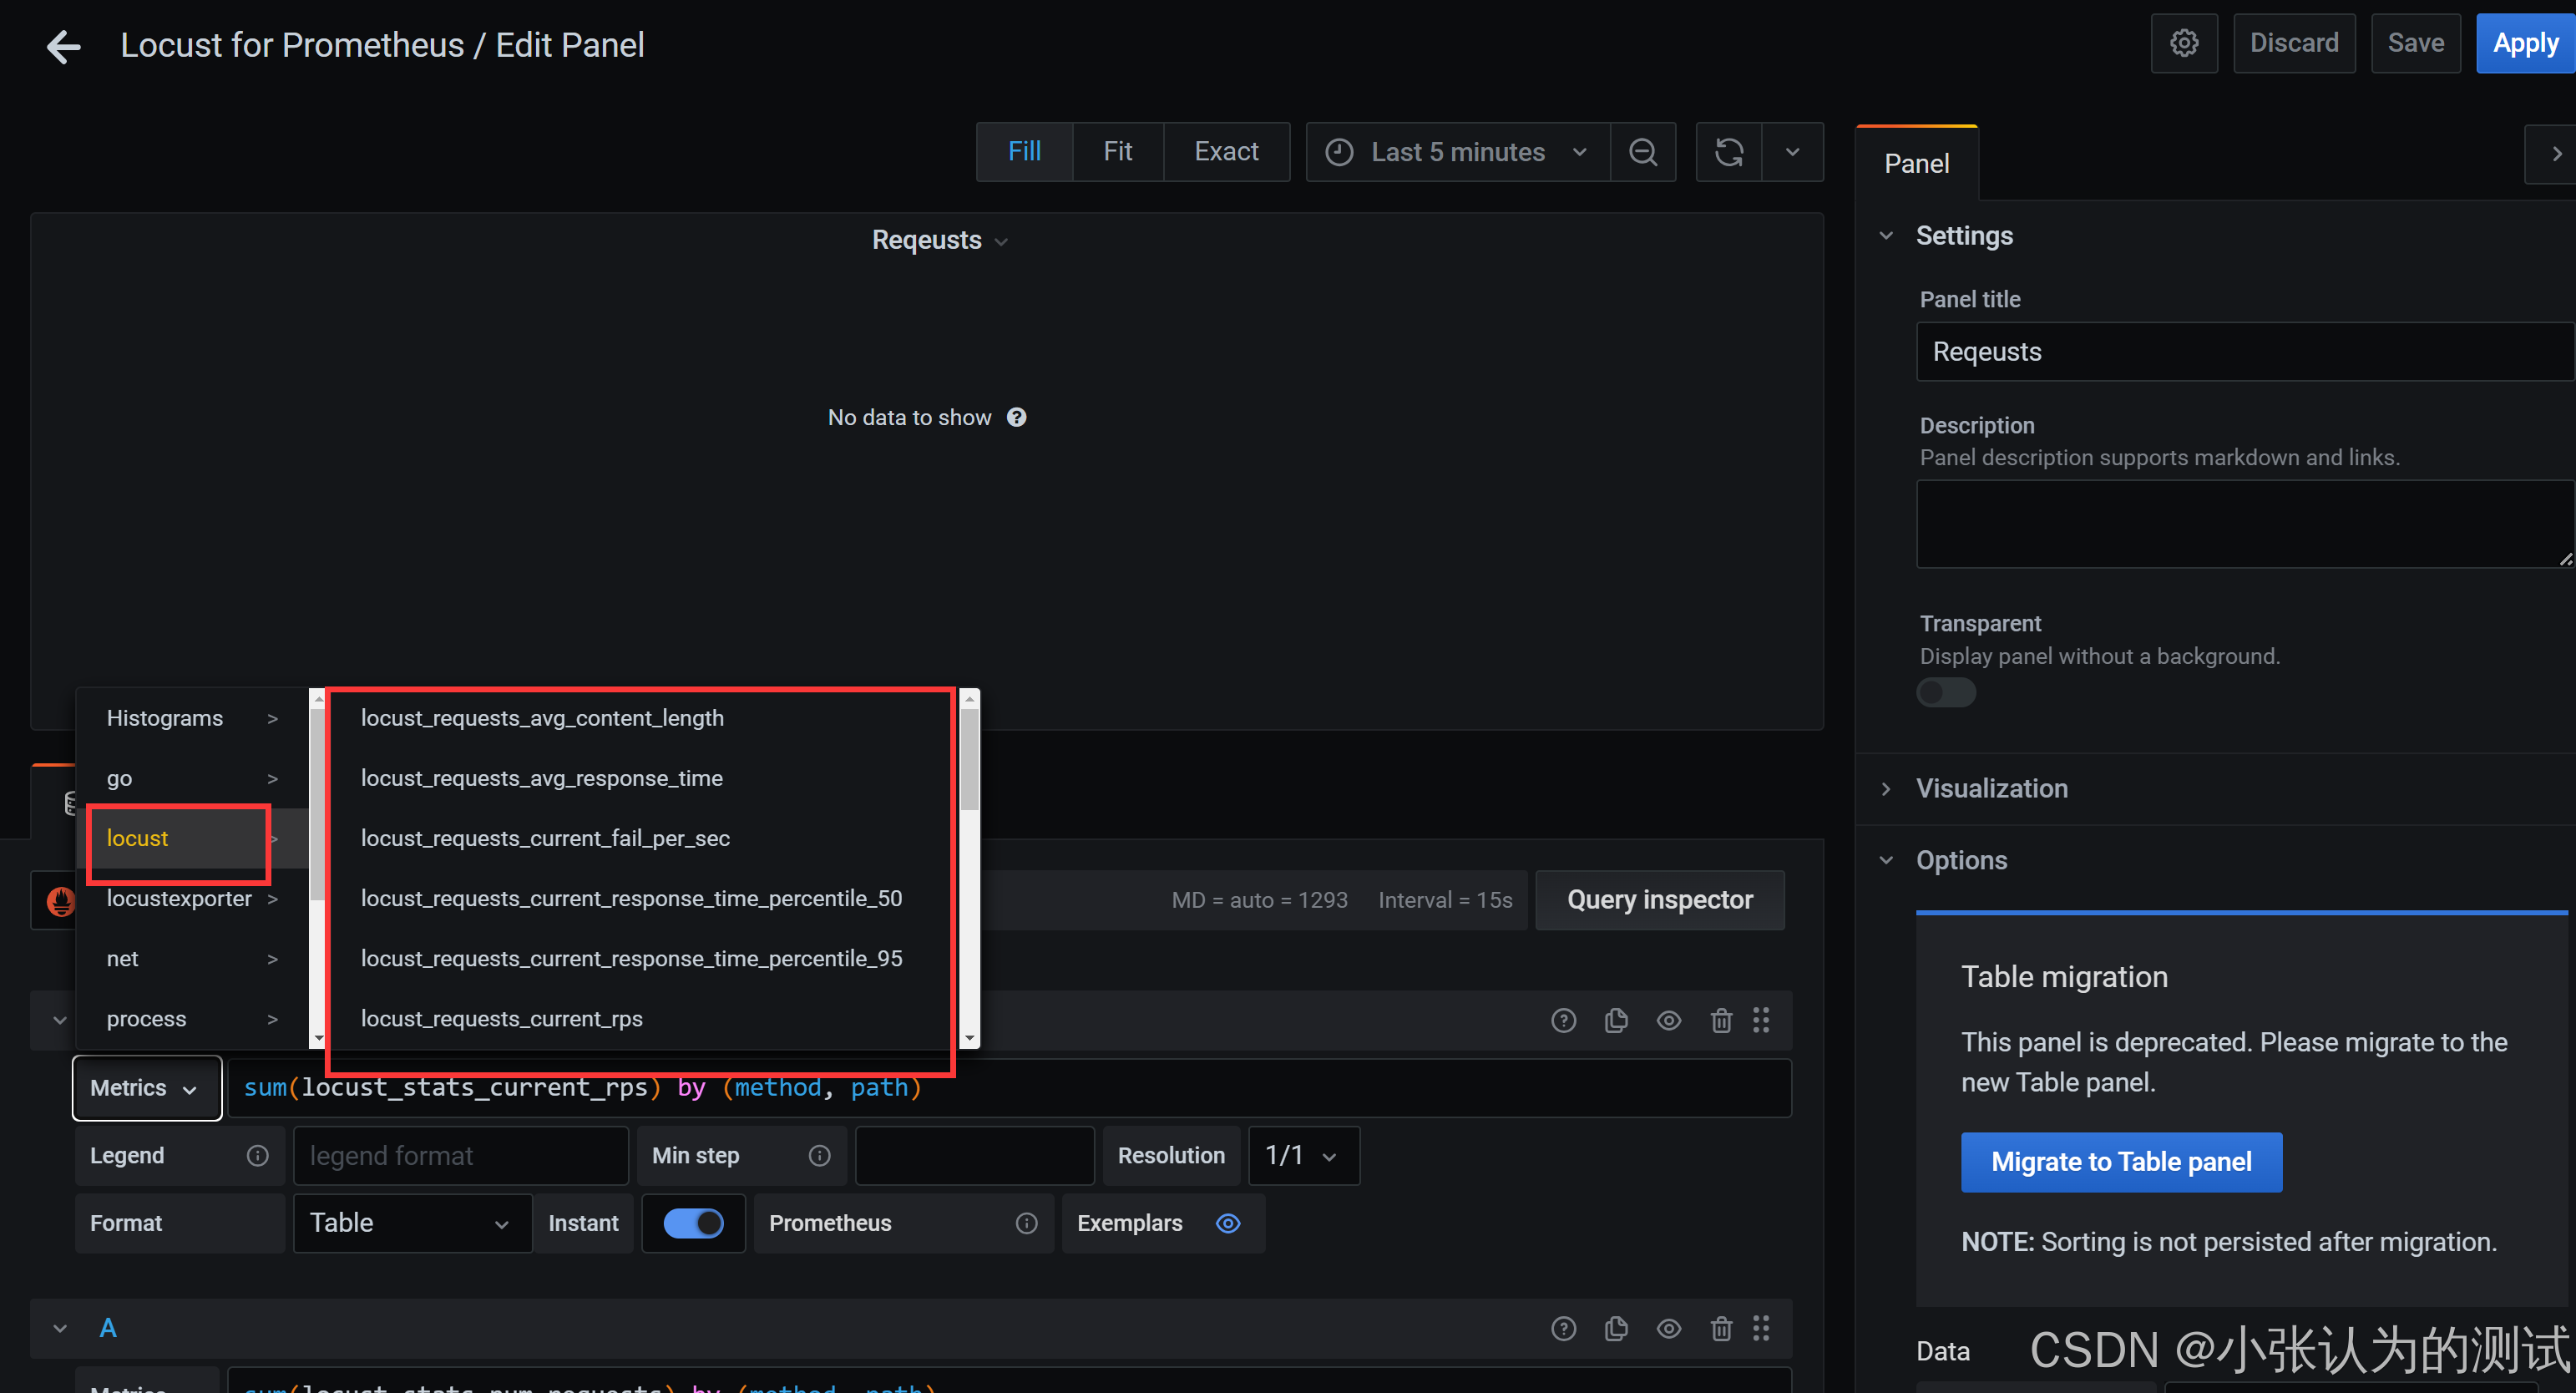
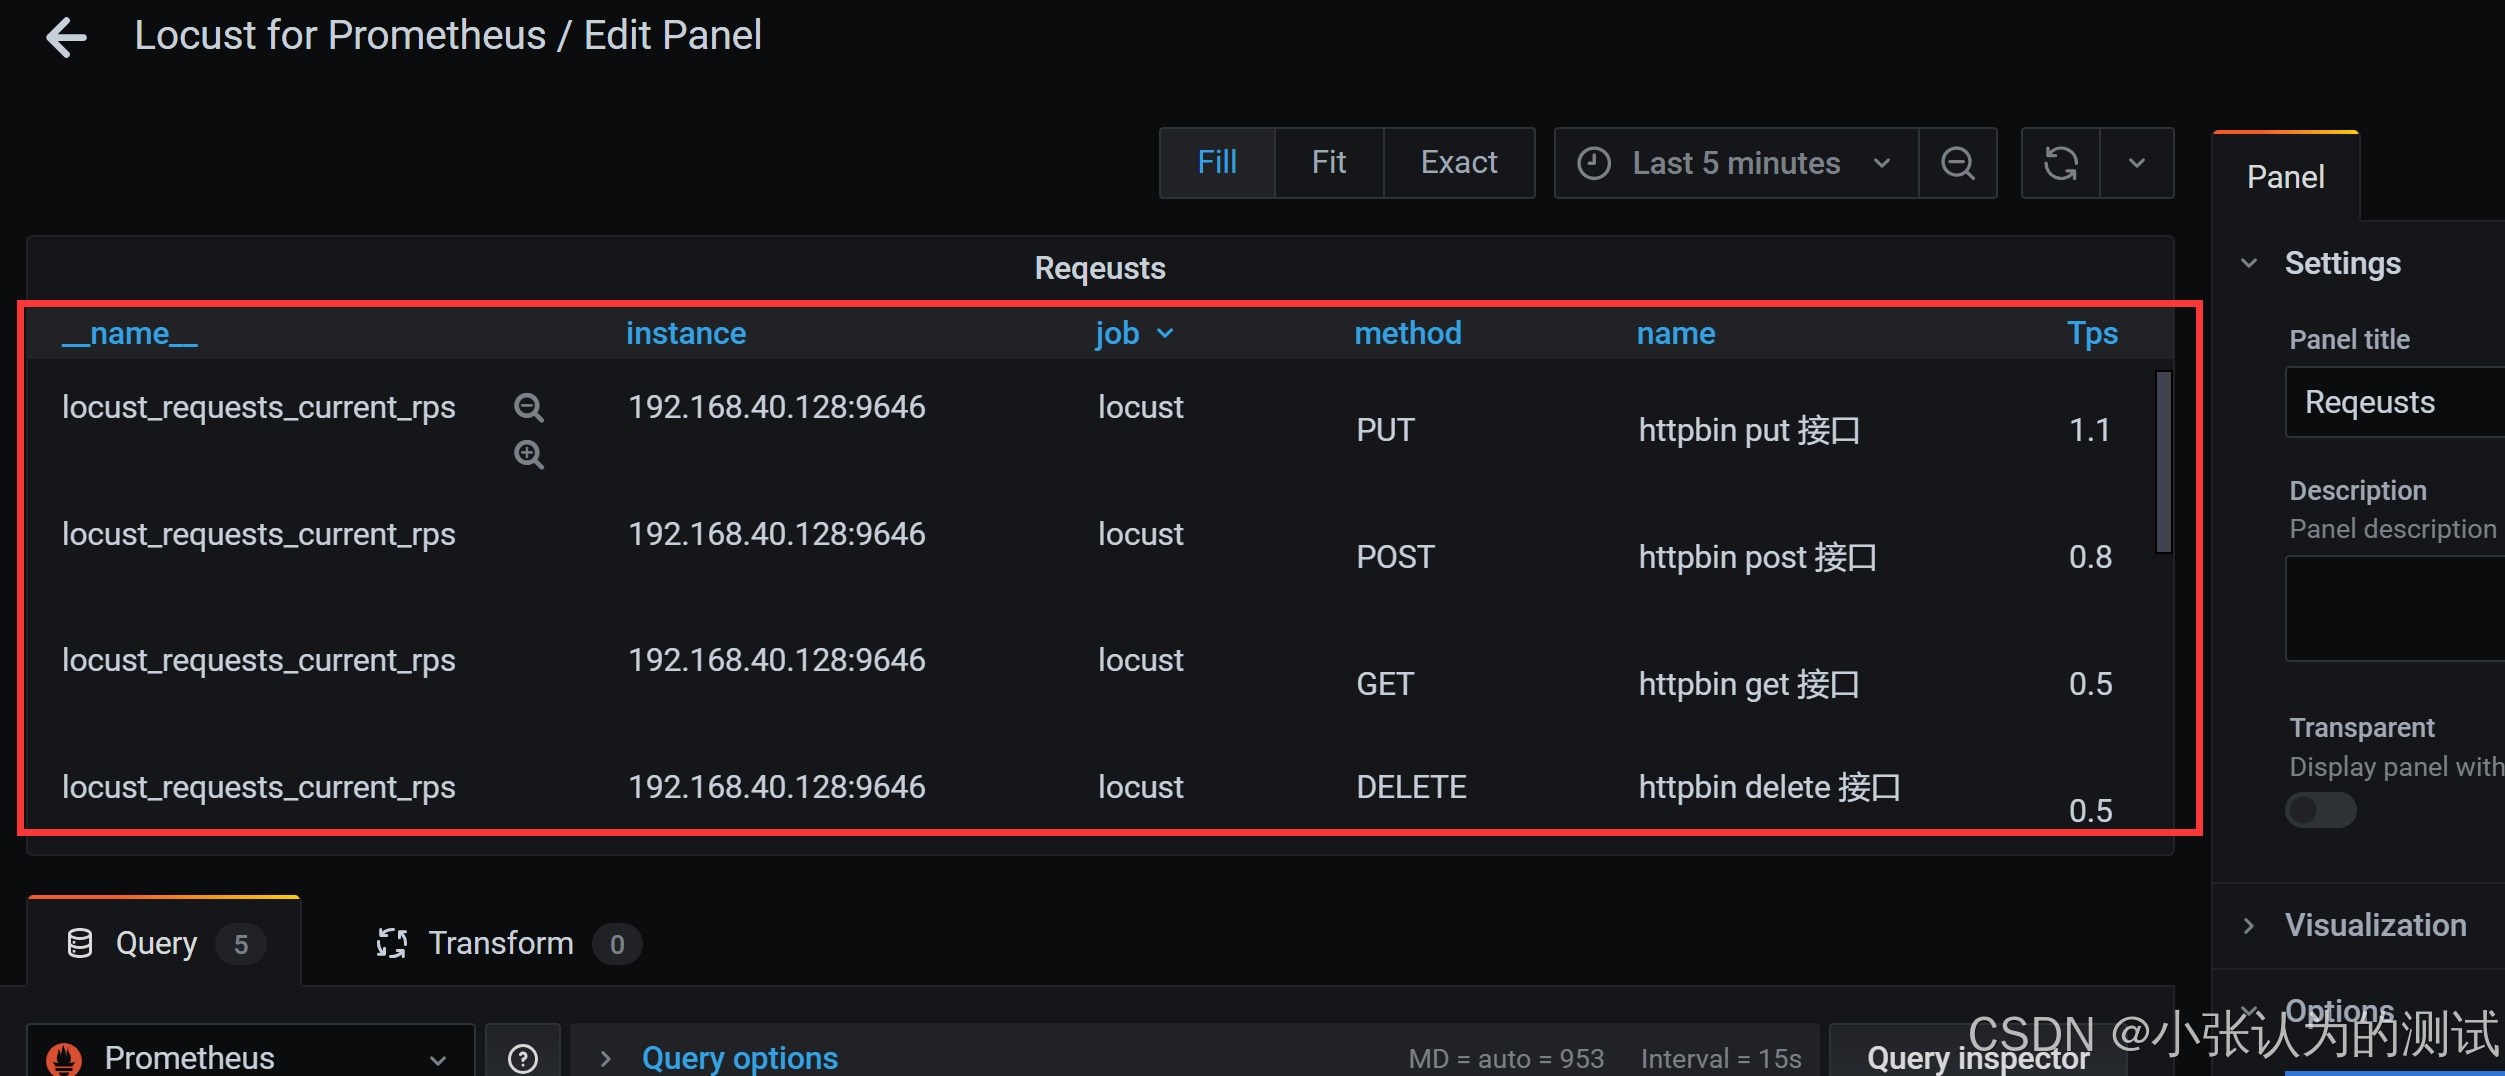
最后我们看是没有数据的,别急,你可能需要手动修改一下
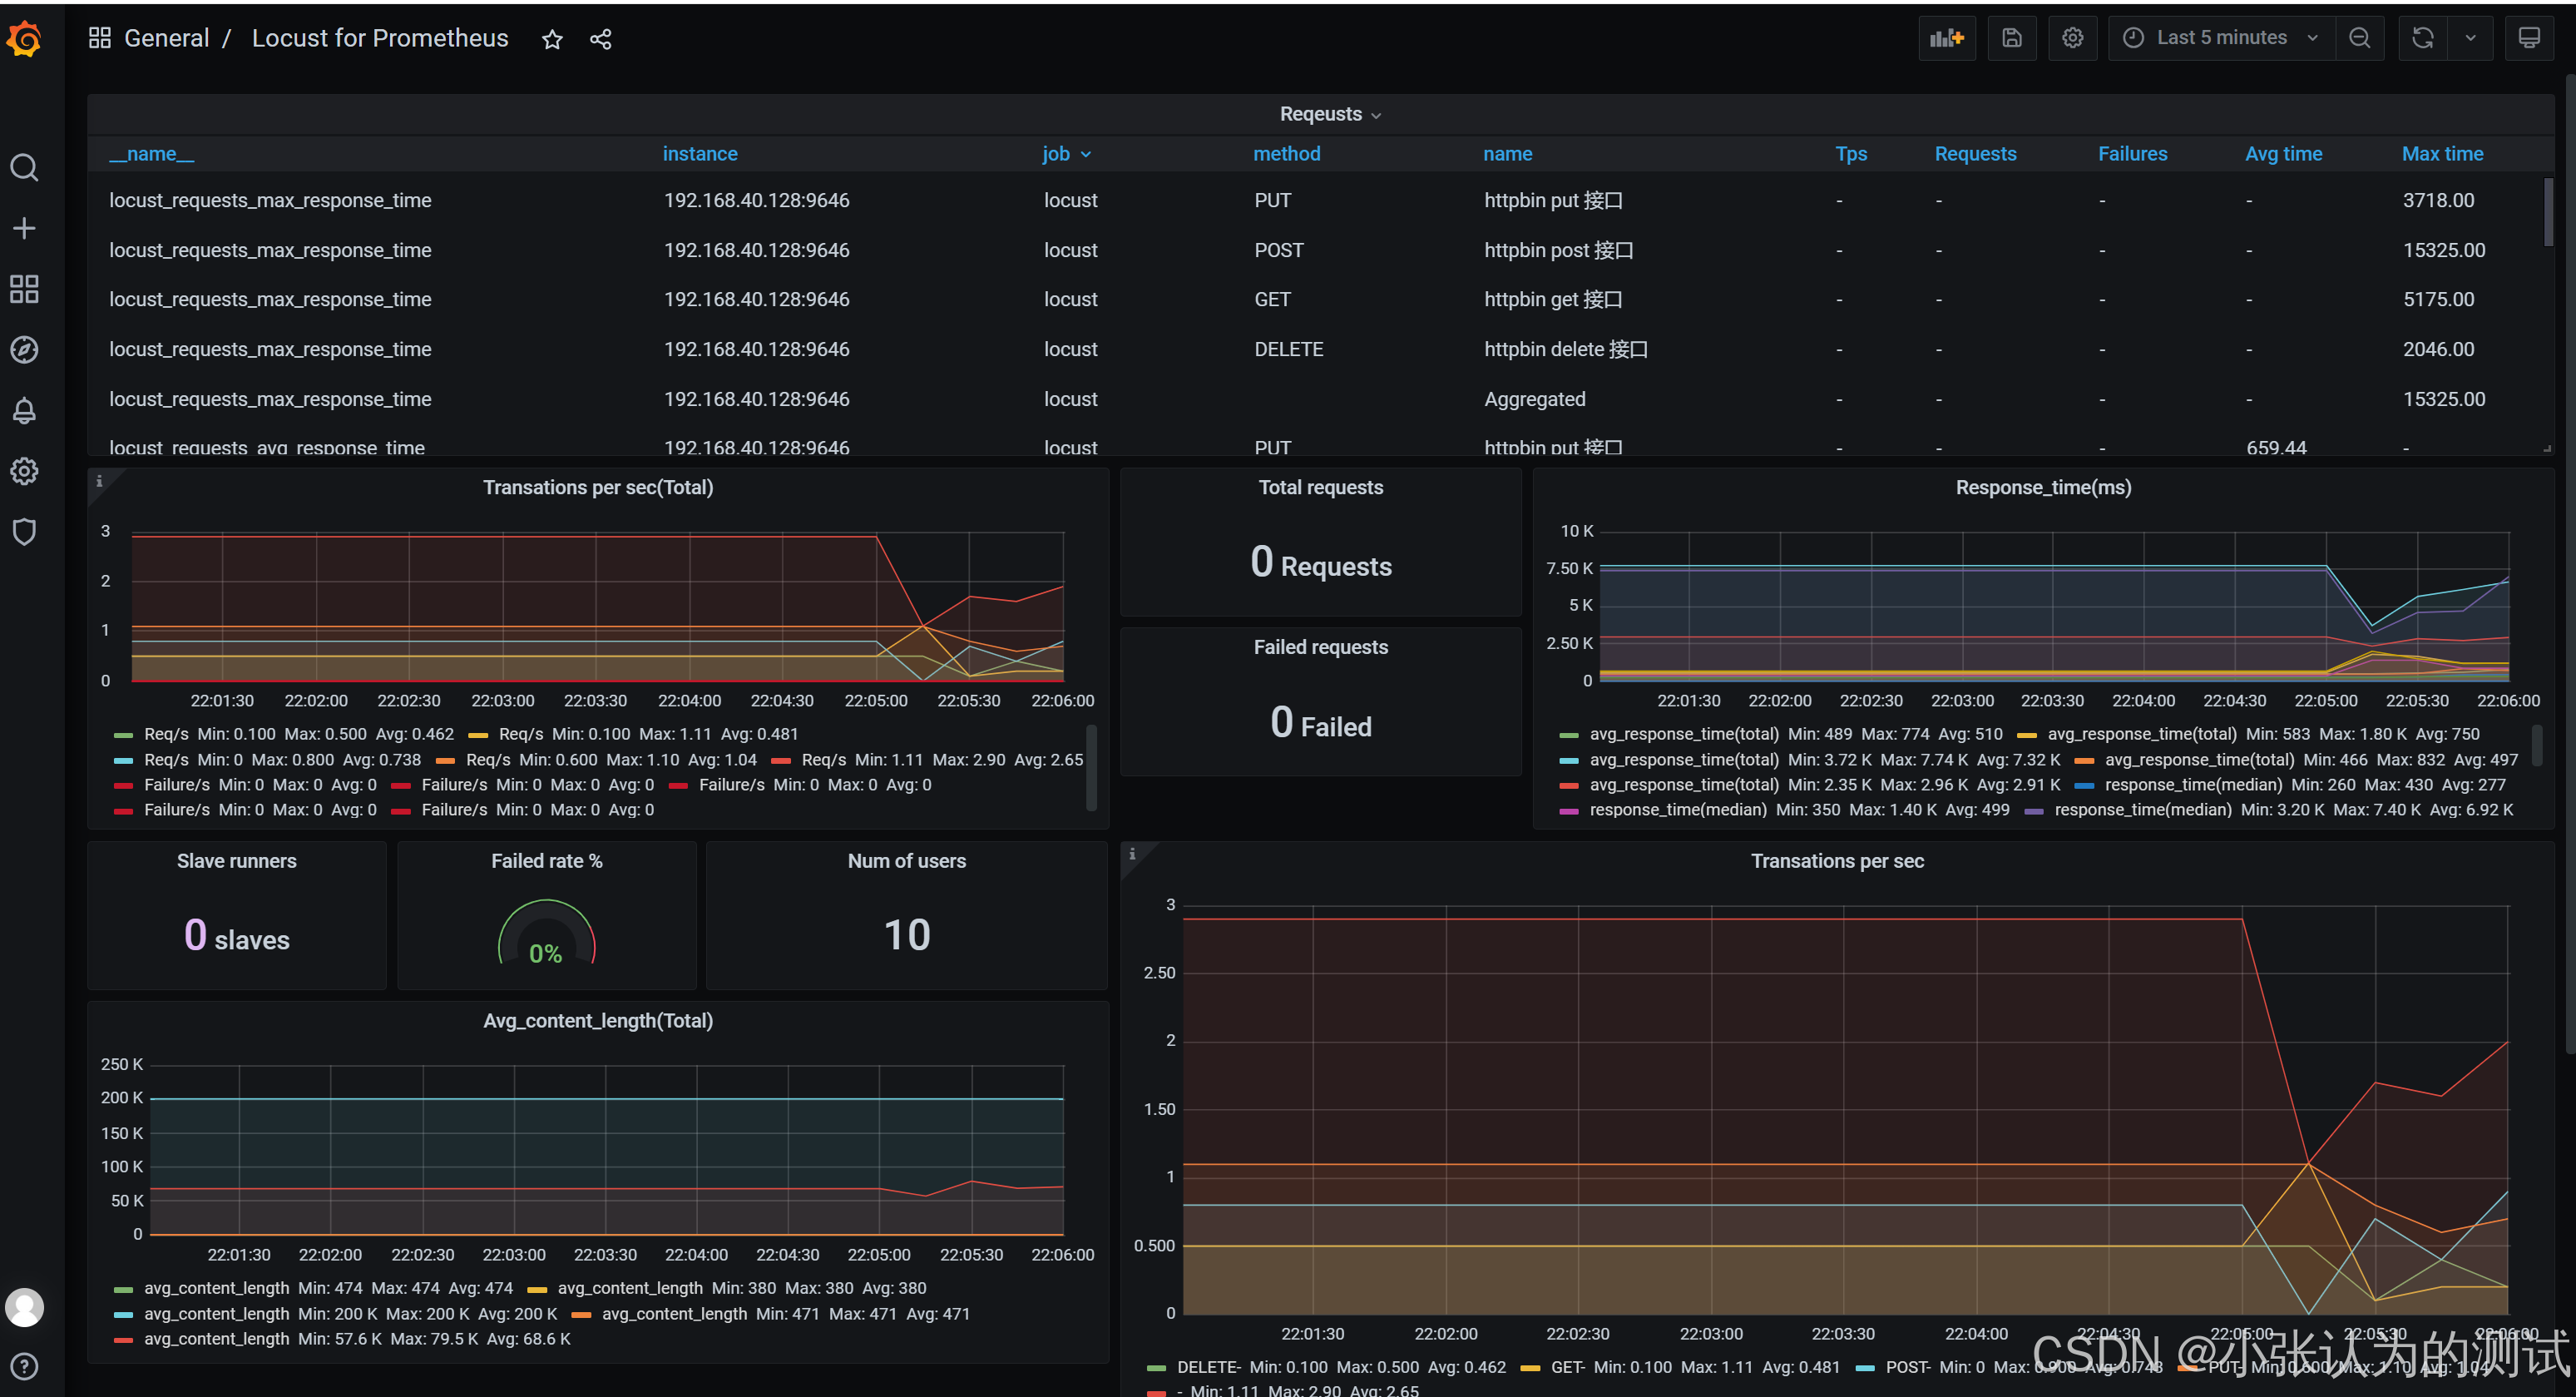
以上就完成了locust + grafana + prometheus 的配置