第九章 绘图与图表
绘图与图表在嵌入式里有的比较多,尤其是图表,我们常在股票里看到的“图表折线/曲线图/饼状图等”都可以用Qt的图表来实现。绘图和图表的内容本章主要介绍绘图和图表的基本操作,以简单的例子呈现绘图与图表的用法,目的就是快速入门绘图与图表,关于绘图与图表详解最好是看Qt官方的帮助文档。
9.1 QPainter绘图
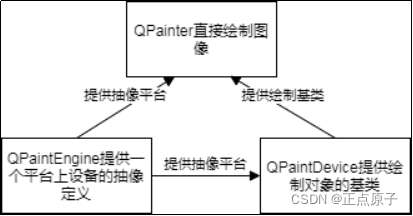
Qt里的所有绘图,比如一个按钮和一个Label的显示,都有绘图系统来执行。绘图系统基于QPainter、和QPaintDevice和QPainEngine类。QPainter是可以直接用来操作绘图的类,而QPaintDevice和QPainEngine都比QPainter更底层,我们只需要了解一下QPaintDevice和QPainEngine就行了。可以用下面一张图来表示它们的关系。
一般用于显示的类,如QWidget、QPixmap、QImage、Qlabel等可视类控件都可以充当绘图区域的“画布”,从QWidget继承的类都有virtual void paintEvent(QPaintEvent *event);属性。这个paintEvent()是一个虚函数,它在qwidget.h头文件的protected:修饰符下。
paintEvent()事件可以被重写。(解释:什么是绘图事件?可以这么理解,当界面初始化或者需要刷新时才会执行的事件,也就是说绘图事件在构造对象实例化时会执行,需要刷新界面我们可以使用update()方法执行paintEvent()事件)。
paintEvent()事件是父类QWidget提供给子类的接口,在父类里定义为空,所以可以说paintEvent()事件就是专门给子类画图用的。
paintEvent()事件在子类重写的基本结构如下:
void Widget::paintEvent(QPaintEvent *)
{


    /* 指定画图的对象,this代表是本Widget */
    QPainter painter(this);
    // 使用painter在对象上绘图...
}
9.1.1 应用实例
本例目的:快速了解paintEvent()事件的使用。
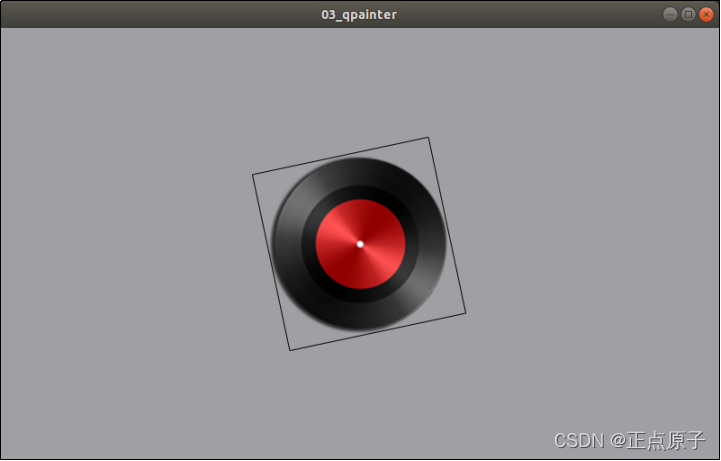
例03_qpainter,旋转的CD(难度:一般)。项目路径为Qt/2/03_qpainter。本例使用一张CD图片,用QPainter在paintEvent()将CD画在窗口的中心,并且每100ms旋转1度角度。所以CD看起来是旋转了的效果。
在头文件“mainwindow.h”具体代码如下。
mainwindow.h编程后的代码
    /******************************************************************
    Copyright © Deng Zhimao Co., Ltd. 1990-2021. All rights reserved.
    * @projectName   03_qpainter
    * @brief         mainwindow.h
    * @author        Deng Zhimao
    * @email         [email protected]
    * @net            www.openedv.com
    * @date           2021-03-29
    *******************************************************************/
1   #ifndef MAINWINDOW_H
2   #define MAINWINDOW_H
3
4   #include <QMainWindow>
5   #include <QPainter>
6   #include <QPaintEvent>
7   #include <QTimer>
8
9   class MainWindow : public QMainWindow
10  {


11      Q_OBJECT
12
13  public:
14      MainWindow(QWidget *parent = nullptr);
15      ~MainWindow();
16
17      /* 重写父类下的protected方法*/
18  protected:
19      void paintEvent(QPaintEvent *);
20
21  private:
22      /* 定时器,用于定时更新界面 */
23      QTimer *timer;
24      /* 角度 */
25      int angle;
26
27  private slots:
28      /* 槽函数 */
29      void timerTimeOut();
30
31  };
32  #endif // MAINWINDOW_H
第18行,因为paintEvent()是父类QWidget的protected修饰符下虚方法(虚函数),所以建议重写时也写到子类下的protected修饰符下。
在源文件“mainwindow.cpp”具体代码如下。
mainwindow.cpp编程后的代码
  /******************************************************************
    Copyright © Deng Zhimao Co., Ltd. 1990-2021. All rights reserved.
    * @projectName   03_qpainter
    * @brief         mainwindow.cpp
    * @author        Deng Zhimao
    * @email         [email protected]
    * @net            www.openedv.com
    * @date           2021-03-29
    *******************************************************************/
1   #include "mainwindow.h"
2   #include "QDebug"
3   MainWindow::MainWindow(QWidget *parent)
4       : QMainWindow(parent)
5   {


6       /* 设置主窗口位置及颜色 */
7       this->setGeometry(0, 0, 800, 480);
8       setPalette(QPalette(Qt::gray));
9       setAutoFillBackground(true);
10
11      /* 定时器实例化 */
12      timer = new QTimer(this);
13
14      /* 默认角度为0 */
15      angle = 0;
16
17      /* 定时100ms */
18      timer->start(100);
19
20      /* 信号槽连接 */
21      connect(timer, SIGNAL(timeout()), this, SLOT(timerTimeOut()));
22  }
23
24  MainWindow::~MainWindow()
25  {


26  }
27
28  void MainWindow::timerTimeOut()
29  {


30      /* 需要更新界面,不设置不更新 */
31      this->update();
32  }
33
34  void MainWindow::paintEvent(QPaintEvent *)
35  {


36      /* 指定父对象,this指本窗口 */
37      QPainter painter(this);
38
39      /* 设置抗锯齿,流畅转换 */
40      painter.setRenderHints(QPainter::Antialiasing
41                             | QPainter::SmoothPixmapTransform);
42      /* 计算旋转角度 */
43      if (angle++ == 360)
44          angle = 0;
45
46      /* QPixmap类型对象 */
47      QPixmap image;
48
49      /* 加载 */
50      image.load(":/image/cd.png");
51
52      /* QRectF即,继承QRect(Qt的矩形类),F代表精确到浮点类型 */
53      QRectF rect((this->width() - image.width()) / 2,
54                  (this->height() - image.height()) / 2,
55                  image.width(),
56                  image.height());
57
58      /* 默认参考点为左上角原点(0,0),因为旋转需要以图形的中心为参考点,
59       * 我们使用translate把参考点设置为CD图形的中心点坐标 */
60      painter.translate(0 + rect.x() + rect.width() / 2,
61                        0 + rect.y() + rect.height() / 2);
62
63      /* 旋转角度 */
64      painter.rotate(angle);
65
66      /* 现在参考点为CD图形的中心,我们需要把它设置回原点的位置,
67       * 所以需要减去上面加上的数 */
68      painter.translate(0 - (rect.x() + rect.width() / 2),
69                        0 - (rect.y() + rect.height() / 2));
70
71      /* 画图,QPainter提供了许多drawX的方法 */
72      painter.drawImage(rect, image.toImage(), image.rect());
73
74      /* 再画一个矩形 */
75      painter.drawRect(rect.toRect());
76  }
第34~76行,paintEvent()的实现。首先先指定需要画图的对象,加图片后,使用translate()设置参考原点,旋转一定的角度后再恢复参考原点。之后就开始画图。在参考原点处可能比较难理解,大家根据上面的注释多多分析。
第31行,定时100ms更新一次界面。因为paintEvent事件在构造函数执行时只会执行一次。我们需要使用update()方法来更新界面,才能看到CD旋转的效果。
9.1.2 程序运行效果
编译运行程序后可以看到如下效果,CD的外框加画了一个矩形,使旋转更明显。使用paintEvent可以实现一些需要绘图的情景,它可能比Qt动画类更容易实现。结合Qt的画笔,也可以设计一个绘图软件,这多得益于paintEvent()与QPainter使界面开发多了一些可能。在界面设计里,重绘界面使用paintEvent()也比较多,需要我们掌握这部分内容。
9.2 QChart图表
自从Qt发布以来,给跨平台的用户带来很多便利。在Qt5.7之前,Qt在开源社区版本里没有Qt Charts(自带的绘图组件库)。这使得像QWT、QCustomPlot等第三方库有了巨大的生存空间,作者也在Qt 5.7以下版本使用过第三方的QCustomPlot。要想使用Qt Charts,我们的Qt版本得使用Qt 5.7之后的版本。其实Qt Charts并不是Qt 5.7才有的,是在Qt 5.7以前只有商业版本的Qt才有Qt Charts。我们能免费下载的Qt版本都是社区(开源)版本。
Qt Charts很方便的绘制我们常见的曲线图、折线图、柱状图和饼状图等图表。不用自己花精力去了解第三方组件的使用了或者开发第三方组件。Qt的帮助文档里已经有说明Qt Charts主要部件的使用方法。需要用到时我们可以查看Qt文档就可以了。
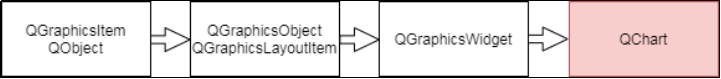
下面我们主要简介一下Qt Charts模块,首先先看它的继承关系,(看继承关系可以了解这个类是怎么来的,它不可能是一下子崩出来的)。至于怎么查看QChart类的继承关系,在我们第六章里Qt Creator的快捷键有讲到,Ctrl + Shift + T ,点击要查询的类的继承关系。
要想在项目里使用Qt Charts模块,需要在pro文件下添加以下语句。
QT += charts
如果我们点击查看Qt Charts类,我们可以看到要想使用Qt Charts类,除了需要包括相应的头文件外,还需要使用命名空间。格式如下。
一般在头文件处加上这个。
QT_CHARTS_USE_NAMESPACE
或者在头文件类外加上以下语句。
using namespace QtCharts;
下面我们直接开始例子,了解一下Qt Charts的使用。
9.2.1 应用实例
本例目的:快速了解Qt Charts的使用。例子非常实用,除了可以绘制静态曲线,也可以绘制动态曲线。例子可以直接应用到实际项目中利用提供接口读取数据绘制动态曲线图。
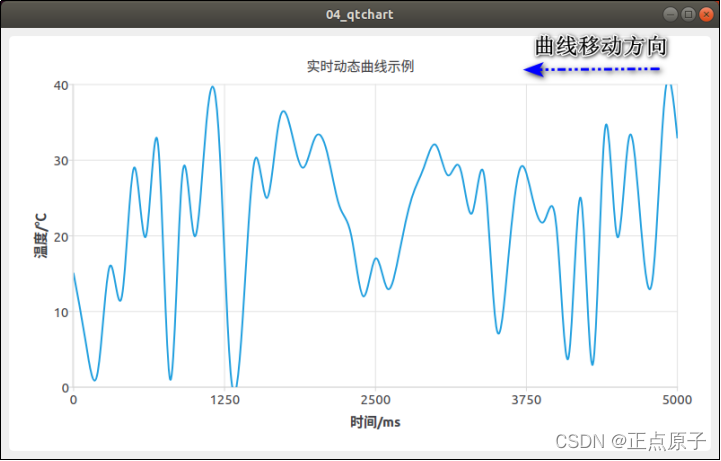
例04_qtchart,实时动态曲线(难度:一般)。项目路径为Qt/2/04_qtchart。本例基本流程如下:使用一个QSplineSeries对象(曲线),一个QChart(图表),一个QChartView(图表视图)。首先我们创建坐chart图表,然后创建两条坐标轴axisX与axisY。将两条坐标轴添加到chart图表上,再将splineSeries曲线与坐标轴连系起来。最后再将chart图表添加到chartView图表视图中。曲线上的数据由系统产生随机数,使用定时器更新数据。
项目文件04_qtchart.pro文件第一行添加的代码部分如下。
04_qtchart.pro编程后的代码
1   QT       += core gui charts
2
3   greaterThan(QT_MAJOR_VERSION, 4): QT += widgets
4
5   CONFIG += c++11
6
7   # The following define makes your compiler emit warnings if you use
8   # any Qt feature that has been marked deprecated (the exact warnings
9   # depend on your compiler). Please consult the documentation of the
10  # deprecated API in order to know how to port your code away from it.
11  DEFINES += QT_DEPRECATED_WARNINGS
12
13  # You can also make your code fail to compile if it uses deprecated APIs.
14  # In order to do so, uncomment the following line.
15  # You can also select to disable deprecated APIs only up to a certain version of
Qt.
16  #DEFINES += QT_DISABLE_DEPRECATED_BEFORE=0x060000    # disables all the APIs deprecated before Qt 6.0.0
17
18  SOURCES += \
19      main.cpp \
20      mainwindow.cpp
21
22  HEADERS += \
23      mainwindow.h
24
25  # Default rules for deployment.
26  qnx: target.path = /tmp/$${

    TARGET}/bin
27  else: unix:!android: target.path = /opt/$${

    TARGET}/bin
28  !isEmpty(target.path): INSTALLS += target
在头文件“mainwindow.h”具体代码如下。
mainwindow.h编程后的代码
    /******************************************************************
    Copyright © Deng Zhimao Co., Ltd. 1990-2021. All rights reserved.
    * @projectName   04_qtchart
    * @brief         mainwindow.h
    * @author        Deng Zhimao
    * @email         [email protected]
    * @net            www.openedv.com
    * @date           2021-03-28
    *******************************************************************/
1   #ifndef MAINWINDOW_H
2   #define MAINWINDOW_H
3   #include <QChartView>
4   #include <QSplineSeries>
5   #include <QScatterSeries>
6   #include <QDebug>
7   #include <QValueAxis>
8   #include <QTimer>
9   #include <QMainWindow>
10
11  /*  必需添加命名空间 */
12  QT_CHARTS_USE_NAMESPACE
13
14  class MainWindow : public QMainWindow
15  {


16      Q_OBJECT
17
18  public:
19      MainWindow(QWidget *parent = nullptr);
20      ~MainWindow();
21
22  private:
23      /* 接收数据接口 */
24      void receivedData(int);
25
26      /* 数据最大个数 */
27      int maxSize;
28
29      /* x轴上的最大值 */
30      int maxX;
31
32      /* y轴上的最大值 */
33      int maxY;
34
35      /* y轴 */
36      QValueAxis *axisY;
37
38      /* x轴 */
39      QValueAxis *axisX;
40
41      /* QList int类型容器 */
42      QList<int> data;
43
44      /* QSplineSeries对象(曲线)*/
45      QSplineSeries *splineSeries;
46
47      /* QChart图表 */
48      QChart *chart;
49
50      /* 图表视图 */
51      QChartView *chartView;
52
53      /* 定时器 */
54      QTimer *timer;
55
56  private slots:
57      void timerTimeOut();
58  };
59  #endif // MAINWINDOW_H
在源文件“mainwindow.cpp”具体代码如下。
mainwindow.cpp编程后的代码
    /******************************************************************
    Copyright © Deng Zhimao Co., Ltd. 1990-2021. All rights reserved.
    * @projectName   04_qtchart
    * @brief         mainwindow.cpp
    * @author        Deng Zhimao
    * @email         [email protected]
    * @net            www.openedv.com
    * @date           2021-03-28
    *******************************************************************/
1   #include "mainwindow.h"
2   #include <QDateTime>
3   MainWindow::MainWindow(QWidget *parent)
4       : QMainWindow(parent)
5   {


6       /* 设置最显示位置与大小 */
7       this->setGeometry(0, 0, 800, 480);
8       /* 最大储存maxSize - 1个数据 */
9       maxSize = 51;
10      /* x轴上的最大值 */
11      maxX = 5000;
12      /* y轴最大值 */
13      maxY = 40;
14
15      /* splineSeries曲线实例化(折线用QLineSeries) */
16      splineSeries = new QSplineSeries();
17      /* 图表实例化 */
18      chart = new QChart();
19      /* 图表视图实例化 */
20      chartView = new QChartView();
21
22      /* 坐标轴 */
23      axisY = new QValueAxis();
24      axisX = new QValueAxis();
25      /* 定时器 */
26      timer = new QTimer(this);
27
28      /* legend译图例类型,以绘图的颜色区分,本例设置为隐藏 */
29      chart->legend()->hide();
30      /* chart设置标题 */
31      chart->setTitle("实时动态曲线示例");
32      /* 添加一条曲线splineSeries */
33      chart->addSeries(splineSeries);
34
35      /* 设置显示格式 */
36      axisY->setLabelFormat("%i");
37      /* y轴标题 */
38      axisY->setTitleText("温度/℃");
39      /* y轴标题位置(设置坐标轴的方向) */
40      chart->addAxis(axisY, Qt::AlignLeft);
41      /* 设置y轴范围 */
42      axisY->setRange(0, maxY);
43      /* 将splineSeries附加于y轴上 */
44      splineSeries->attachAxis(axisY);
45
46      /* 设置显示格式 */
47      axisX->setLabelFormat("%i");
48      /* x轴标题 */
49      axisX->setTitleText("时间/ms");
50      /* x轴标题位置(设置坐标轴的方向) */
51      chart->addAxis(axisX, Qt::AlignBottom);
52      /* 设置x轴范围 */
53      axisX->setRange(0, maxX);
54      /* 将splineSeries附加于x轴上 */
55      splineSeries->attachAxis(axisX);
56
57      /* 将图表的内容设置在图表视图上 */
58      chartView->setChart(chart);
59      /* 设置抗锯齿 */
60      chartView->setRenderHint(QPainter::Antialiasing);
61
62      /* 设置为图表视图为中心部件 */
63      setCentralWidget(chartView);
64
65      /* 定时200ms */
66      timer->start(200);
67      /* 信号槽连接 */
68      connect(timer, SIGNAL(timeout()), this, SLOT(timerTimeOut()));
69
70      /* 设置随机种子,随机数初始化 */
71      qsrand(time(NULL));
72  }
73
74  MainWindow::~MainWindow()
75  {


76  }
77
78  void MainWindow::timerTimeOut()
79  {


80      /* 产生随机0~maxY之间的数据 */
81      receivedData(qrand() % maxY );
82  }
83
84  void MainWindow::receivedData(int value)
85  {


86      /* 将数据添加到data中 */
87      data.append(value);
88
89      /* 当储存数据的个数大于最大值时,把第一个数据删除 */
90      while (data.size() > maxSize) {


91          /* 移除data中第一个数据 */
92          data.removeFirst();
93      }
94
95      /* 先清空 */
96      splineSeries->clear();
97
98      /* 计算x轴上的点与点之间显示的间距 */
99      int xSpace = maxX / (maxSize - 1);
100
101     /* 添加点,xSpace * i 表示第i个点的x轴的位置 */
102     for (int i = 0; i < data.size(); ++i) {


103         splineSeries->append(xSpace * i, data.at(i));
104     }
105 }
第84~105行,是实现曲线移动的重要代码,代码算法是,当数据的个数超过最大值后,我们就删除第一个数据,如此反复,就实现了数据移动的过程,同时图表视图中的曲线因为值的改变实现了“移动”。
9.2.2 程序运行效果