参考:https://www.cnblogs.com/xuxugui/p/9815237.html
https://blog.csdn.net/GarfieldEr007/article/details/50757070
1.直方图
代码实现:# -- coding: utf-8 --
from PIL import Image
from pylab import *
from matplotlib.font_manager import FontProperties
font = FontProperties(fname=r"c:\windows\fonts\SimSun.ttc", size=14)
im = array(Image.open(’…/data/empire.jpg’).convert(‘L’)) # 打开图像,并转成灰度图像
figure()
subplot(121)
gray()
contour(im, origin=‘image’)
axis(‘equal’)
axis(‘off’)
title(u’图像轮廓’, fontproperties=font)
subplot(122)
hist(im.flatten(), 128)
title(u’图像直方图’, fontproperties=font)
plt.xlim([0,260])
plt.ylim([0,11000])
show()
运行上面代码,结果如图
 出现的问题:
解决办法:命令行输入 pip install PIL 安装 PIL
下载matplotlib到Scripts文件夹下,命令行输入 pip install matplotlib 安装 matplotlib
下载网址https://pypi.org/project/matplotlib/


2.直方图均衡化
代码实现: # -- coding: utf-8 --
from PIL import Image
from pylab import *
from PCV.tools import imtools
from matplotlib.font_manager import FontProperties
font = FontProperties(fname=r"c:\windows\fonts\SimSun.ttc", size=14)
im = array(Image.open(’…/data/empire.jpg’).convert(‘L’)) # 打开图像,并转成灰度图像
#im = array(Image.open(’…/data/AquaTermi_lowcontrast.JPG’).convert(‘L’))
im2, cdf = imtools.histeq(im)
figure()
subplot(2, 2, 1)
axis(‘off’)
gray()
title(u’原始图像’, fontproperties=font)
imshow(im)
subplot(2, 2, 2)
axis(‘off’)
title(u’直方图均衡化后的图像’, fontproperties=font)
imshow(im2)
subplot(2, 2, 3)
axis(‘off’)
title(u’原始直方图’, fontproperties=font)
#hist(im.flatten(), 128, cumulative=True, normed=True)
hist(im.flatten(), 128, normed=True)
subplot(2, 2, 4)
axis(‘off’)
title(u’均衡化后的直方图’, fontproperties=font)
#hist(im2.flatten(), 128, cumulative=True, normed=True)
hist(im2.flatten(), 128, normed=True)
show()
运行结果如下图:

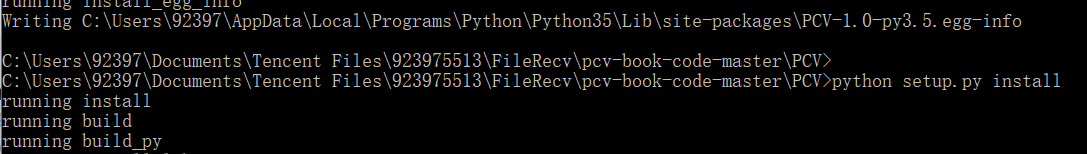
出现的问题:需要安装pcv库
解决方法:下载pcv文件。命令行进入pcv所在的目录下 运行
python setup.py install语句 若无报错则安装成功
3.高斯滤波
代码实现:# -- coding: utf-8 --
from PIL import Image
from pylab import *
from numpy import *
from numpy import random
from scipy.ndimage import filters
from scipy.misc import imsave
from PCV.tools import rof
“”" This is the de-noising example using ROF in Section 1.5. “”"
from matplotlib.font_manager import FontProperties
font = FontProperties(fname=r"c:\windows\fonts\SimSun.ttc", size=14)
im = array(Image.open(’…/data/empire.jpg’).convert(‘L’))
U,T = rof.denoise(im,im)
G = filters.gaussian_filter(im,10) # save the result
#imsave(‘synth_original.pdf’,im)
#imsave(‘synth_rof.pdf’,U)
#imsave(‘synth_gaussian.pdf’,G) # plot
figure()
gray()
subplot(1,3,1)
imshow(im)
#axis(‘equal’)
axis(‘off’)
title(u’原噪声图像’, fontproperties=font)
subplot(1,3,2)
imshow(G)
#axis(‘equal’)
axis(‘off’)
title(u’高斯模糊后的图像’, fontproperties=font)
subplot(1,3,3)
imshow(U)
#axis(‘equal’)
axis(‘off’)
title(u’ROF降噪后的图像’, fontproperties=font)
show()
运行结果如图

出现的问题:需要安装scipy
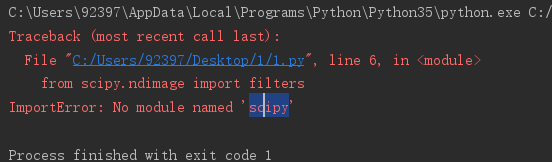
解决方法:命令行输入pip install scipy
