版权声明:本文为博主原创文章,如若转载请注明出处 https://blog.csdn.net/tonydz0523/article/details/86484102
类似于在jupyter上使用R语言,同样可以使用SQL语句:
详细见github项目:https://github.com/catherinedevlin/ipython-sql
安装ipython-sql
pip install ipython-sql
载入
%load_ext sql
连接数据库 同 SQLAlchemy
- postgresql://will:longliveliz@localhost/shakes
- mysql+pymysql://scott:tiger@localhost/foo
- oracle://scott:[email protected]:1521/sidname
- sqlite://
- sqlite:///foo.db
- mssql+pyodbc://username:password@host/databasedriver=SQL+Server+Native+Client+11.0
我是使用的是mysql,本地链接,用户名ffzs,密码666666,test数据库:
%sql mysql+pymysql://ffzs:666666@localhost/test
简单使用
%matplotlib inline
import matplotlib.pyplot as plt
plt.style.use('bmh')
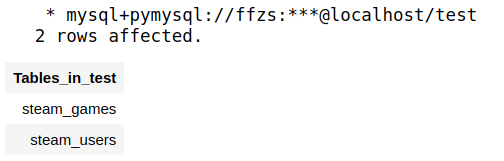
1.显示表
%%sql
show tables;
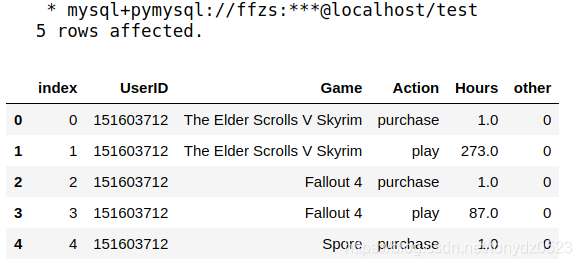
2.选取steam_users表的前5行
df = %sql select * from steam_users limit 5
df.DataFrame()
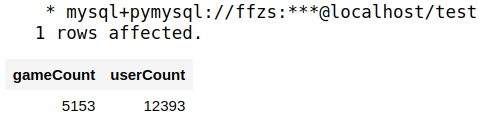
3.计算表中包含多少游戏数和玩家数
%%sql
select count(distinct Game) gameCount, count(distinct UserID) userCount
from steam_users
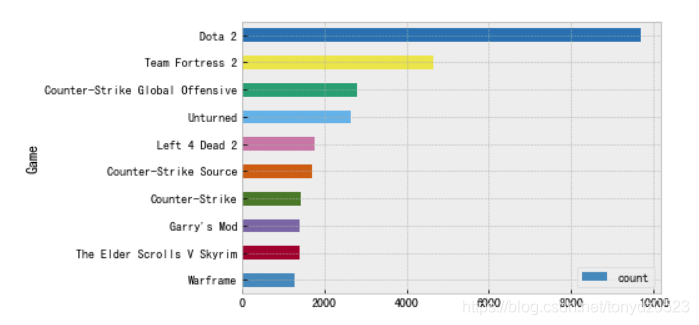
4.筛选出拥有用户前十的游戏
%%sql
data <<
select Game , count(1) as count from steam_users
where Action='play'
group by Game
order by count desc
limit 10
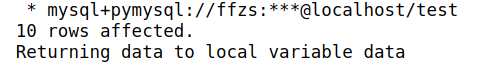
data.DataFrame()[::-1].plot.barh("Game","count")
5.筛选出被玩总时长前十的游戏
%%sql
playHour <<
select Game,sum(Hours) as playHour
from steam_users
where Action="play"
group by Game
order by playHour desc
limit 10

playHour.DataFrame()[::-1].plot.barh('Game', 'playHour')

6.筛选出被玩平均时长前十的游戏
%%sql
avgHour <<
select Game, avg(Hours) as avgHour
from steam_users
where Action='play'
group by Game
order by avgHour desc
limit 10
avgHour.DataFrame()[::-1].plot.barh('Game','avgHour')

7.平均时长前十的游戏的游戏人数
%%sql
select Game, avg(Hours) as avgHour, count(1) as count
from steam_users
where Action='play'
group by Game
order by avgHour desc
limit 10

联系join on:
%%sql
select a.Game, avgHour, count from
(select Game, avg(Hours) as avgHour
from steam_users
where Action='play'
group by Game
order by avgHour desc
limit 10) a
left join
(select Game ,count(1) as count
from steam_users
where Action='play'
group by Game) b
on a.Game=b.Game
order by avgHour desc

可见平均时长长的游戏大多是小众游戏
8.玩家人数大于500人的游戏的个数(having使用)
%%sql
select count(1) as count
from
(select Game, count(1) as count
from steam_users
where Action='play'
group by Game
having count > 500) a
9.拥有游戏数量前十用户
%%sql
games <<
select UserID, count(1) count
from steam_users
where Action='play'
group by UserID
order by count desc
limit 10
games.DataFrame()[::-1].plot.barh('UserID','count')

10.游戏总时长最多5个用户和最少5个用户(union使用)
%%sql
(select UserID, sum(Hours) as allHour
from steam_users
where Action='play'
group by UserID
order by allHour desc
limit 5)
union
(select UserID, sum(Hours) as allHour
from steam_users
where Action='play'
group by UserID
order by allHour
limit 5)
