1. 效果展示
2. 工具函数
import umap
import altair as alt

from numba.core.errors import NumbaDeprecationWarning, NumbaPendingDeprecationWarning
import warnings

warnings.simplefilter('ignore', category=NumbaDeprecationWarning)
warnings.simplefilter('ignore', category=NumbaPendingDeprecationWarning)


def umap_plot(text, emb):

    cols = list(text.columns)
    # UMAP reduces the dimensions from 1024 to 2 dimensions that we can plot
    reducer = umap.UMAP(n_neighbors=2)
    umap_embeds = reducer.fit_transform(emb)
    # Prepare the data to plot and interactive visualization
    # using Altair
    #df_explore = pd.DataFrame(data={'text': qa['text']})
    #print(df_explore)

    #df_explore = pd.DataFrame(data={'text': qa_df[0]})
    df_explore = text.copy()
    df_explore['x'] = umap_embeds[:,0]
    df_explore['y'] = umap_embeds[:,1]

    # Plot
    chart = alt.Chart(df_explore).mark_circle(size=60).encode(
        x=#'x',
        alt.X('x',
            scale=alt.Scale(zero=False)
        ),
        y=
        alt.Y('y',
            scale=alt.Scale(zero=False)
        ),
        tooltip=cols
        #tooltip=['text']
    ).properties(
        width=700,
        height=400
    )
    return chart

def umap_plot_big(text, emb):

    cols = list(text.columns)
    # UMAP reduces the dimensions from 1024 to 2 dimensions that we can plot
    reducer = umap.UMAP(n_neighbors=100)
    umap_embeds = reducer.fit_transform(emb)
    # Prepare the data to plot and interactive visualization
    # using Altair
    #df_explore = pd.DataFrame(data={'text': qa['text']})
    #print(df_explore)

    #df_explore = pd.DataFrame(data={'text': qa_df[0]})
    df_explore = text.copy()
    df_explore['x'] = umap_embeds[:,0]
    df_explore['y'] = umap_embeds[:,1]

    # Plot
    chart = alt.Chart(df_explore).mark_circle(size=60).encode(
        x=#'x',
        alt.X('x',
            scale=alt.Scale(zero=False)
        ),
        y=
        alt.Y('y',
            scale=alt.Scale(zero=False)
        ),
        tooltip=cols
        #tooltip=['text']
    ).properties(
        width=700,
        height=400
    )
    return chart
3. 示例代码1
安装依赖库,
pip install cohere umap-learn altair datasets
加载环境变量,
import os
from dotenv import load_dotenv, find_dotenv

_ = load_dotenv(find_dotenv())  # read local .env file
创建 cohere 客户端,
import cohere

co = cohere.Client(os.environ['COHERE_API_KEY'])
设置示例数据,
import pandas as pd
sentences = pd.DataFrame({'text':
[
'Where is the world cup?',
'The world cup is in Qatar',
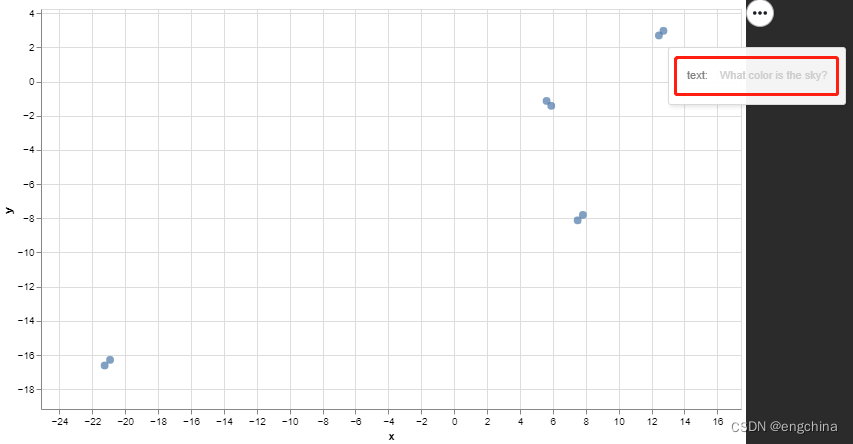
'What color is the sky?',
'The sky is blue',
'Where does the bear live?',
'The bear lives in the the woods',
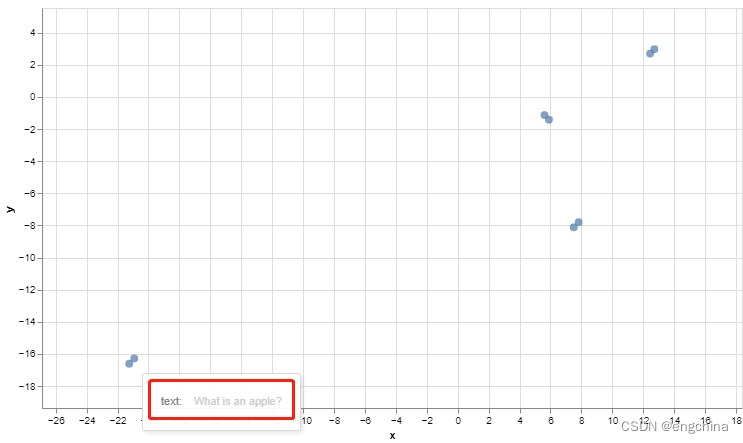
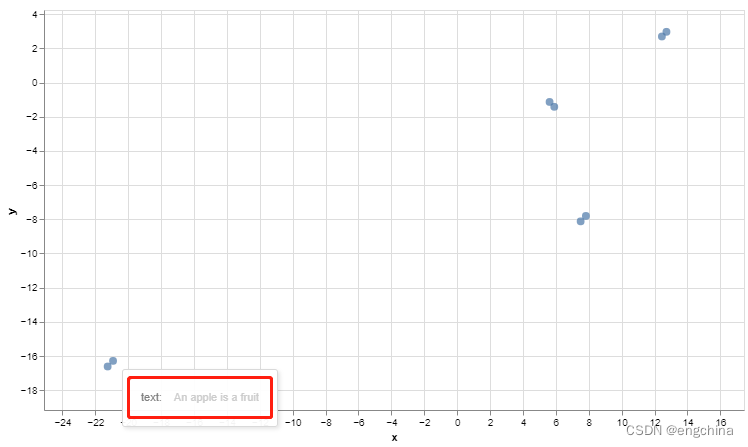
'What is an apple?',
'An apple is a fruit',
]})
向量化,
emb = co.embed(texts=list(sentences['text']),
               model='embed-english-v2.0').embeddings

# Explore the 10 first entries of the embeddings of the 3 sentences:
for e in emb:
    print(e[:3])
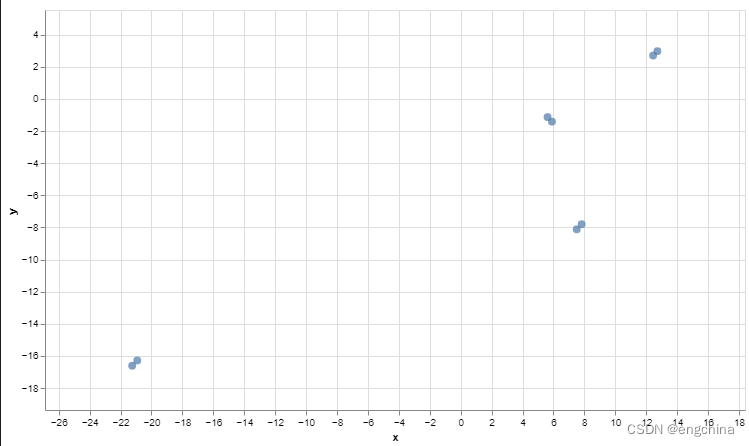
通过 umap 进行图形化展示,
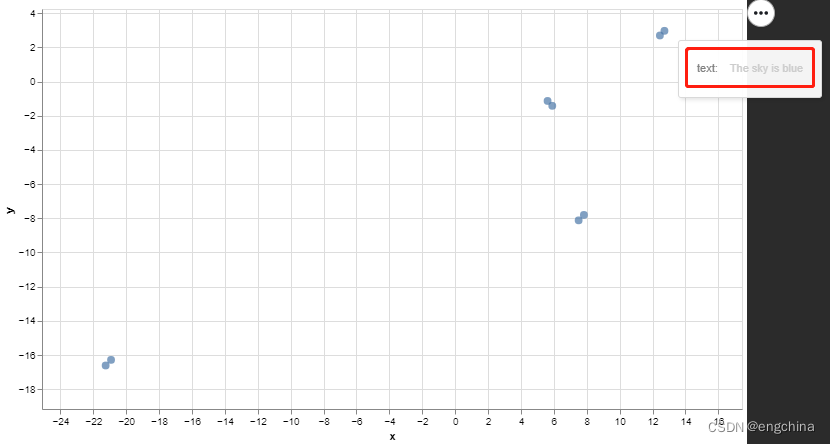
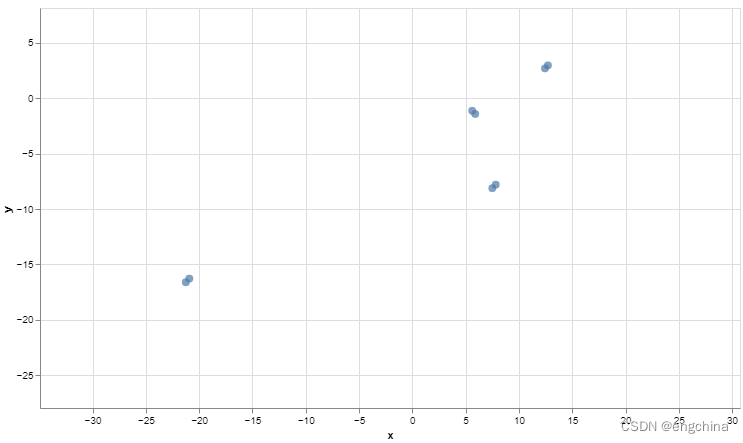
chart = umap_plot(sentences, emb)
chart.interactive()
效果如下,
4. 示例代码2
加载数据,
import pandas as pd

wiki_articles = pd.read_pickle('wikipedia.pkl')
wiki_articles
通过 umap 图形化展示,
import numpy as np
articles = wiki_articles[['title', 'text']]
embeds = np.array([d for d in wiki_articles['emb']])
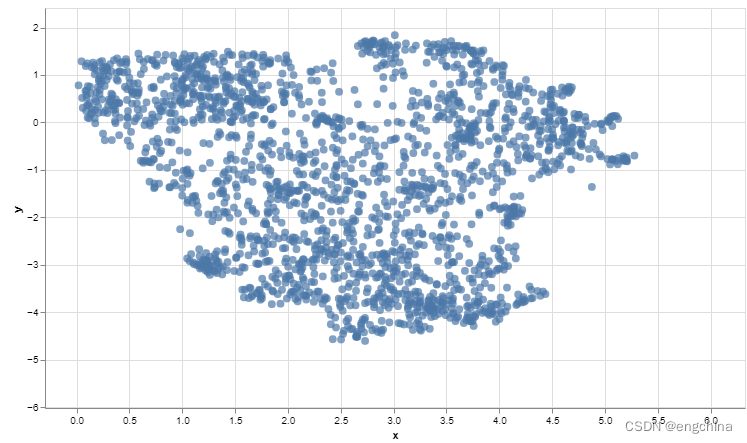
chart = umap_plot_big(articles, embeds)
chart.interactive()
效果如下,
完结!