1.什么是mxgraph
mxGraph是一个JavaScript图表库,可以快速创建交互式图形和图表应用程序,这些应用程序可以在其供应商支持的任何主要浏览器中运行。mxGraph 提供图形绘制、图形可视化、图形交互、图形布局、图形分析等能力, 适用于工作流程图、BPMN图、网络图、UML图、循环图、组织结构图、MindMap图、机架图、甘特图、信息图、平面图等绘制。
mxGraph在2005年创建,作为商业项目一直持续到2016年,2016年创建者以Apache 2.0开源协议在GitHub上公布源码。
官方产品(Draw.io): https://app.diagrams.net/
官方API :http://jgraph.github.io/mxgraph/docs/js-api
GitHub库:jgraph/mxgraph
1.1mxGraph 架构分析
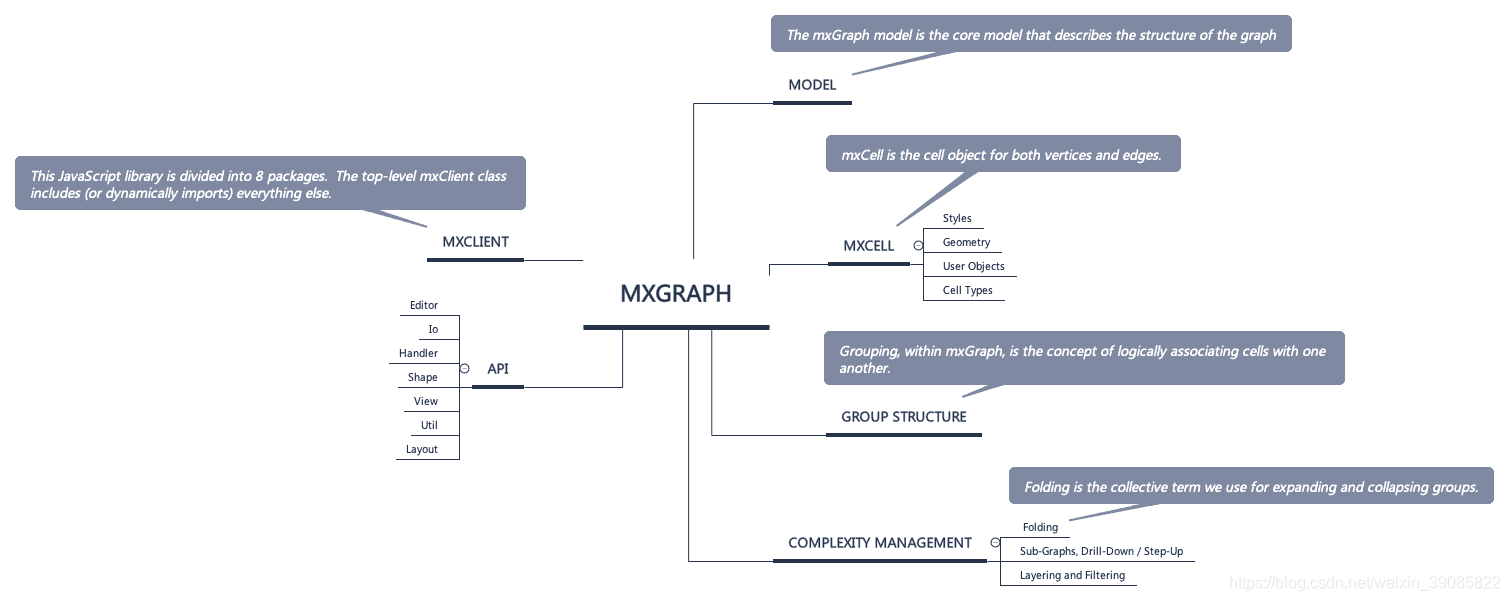
mxGraph中有三个主要的组件:mxGraph、mxGraphModel、mxCell(含edge和vertex)。
mxGraph是用户直接操作的图,图的所有状态都保存;在mxGraphModel中,而图中的顶点和边都是用mxCell定义。三者层次关系如图所示:
当用户对mxGraph进行操作时,所有操作都映射到对mxGraphModel中保存的状态进行修改,而mxGraphModel中保存的状态也就是mxCell的状态。
围绕着这三个组件,mxGraph定义了很多属性,比如图的功能、mxGraphModel的持久化、mxCell的外观等等。此外mxGraph还具有非常强大的事务管理机制和事件监听器。
| 主要组件 | 描述 | 作用 |
|---|---|---|
| mxClient | mxClient.js是客户端的引导机制,此文件include了运行mxGraph所需的所有源文件,并加载了其依赖的资源文件,以及配置了客户端的语言。 | 设置加载相关文件的全局变量,设置相关路径,设置客户端语言,加载css文件和js文件 |
| mxGraph | mxGraph继承自mxEventSource以实现基于Web的图形组件的功能性方面。要激活平移和连接,使用setPanning和setConnectable,对于框线选择,必须创建一个新的mxRubberband实例。默认情况下,以下监听器添加到mouseListeners:tooltipHandler:显示工具提示的mxTooltipHandler,panningHandler:用于平移和弹出菜单的mxPanningHandler,connectionHandler:用于创建连接的mxConnectionHandler,graphHandler:用于移动和克隆cell的mxGraphHandler 如果启用了这些监听器,则将按上述顺序调用它们。 | |
| mxGraphModel | mxGraphModel 是描述了图形结构的核心的模型,被称为mxGraphModel,可以在model包中发现。 另外,对图形结构的添加,更改和清除是通过图模型API来完成的。该模型还提供了方法来确定图形 的结构,以及提供方法来设置,如能见度、分组和样式的视觉状态。mxGraphModel是基本的对象,它存储着图形的数据结构。 | |
| mxCell | mxCell是节点和连线的图元对象。mxCell从模型那里复制了许多的方法。它们的主要差别在于,使用模型的方法会创建相关的事件通知以及撤销方法 |
mxGraph的功能依赖关系如图所示:
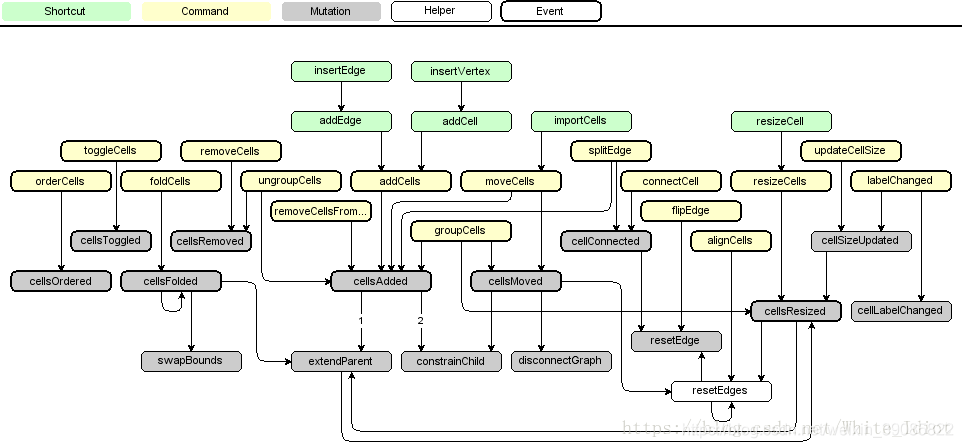
除此之外,mxGraph 还有 mxClient、组结构、复杂管理等部分组成,并提供 editor、io、handler、shape、view、util、layout 等 API。具体框架结构如下。
其中 API 提供如下能力:
| 包 | 描述 |
|---|---|
| editor | 提供了实现图编辑器所需的类,主要的类是mxEditor |
| handler, layout, shape | 分别包含事件监听器,布局算法和形状。图形事件监听器包括用于框线选择的mxRubberband,用于工具提示的mxTooltipHandler和用于基本单元修改的mxGraphHandler。mxCompactTreeLayout实现树形布局算法,shape包提供各种形状,这些形状是mxShape的子类。 |
| view, model | view和model实现了图形组件,由mxGraph表示。它指的是包含了mxCells并缓存mxGraphView中单元格的状态的mxGraphModel。根据mxStylesheet中定义的外观,使用mxCellRenderer绘制单元格。撤消历史记录在mxUndoManager中实现。要在图表上显示图标,可以使用mxCellOverlay。验证规则使用mxMultiplicity定义。 |
| util | 提供了实用程序类,包括用于复制粘贴的mxClipboard,用于键和样式表值的mxConstants,用于跨浏览器事件处理和通用功能的mxEvent和mxUtils,用于国际化的mxResource和mxLog用于控制台输出。 |
| io | 实现了一个通用的mxObjectCodec,用于将JavaScript对象转换为XML。主要类是mxCodec。mxCodecRegistry是自定义编解码器的全局注册表。 |
2.mxgraph初体验:
下面将基于vue框架,使用mxgraph绘制第一个流程图
第一步.安装mxgraph
npm install mxgraph-js --save
第二步.导入(在你需要用到的组件文件中导入):
import {

     mxGraph } from 'mxgraph-js'
第三步:开始使用:
<template>
  <div ref="graph_container" class="graph_container"></div>
</template>

<script>
import {

     mxGraph } from 'mxgraph-js'
export default {


  name: 'HelloWorld',
  mounted () {


    // 创建画布
    var graph = new mxGraph(this.$refs.graph_container);
    var parent = graph.getDefaultParent();
    // 开始更新画布
    graph.getModel().beginUpdate();
    try {


      // 插入节点
      let v1 = graph.insertVertex(parent, null, 'Hello,', 20, 20, 80, 30);
      let v2 = graph.insertVertex(parent, null, 'World!', 200, 150, 80, 30);
      // 插入连线
      graph.insertEdge(parent, null, '', v1, v2);
    } finally {


      // 画布更新结束
      graph.getModel().endUpdate();
    }
  }
};
</script>

<style>
</style>
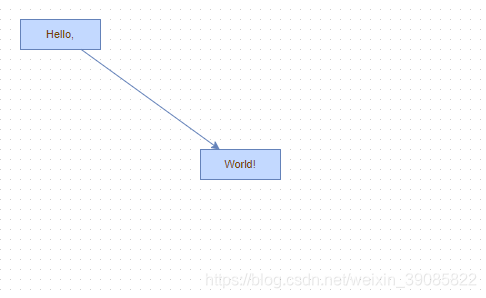
第四步:运行效果
API方法使用总结:
mxGraph.insertVertex(parent, id, value, x, y, width, height, style)
–在调用开始/结束更新中,创建并插入一个新的节点到模型中。
mxGraph.insertEdge(parent, id, value, source, target, style)
–在调用开始/结束更新中,创建并插入一条新的连线到模型中。
mxGraph.insertVertex()
–会创建一个mxCell对象并返回。
方法的参数:
parent – 组结构中此图元的直接父图元。我们会很快谈论到组结构,但现在我们直接使用graph.getDefaultParent();作为默认的父图元,就像在 HelloWorld 这个例子一样。
id – 描述此单元的全局唯一身份号码,总是一个字符串。主要用于外部对这单元的引用。如果你不想自己维护这些号码,只需要传入一个空参数并确保mxGraphModel.isCreateIds()返回真即可。这样,模型就会管理这些号码,并保证它们的唯一性。
value – 此单元的用户对象。用户对象只是一些对象,可以让您把应用程序的商务逻辑与mxGraph的可视化呈现相关联。在手册的后面有详细地描述,这里我们就只用字符 串就好,并把它们显示成节点和边的标签。
x, y, width, height – 就像名字提到的,这是节点的左上角的 x 和 y 的位置以及它的宽度和高度。
style – 将被应用到节点的样式描述。关于样式,很快会有更详细的描述,简单来讲,就是一个特定格式的字符串。这个字符串有零个或多个样式名字和一些键/值配对,用来覆盖全局设置或者创立新的样式。除非我们要创建自己的样式,我们可以直接使用这些现有的设置。
source和target –参数定义了节点要连接的节点;注意,源节点 和目标节点需要已经被加入到模型中。
注意:
1.mxGraph事物的更新(插入新元素时)一定要放在 beginUpdate 和 endUpdate 里面。一次 beginUpdate 必须对应一次 endUpdate
2.由于mxGraph配置了默认的样式(节点字体、连线等元素样式)和默认的配置所以样式看起来比较单一;我们可以在绘制图形前修改mxGraph默认配置好的配置项,来达到我们想要的效果;
3.mxgraph的自定义配置
js代码如下:

<template>
  <div ref="graph_container" class="graph_container"></div>
</template>

<script>
import {

     mxGraph, mxRubberband, mxConstants, mxEvent, mxGraphHandler, mxEdgeStyle } from 'mxgraph-js'
export default {


  name: 'HelloWorld',
  mounted () {


    var graph = new mxGraph(this.$refs.graph_container); //创建视图
    graph.setHtmlLabels(true); // Label 将显示 Html 格式的 Value
    graph.setTolerance(20);
    graph.setEnabled(true); //设置启用,就是允不允许你改变CELL的形状内容。
    graph.setVertexLabelsMovable(true); // 允许移动 Vertex 的 Label

    graph.setConnectable(true); // 是否允许Cells通过其中部的连接点新建连接,false则通过连接线连接
    graph.setDropEnabled(true); // 从工具栏拖动到目标细胞时细胞边界是否产生光圈
    graph.setTooltips(true); // 是否显示提示,默认显示Cell的名称
    graph.setResizeContainer(true); // 容器大小自适应
    graph.setMultigraph(false); // 重复连接
    graph.setAllowLoops(true); // 允许连线的目标和源是同一元素

    new mxRubberband(graph); // 左键框选(编辑状态下生效)
    // 节点样式
    var style = graph.getStylesheet().getDefaultVertexStyle();
    // style[mxConstants.STYLE_VERTICAL_ALIGN] = mxConstants.ALIGN_BOTTOM;//文字对齐方式
    // style[mxConstants.STYLE_FILLCOLOR] = 'rgb(251, 148, 79)'; //填充色
    style[mxConstants.STYLE_FONTSIZE] = 14; //文字大小
    style[mxConstants.STYLE_FONTCOLOR] = "#fff"; //文字颜色
    style[mxConstants.STYLE_WHITE_SPACE] = "wrap"; //自动换行
    delete style[mxConstants.STYLE_STROKECOLOR]; //去掉边框
    graph.getView().updateStyle = true; // 动态改变样式

    graph.setAutoSizeCells(true); // 鼠标拖动
    graph.setPanning(true); // 移动镜头(移动容器坐标轴)
    graph.panningHandler.useLeftButtonForPanning = true; // 设置左键可移动容器坐标轴

    graph.setCellsResizable(false); // 禁止改变元素大小
    mxEvent.disableContextMenu(this.$refs.graph_container); // 禁用浏览器默认的右键菜单栏
    graph.connectionHandler.setCreateTarget(true); // 是否创建目标
    mxGraphHandler.prototype.setMoveEnabled(false);//是否可以移动
    mxGraphHandler.prototype.guidesEnabled = true;//显示细胞位置标尺  /*禁用节点双击,防止改变数据 */
    graph.dblClick = function (evt, cell) {

     var model = graph.getModel(); if (model.isVertex(cell)) {

     return false; } };  //重写方法不允许那条线(edge)可以编辑
    graph.isCellEditable = function (cell) {

     return !this.getModel().isEdge(cell) && !this.getModel().isVertex(cell); };

    // 鼠标滚轮缩放
    mxEvent.addMouseWheelListener(function (evt, up) {


      if (up) {


        graph.zoomIn();
      } else {


        graph.zoomOut();
      }
      mxEvent.consume(evt);
    });

    style = graph.getStylesheet().getDefaultEdgeStyle();
    style[mxConstants.STYLE_EDGE] = mxEdgeStyle.TopToBottom;
    style[mxConstants.STYLE_STROKECOLOR] = "rgb(115, 121, 133)"; //连接线颜色
    delete graph.getStylesheet().getDefaultEdgeStyle()["endArrow"]; //去掉箭头
    //绑定双击事件
    graph.addListener(mxEvent.DOUBLE_CLICK, function (sender, evt) {


      var cell = evt.getProperty("cell");
      console.log(cell)
    });

    var parent = graph.getDefaultParent();
    graph.getModel().beginUpdate();
   // 开始画图
    try {


      // 插入节点
      var v1 = graph.insertVertex(parent, null, "Hello,", 20, 20, 80, 30);
      // 插入节点
      var v2 = graph.insertVertex(parent, null, "World!", 200, 150, 80, 30);
      graph.insertEdge(parent, null, " ", v2, v1);
      graph.insertEdge(parent, null, " ", v2, v2);
    } finally {


      graph.getModel().endUpdate();
    }
  }
};
</script>

<style >
</style>
注意:
1.我们在配置中会用到mxGraph中其他的模块,所以我们使用到mxGraph的哪个方法就得把它们import进来。
2.mxGraph中有三个主要的组件:mxGraph、mxGraphModel、mxCell。mxGraph是用户直接操作的图,图的所有状态都保存在mxGraphModel中,而图中的顶点和边都是用mxCell定义。
3.insertVertex 做了三件事,先是设置几何信息,然后创建一个节点,最后将这个节点添加到画布。insertEdge 与 insertVertex 类似,方法中的几何信息四个数字分别对应 X、 Y、 宽、 高 ;坐标是以graph的左上角为原点。
3.当用户对mxGraph进行操作时,所有操作都映射到对mxGraphModel中保存的状态进行修改,而mxGraphModel中保存的状态也就是mxCell的状态。
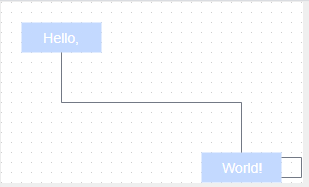
运行效果:
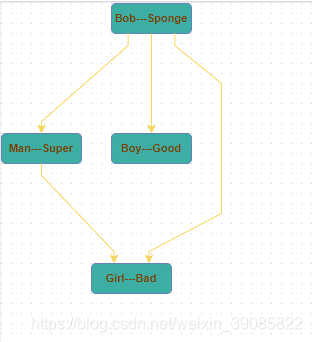
4.绘制具备树形结构的拓扑图
对于自动布局,我们可以根据官网提供的mxHierarchicalLayout模块,它提供了getLayout钩子。可以重写它以返回给定cell的子节点的布局算法。
代码如下:
<template>
  <div ref="graph_container" class="graph_container"></div>
</template>

<script>
import {

     mxHierarchicalLayout, mxGraph, mxUtils } from 'mxgraph-js'

export default {


  name: 'HelloWorld',
  mounted () {


    this.init()
  },
  methods: {


    init () {


      // 创建一个mxGraph 实例
      var graph = new mxGraph(this.$refs.graph_container);
      var model = graph.getModel();
      var parent = graph.getDefaultParent();

      var doc = mxUtils.createXmlDocument();
      // 创建userObject
      var uo1 = doc.createElement('person');
      uo1.setAttribute("firstName", 'Sponge');
      uo1.setAttribute("lastName", 'Bob')

      var uo2 = doc.createElement('person');
      uo2.setAttribute("firstName", "Super");
      uo2.setAttribute("lastName", 'Man');

      var uo3 = doc.createElement('person');
      uo3.setAttribute("firstName", "Good");
      uo3.setAttribute("lastName", 'Boy');

      var uo4 = doc.createElement('person');
      uo4.setAttribute("firstName", "Bad");
      uo4.setAttribute("lastName", 'Girl');
      // 定义convertValueSTotring方法
      graph.convertValueToString = function (cell) {


        if (mxUtils.isNode(cell.value)) {


          // 判断节点类型是否为'person'
          if (cell.value.nodeName == "person") {


            var firstName = cell.getAttribute("firstName", '');
            var lastName = cell.getAttribute("lastName", '');
            if (lastName != null && lastName.length > 0) {


              return lastName + '---' + firstName;
            }
            return firstName
          }
        }
        return '';
      };

      // 创建一个布局实例
      var layout = new mxHierarchicalLayout(graph)
      // var layout = new mxCircleLayout(graph,20)
      model.beginUpdate();
      try {


        // 绘制节点
        var child1 = graph.insertVertex(parent, null, uo1, 300, 100, 80, 30, 'fillColor=#3CAEA3;strokeColor = white;rounded=1;fontStyle=1');
        var child2 = graph.insertVertex(parent, null, uo2, 20, 20, 80, 30, 'fillColor=#3CAEA3;strokeColor = white;rounded=1;fontStyle=1');
        var child3 = graph.insertVertex(parent, null, uo3, 200, 150, 80, 30, 'fillColor=#3CAEA3;strokeColor = white;rounded=1;fontStyle=1');
        var child4 = graph.insertVertex(parent, null, uo4, 300, 150, 80, 30, 'fillColor=#3CAEA3;strokeColor = white;rounded=1;fontStyle=1');

        // 绘制连线
        graph.insertEdge(parent, null, '', child1, child2, 'strokeColor=#F6D55C');
        graph.insertEdge(parent, null, '', child1, child3, 'strokeColor=#F6D55C');
        graph.insertEdge(parent, null, '', child1, child4, 'strokeColor=#F6D55C');
        graph.insertEdge(parent, null, '', child2, child4, 'strokeColor=#F6D55C');

        layout.execute(parent)
      }
      finally {


        model.endUpdate()
      }
    }
  }
};
</script>
<style>
</style>
运行效果:
关于mxGraph,官方API文档不友好,介绍简单;API文档也是全是英文,官网的Demo倒是不少,不过有的拉下来在自己的环境下跑会报错,只有根据官方的demo不断地尝试和理解才能解决使用上的问题,目前只基本掌握基础使用部分,个人使用心得还会继续更新。
5.辅助功能演示:
通过以上三个demo的演示,相信大家对mxgraph已经有大致的了解了;下面在demo基础上我们针对一些辅助功能进行演示:
5.1选择线框
var rubberBand = new mxRubberband(graph);
注意:我们可以通过css来修改选择框的填充颜色;如:
.mxRubberband {


background-color: rgb(58, 58, 207);
position: absolute;
}
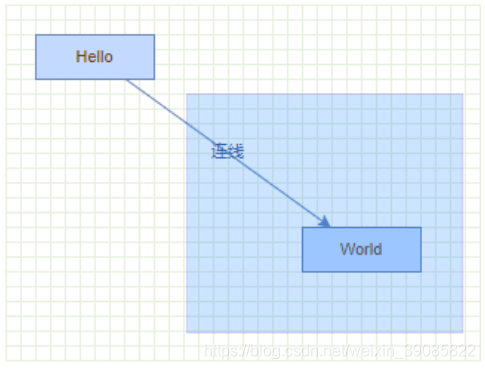
5.3修改连线样式
    mxEdgeStyle 中定义了线的各种样式:Loop、ElbowConnector、SideToSide等等,可以通过以下方式自定义连线样式:
 mxEdgeStyle.MyStyle = function(state, source, target, points, result){


 if (source != null && target != null){


 var pt = new mxPoint(target.getCenterX(), source.getCenterY());
 if (mxUtils.contains(source, pt.x, pt.y)){


 pt.y = source.y + source.height;
     }
 result.push(pt);
   }
 };

 mxStyleRegistry.putValue('myEdgeStyle', mxEdgeStyle.MyStyle);


var e1 = graph.insertEdge(parent, null, '连线', v1, v2);
graph.getModel().setStyle(e1, 'edgeStyle=myEdgeStyle');
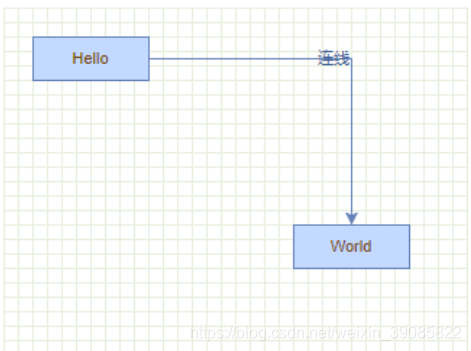
也可以在定义好自定义样式后,直接修改连线的默认样式:
var style = graph.getStylesheet().getDefaultEdgeStyle();
style[mxConstants.STYLE_EDGE] = mxEdgeStyle.MyStyle;
5.4开起“指引”功能
mxGraphHandler.prototype.guidesEnabled = true;
可以通过以上代码开起“指引”功能,即在拖动节点时会有对齐线等提示效果
关于mxGraph,由于官方API文档是全英文的,而且介绍简单;,官网的Demo倒是不少,但是官方Demo在自己的环境下跑会报错,只有根据官方的demo不断地尝试和理解才能解决使用上的问题,目前只基本掌握基础使用,后续会着重补充针对API的使用总结。
5.5 鼠标划过节点或连线时;边框高亮显示
可以通过以上代码添加对线和节点在鼠标划过时的高亮效果。mxCellTracker(graph, color, funct) 的第三个参数是可选的,如果设置了funct则需要在此函数中重写getCell逻辑。
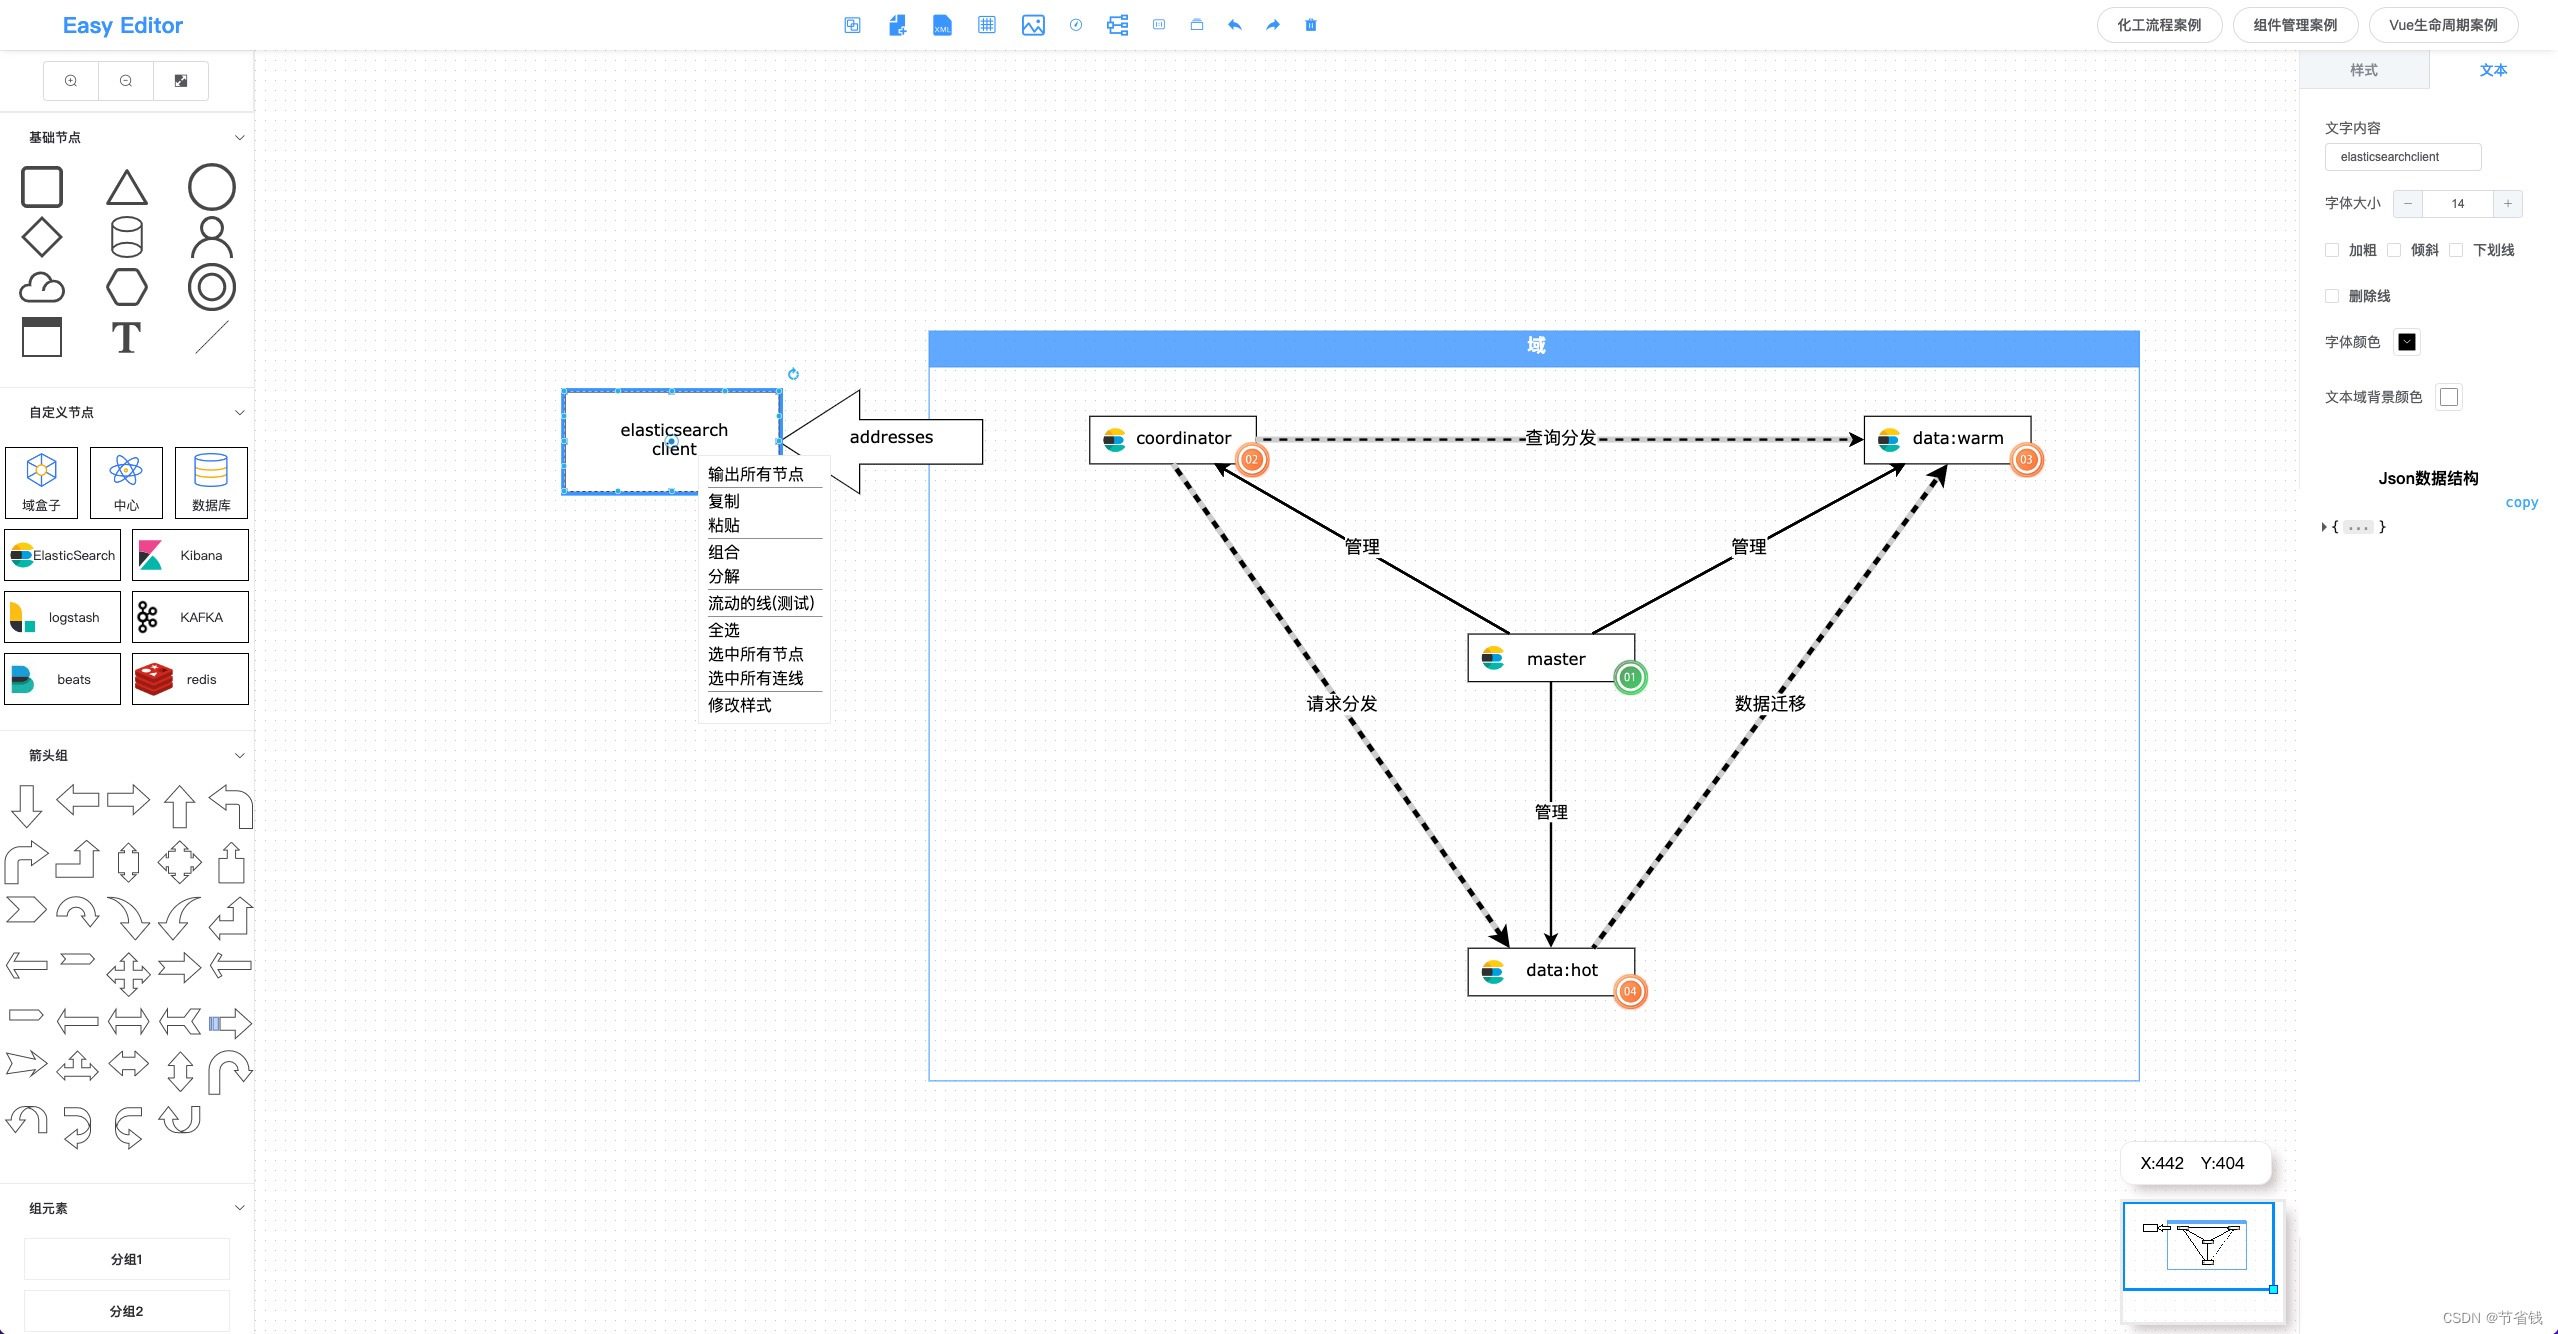
针对上述功能,我们下一步进行mxgraph拓扑图编辑工具的开发说明:
初始化画布:
导入mxgraph的资源的由于源代码中已有且各个功能注释已写的较明确在这里就暂不赘述了,主要以功能性方面进行介绍;下面将初始化画布分解为6个步骤讲解
第一步:首先mxgraph将会检测当前浏览器是否支持mxgraph,若不支持将会弹出警告并终止操作
第二步:.创建画布:
// 创建画布并进行初始化
createGraph () {


      // 创建graph
      // 方式一:直接构建graph实例
      // this.graph = new mxGraph(this.$refs.container)
      // eslint-disable-next-line new-cap
      this.editor = new mxEditor()
      this.graph = this.editor.graph
      this.editor.setGraphContainer(this.$refs.container)
    ......//其他配置项
}
我们在获取画布的dom元素(this.$ref.container)之后即可进行初始化;此步骤相当于告诉mxgraph我们将在那个dom元素上进行绘图;剩下的就是画布的配置项,各个配置的具体功能代码中备注
第三步:配置事件中心:此步骤将会配置各个事件
3.1监听 新增 cell 事件:
(在mxgraph中,节点和连线都是cell),当我们向画布新增cell时就会触发该事件;我们还可以配置其他的事件,所有事件都在mxEvent中,直接在控制台打印出,mxEvent就可以知道有什么事件,配置方法直接参考 ADD_CELLS 即可
第四步:配置鼠标事件:
我们可以配置鼠标事件来监听我们鼠标在画布中的操作
 // 配置鼠标在画布中的事件
    configMouseEvent () {


      this.graph.addMouseListener(
        {


          // currentState: null,
          // previousStyle: null,

          mouseDown: (sender, evt) => {


            if (!evt.state) {


              console.log('点击了画布')
            } else if (evt.state.cell.edge) {


              console.log('点击了连线', evt.state.cell)
            }
          },

          mouseMove: (sender, me) => {


            // this.graphX = Math.ceil(me.graphX)
            // this.graphY = Math.ceil(me.graphY)
          },

          mouseUp: (sender, evt) => {


            if (evt.sourceState === undefined) {


              return false
            } else {


              var cell = evt.sourceState.cell
              if (cell) {


                if (cell.edge && cell.edge === true) {


                  // 点击的是连线
                  localStorage.setItem('currOptEdgeId', cell.id)
                } else if (cell.vertex && cell.vertex === true) {


                  // 点击的是节点
                  localStorage.setItem('currOptInstId', cell.id)
                } else {


                  // 点击的是其他元素
                  console.log('点击了其他元素')
                }
              } else {


                this.$message.error('请选择节点或者连线')
              }
            }
          }
        })
    },
各个事件函数的形参即可获取当前鼠标操作的元素信息
第五步:.配置画布中的右键菜单
首先mxEvent.disableContextMenu(this.$refs.container) 告诉mxgraph你要在画布中配置右键菜单,并使用 popupMenuHandler 进行菜单项新增
graph.popupMenuHandler.factoryMethod = (menu) => {


menu.addItem('菜单名称', null, () => {

    })
}


// 配置右键菜单栏
configMenu () {


      // 禁用浏览器默认的右键菜单栏
      mxEvent.disableContextMenu(this.$refs.container)
      this.graph.popupMenuHandler.factoryMethod = (menu) => {


         menu.addItem('输出所有节点', null, () => {


           Object.values(this.graph.getModel().cells).forEach((cell) => {


             console.log(cell)
           })
         })
         menu.addSeparator()
         menu.addItem('全选', null, () => {


           this.graph.selectAll()
         })
         menu.addItem('选中所有节点', null, () => {


           this.graph.selectCells(true, false)
         })
         menu.addItem('选中所有连线', null, () => {


           this.graph.selectCells(false, true)
         })
}
第六步:.初始化左侧工具栏:
此处是重点,在此处配置后左侧的节点列表即可进行拖拽,并可通过拖拽节点到画布新增节点
// 初始化基础节点
    initGeneralTool () {


      var generalToolbarDomArray = this.$refs.generalToolItems
      // 判断是否为数组且数组是否为空
      if (!(generalToolbarDomArray instanceof Array || generalToolbarDomArray.length <= 0)) {


        return
      }
      generalToolbarDomArray.forEach((dom, domIndex) => {


        var toolItem = this.generalToolbarItemsView[domIndex]
        var {

     width, height } = toolItem
        var itemClass = (toolItem.class)
        // 新增基础节点
        var generalDropHandler = (graph, evt, dropCell, x, y) => {


          this.addByDrag = true
          const drop = !R.isNil(dropCell)
          const realX = drop ? x - dropCell.geometry.x : x
          const realY = drop ? y - dropCell.geometry.y : y
          const {

     width, height } = toolItem
          const style = `shape=ellipse;fillColor=${

      this.colorMapping[toolItem['entity_class']['entity_type']]};`
          const parent = drop ? dropCell : this.graph.getDefaultParent()
          this.graph.getModel().beginUpdate()
          try {


            let vertex = this.graph.insertVertex(parent, null, null, realX - (width / 2), realY - (height / 2), width, height, style)
            vertex.value = toolItem['entity_class']['entity_name']
            vertex.id = this.get_uuid()
            vertex.instanceClassInfo = toolItem
            localStorage.setItem('currOptInstId', vertex.id)
          } finally {


            this.graph.getModel().endUpdate()
          }
        }
        // 设置节点被拖拽时的样式(预览)
        var generalcreateDragPreview = () => {


          var elt = document.createElement('div')
          elt.style.width = `${

      width}px`
          elt.style.height = `${

      height}px`
          elt.style.transform = 'translate(-50%,-50%)'
          elt.style.backgroundColor = toolItem.instanceColor
          elt.style.lineHeight = `${

      height}px`
          elt.style.color = `#ffff`
          elt.style.textAlign = `center`
          elt.className = itemClass
          elt.textContent = toolItem['entity_class']['entity_name']
          return elt
        }
        // 允许拖拽
        let ds = mxUtils.makeDraggable(dom, this.graph, generalDropHandler, generalcreateDragPreview(), 0, 0, true, true)
        ds.setGuidesEnabled(true)
      })
    },
6.1首先获取左侧所有节点的dom,generalToolbarDomArray 这里有所有节点的样式和节点信息,
获取后遍历所有节点绑定generalcreateDragPreview , generalDropHandler , makeDraggable函数
var generalToolbarDomArray = this.$refs.generalToolItems
6.2当每次将左侧的节点拖拽时就会自动执行generalcreateDragPreview,此函数实现左侧节点被拖拽时的样式预览;
6.3当节点拖拽至画布并松开后会执行generalDropHandler
6.4当节点新增到画布之后会自动触发 ADD_CELLS 事件
注意:
左侧节点列表上方的搜索功能.在执行搜索后 generalToolbarDomArray 会改变, 所以在过滤完节点列表之后 我们要手动再执行一遍 initGeneralTool 函数,这样新的节点列表才可被拖拽新增
第七步:.自动布局
mxgraph提供了几种自动布局的API,直接调用graphLayout即可
// 布局
   graphLayout (animate, layoutType) {


     this.graph.getModel().beginUpdate()
     try {


       if (layoutType === 'randomLayout') {


         // 随机布局
         mxFastOrganicLayout.prototype.minDistanceLimit = 100
         // eslint-disable-next-line new-cap
         var layout = new mxFastOrganicLayout(this.graph)
         layout.forceConstant = 500
         layout.execute(this.graph.getDefaultParent())
       } else if (layoutType === 'hierarchicalLayout') {


         // 分层布局
         mxHierarchicalLayout.prototype.intraCellSpacing = 300
         mxHierarchicalLayout.prototype.fineTuning = false
         mxHierarchicalLayout.prototype.traverseAncestors = false
         mxHierarchicalLayout.prototype.resizeParent = true
         // 无关系实体之间的间距
         mxHierarchicalLayout.prototype.interHierarchySpacing = 200
         // 层级之间的距离
         mxHierarchicalLayout.prototype.interRankCellSpacing = 800

         // eslint-disable-next-line new-cap
         var hierarchicallayout = new mxHierarchicalLayout(this.graph, mxConstants.DIRECTION_NORTH)
         hierarchicallayout.execute(this.graph.getDefaultParent())
       } else if (layoutType === 'compactTreeLayout') {


         // 树形布局
         // eslint-disable-next-line new-cap
         var compactTreelayout = new mxCompactTreeLayout(this.graph)
         compactTreelayout.execute(this.graph.getDefaultParent())
       } else if (layoutType === 'circleLayout') {


         // 圆形布局
         // eslint-disable-next-line new-cap
         var circleLayout = new mxCircleLayout(this.graph, 400)
         circleLayout.execute(this.graph.getDefaultParent())
       }
     } catch (e) {


       throw e
     } finally {


       // 是否开启布局动画
       if (animate) {


         // eslint-disable-next-line new-cap
         var morph = new mxMorphing(this.graph, 20, 7.7, 40)
         morph.addListener(mxEvent.DONE, () => {


           this.graph.getModel().endUpdate()
         })
         morph.startAnimation()
       } else {


         this.graph.getModel().endUpdate()
       }
     }
项目源码欢迎star:

推荐文章:
1.基于mxGraph的可视化环境组网设计器:https://github.com/igonglei/env-editor
2.mxGraph学习笔记:https://www.kancloud.cn/wujie520303/mxgraph/1434409
3.功能全面的案例:https://github.com/lanniu/vue-mxgraph-example
4.关于mxGraph可搜索的API中文文档:https://api.mxgraph.lanniu.top/#/