K-mean均值算法原理讲解和代码实战
前言
最近在学习吴恩达机器学习课程,刚刚学完第一个无监督学习算法,搭配着机器学习实战里面的k-mean实战,成功的将理论和实际结合了起来。接下来,咱们简单的分析算法原理之后,着重讲解一下源代码。
项目github地址:K-mean算法实战
文章目录
K-mean算法原理解析
K表示的是组的个数,也就是你想把这些数据分成几类。
算法主要思路:
- 随机选择k个点,作为聚类的中心点
- 将所有数据进行归类,归类标准是按照欧几里得距离,数据离哪个中心点近,就属于哪一类
- 移动聚类点。计算属于该中心点的数据的平均值,将聚类点移动到平均值位置
- 不断重复2、3,直到数据的归类不再发生变化
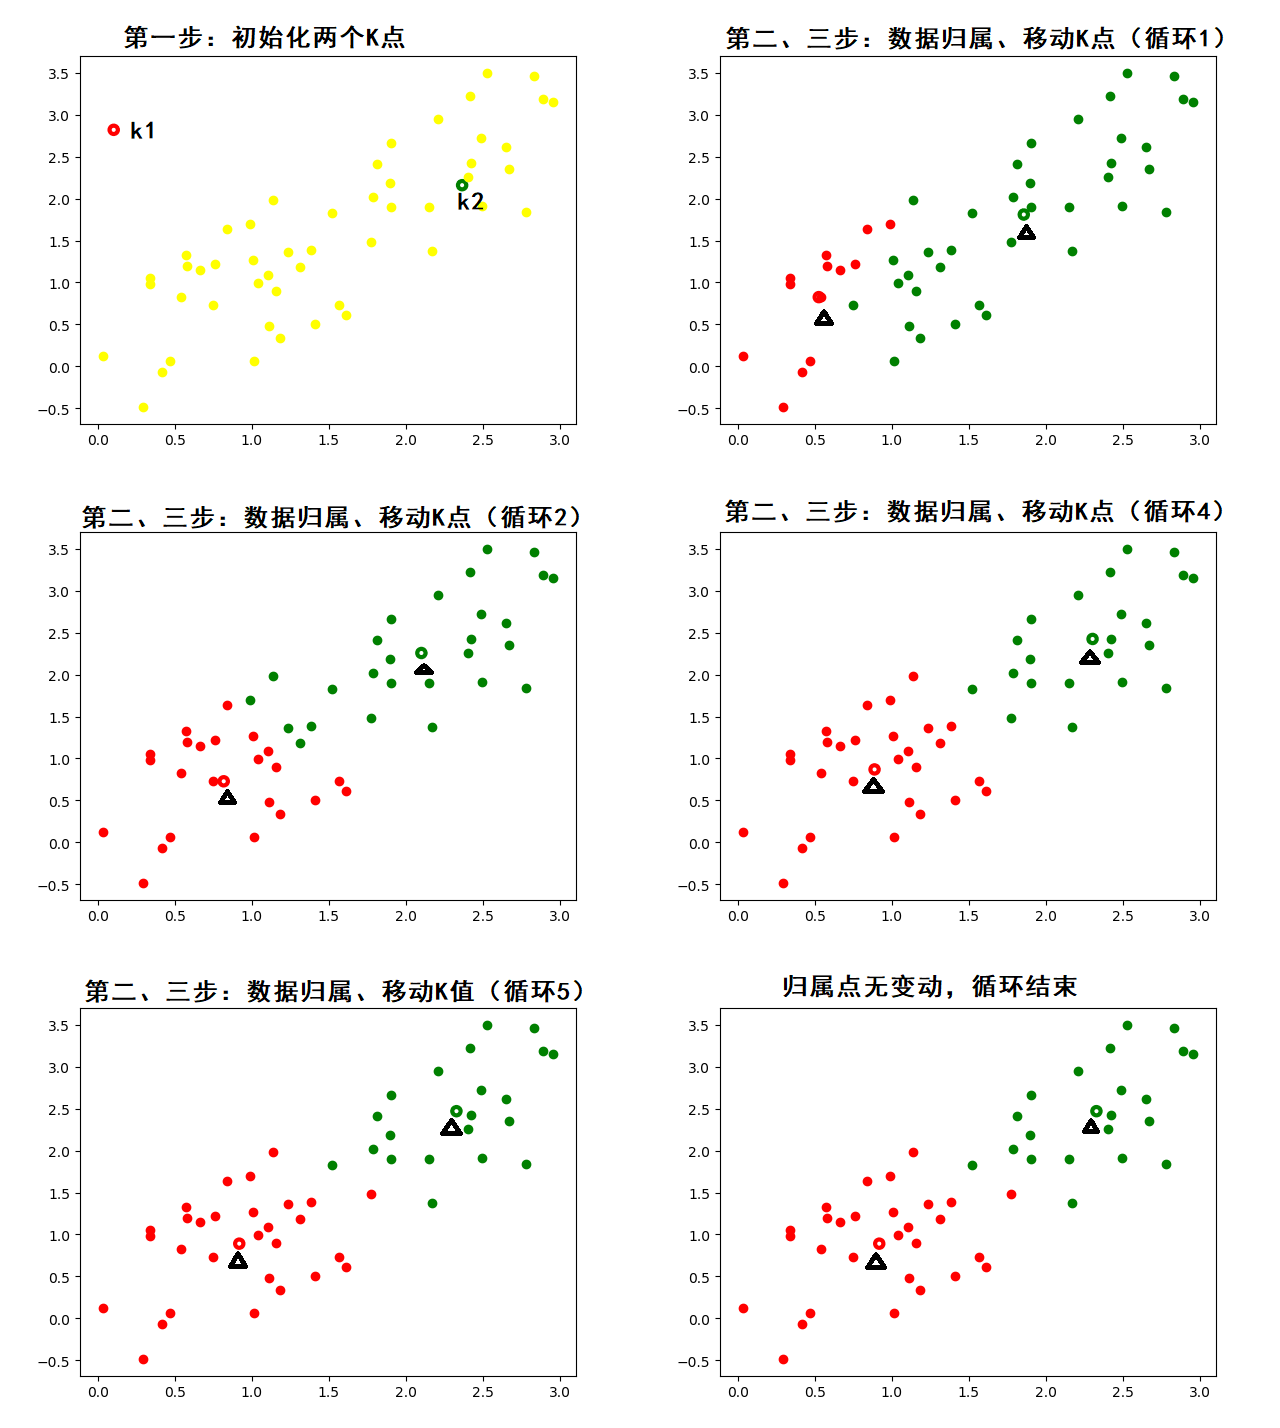
图形过程演示:
我使用了数据量是50,然后K值设定的是2,也就是分为两类
下面咱们看一下这个动图(文末有生成动图python代码地址):

接下来给大家解析一下:
- 下图是随机初始化的两个K点,当然这个初始化是的范围是在数据点的范围之内

扫描二维码关注公众号,回复:
11210843 查看本文章


- 下图开始进行2、3步的循环:

- 直到数据归属不发生改变,则判定为当前K点为最佳值。数据归属是根据各个数据点距K点的距离判定的,使用的方法是欧几里得距离公式。

代码解析
一、生成数据
def CreatData():
    x1 = np.random.rand(50)*3#0-3
    y1 = [i+np.random.rand()*2-1 for i in x1]
    with open('data.txt','w') as f:
        for i in range(len(x1)):
            f.write(str(x1[i])+'\t'+str(y1[i])+'\n')
二、读取数据
def loadDateSet(fileName):
    dataMat=[]
    fr = open(fileName)
    for line in fr.readlines():
        curline = line.strip().split('\t')
        #map函数 对指定的序列做映射,第一个参数是function 第二个是序列
        #此方法可以理解为进行字符串格式转换.这个函数可以深究
        fltLine = map(float,curline)
        dataMat.append(list(fltLine))
    return dataMat
这里主要是说一下map这个方法
map(function,list) 此方法的作用是将第二个参数(列表或者迭代器)对前面的方法进行一一映射。
举个例子:
>>>def square(x) :            # 计算平方数
...     return x ** 2
...
>>> map(square, [1,2,3,4,5])   # 计算列表各个元素的平方
[1, 4, 9, 16, 25]
map(float,curline) 的作用可以理解为将curline 列表中的数字格式转换成float类型的。
三、欧几里得距离计算
def distEclud(vecA,vecB):
    return np.sqrt(np.sum(np.power((vecA-vecB),2)))
四、显示变化数据变化过程
def showProcess(clusterAssment,centroids):
    #显示过程
    Index1 = np.nonzero(clusterAssment[:,0]==0)[0]
    Index2 = []
    for i in range(len(clusterAssment)):
        if i not in Index1:
            Index2.append(i)
    plt.plot(datamat[Index1,0],datamat[Index1,1],'ro')
    plt.plot(datamat[Index2,0],datamat[Index2,1],'go')
    plt.scatter([centroids[0][0]],[centroids[0][1]],color='',marker='o',edgecolors='red',linewidths=3)
    plt.scatter([centroids[1][0]],[centroids[1][1]],color='',marker='o',edgecolors='green',linewidths=3)
    plt.show()
五、初始化K点
def randCent(dataSet,k):
    n = np.shape(dataSet)[1]#获取维度数
    centroids = np.array(np.zeros((n,2)))#创建一个k*n的矩阵,初始值为0
    for j in range(n):
        minJ = np.min(dataSet[:,j])#获取每一维度的最小值
        rangeJ = float(np.max(dataSet[:,j])-minJ)#获得最大间隔,最大值➖最小值
        centroids[:,j] = minJ+rangeJ*np.random.rand(k,1)#最小值加上间隔*[0,1]范围的数
        #每进行一次循环,给每一整列赋值。
    return centroids
六、执行算法逻辑主题,即上述步骤 2、3
def kMeans(dataSet,k,distMeans=distEclud,createCent = randCent):
    m = np.shape(dataSet)[0]#获取数据的个数
    clusterAssment = np.array(np.zeros((m,2)))#创建一个m行2列的矩阵用于存储索引值和距离
    centroids = createCent(dataSet,k)#随机选取两个点
    plt.scatter([centroids[0][0]],[centroids[0][1]],color='',marker='o',edgecolors='red',linewidths=3)
    plt.scatter([centroids[1][0]],[centroids[1][1]],color='',marker='o',edgecolors='green',linewidths=3)
    plt.plot(dataSet[:,0],dataSet[:,1],'o',color='yellow')
    plt.show()
    clusterChanged = True#标志符,判定数据点的所属关系有没有发生变化
    flag=1
    while clusterChanged:
        print("当前迭代次数为:{}".format(flag))
        flag+=1
        clusterChanged=False
        for i in range(m):#m为数据量的个数
            minDist = 10000#设置一个最大值
            minIndex = -1#初始化索引
            for j in range(k):#k为划分的种类数 此for循环给数据点分配所属关系
                distJI = distMeans(centroids[j,:],dataSet[i,:])#距离值
                if distJI<minDist:
                    minDist = distJI
                    minIndex = j
            if clusterAssment[i,0]!=minIndex:#判断所属关系是否发生改变
                clusterChanged=True
            clusterAssment[i,:] = minIndex,minDist**2#这里面存储的是所属关系和序列号
        #print(centroids)
        for cent in range(k):#这个for循环是用来移动分类点的位置,将其移动到所属点的平均值位置
            # print("输出1:",clusterAssment[:,0])
            # print("输出2:",np.nonzero(clusterAssment[:,0]==cent))
            #.A 是将矩阵转化为数组
            ptsInClust = dataSet[np.nonzero(clusterAssment[:,0]==cent)[0]]#取出相同簇的点进行取平均,这里[0]是因为参数的形状为(n,1)
            #np.nonzero 取值不为0的索引值
            centroids[cent,:] = np.mean(ptsInClust,axis=0)#取平均
        showProcess(clusterAssment,centroids)
    return centroids,clusterAssment
全部代码
import numpy as np
import matplotlib.pyplot as plt

def CreatData():
    x1 = np.random.rand(50)*3#0-3
    y1 = [i+np.random.rand()*2-1 for i in x1]
    with open('data.txt','w') as f:
        for i in range(len(x1)):
            f.write(str(x1[i])+'\t'+str(y1[i])+'\n')
def loadDateSet(fileName):
    dataMat=[]
    fr = open(fileName)
    for line in fr.readlines():
        curline = line.strip().split('\t')
        #map函数 对指定的序列做映射,第一个参数是function 第二个是序列
        #此方法可以理解为进行字符串格式转换.这个函数可以深究
        #print(curline)
        #fltLine = float(curline)
        fltLine = map(float,curline)
        dataMat.append(list(fltLine))
    return dataMat

def distEclud(vecA,vecB):
    return np.sqrt(np.sum(np.power((vecA-vecB),2)))
def showProcess(clusterAssment,centroids):
    #显示过程
    Index1 = np.nonzero(clusterAssment[:,0]==0)[0]
    Index2 = []
    for i in range(len(clusterAssment)):
        if i not in Index1:
            Index2.append(i)
    plt.plot(datamat[Index1,0],datamat[Index1,1],'ro')
    plt.plot(datamat[Index2,0],datamat[Index2,1],'go')

    plt.scatter([centroids[0][0]],[centroids[0][1]],color='',marker='o',edgecolors='red',linewidths=3)
    plt.scatter([centroids[1][0]],[centroids[1][1]],color='',marker='o',edgecolors='green',linewidths=3)
    plt.show()
def randCent(dataSet,k):
    n = np.shape(dataSet)[1]#获取维度数
    centroids = np.array(np.zeros((n,2)))#创建一个k*n的矩阵,初始值为0
    print(centroids)
    for j in range(n):
        minJ = np.min(dataSet[:,j])#获取每一维度的最小值
        rangeJ = float(np.max(dataSet[:,j])-minJ)#获得最大间隔,最大值➖最小值
        #print("test2:",centroids[:,j])
        centroids[:,j] = np.array(minJ+rangeJ*np.random.rand(k,1)).reshape(2)#最小值加上间隔*[0,1]范围的数
        #print("test3:",centroids[:,j])
        #每进行一次循环,给每一整列赋值。
    return centroids

def kMeans(dataSet,k,distMeans=distEclud,createCent = randCent):
    m = np.shape(dataSet)[0]#获取数据的个数
    clusterAssment = np.array(np.zeros((m,2)))#创建一个m行2列的数组用于存储索引值和距离
    centroids = createCent(dataSet,k)#随机选取两个点
    print("初始化的矩阵",centroids)
    plt.scatter([centroids[0][0]],[centroids[0][1]],color='',marker='o',edgecolors='red',linewidths=3)
    plt.scatter([centroids[1][0]],[centroids[1][1]],color='',marker='o',edgecolors='green',linewidths=3)
    plt.plot(dataSet[:,0],dataSet[:,1],'o',color='yellow')
    plt.show()
    clusterChanged = True#标志符,判定数据点的所属关系有没有发生变化
    flag=1
    while clusterChanged:
        print("当前迭代次数为:{}".format(flag))
        flag+=1
        clusterChanged=False
        for i in range(m):#m为数据量的个数
            minDist = 10000#设置一个最大值
            minIndex = -1#初始化索引
            for j in range(k):#k为划分的种类数 此for循环给数据点分配所属关系
                distJI = distMeans(centroids[j,:],dataSet[i,:])#距离值
                if distJI<minDist:
                    minDist = distJI
                    minIndex = j
            if clusterAssment[i,0]!=minIndex:#判断所属关系是否发生改变
                clusterChanged=True
            clusterAssment[i,:] = minIndex,minDist**2#这里面存储的是所属关系和序列号
        #print(centroids)
        for cent in range(k):#这个for循环是用来移动分类点的位置,将其移动到所属点的平均值位置
            # print("输出1:",clusterAssment[:,0])
            # print("输出2:",np.nonzero(clusterAssment[:,0].A==cent))
            #.A 是将矩阵转化为数组
            ptsInClust = dataSet[np.nonzero(clusterAssment[:,0]==cent)[0]]#取出相同簇的点进行取平均,这里[0]是因为参数的形状为(n,1)
            #np.nonzero 取值不为0的索引值
            centroids[cent,:] = np.mean(ptsInClust,axis=0)#取平均
        #showProcess(clusterAssment,centroids)
    return centroids,clusterAssment


if __name__ == '__main__':
    CreatData()#生成数据
    datamat =  np.array(loadDateSet('data.txt'))
    centroids,clusterAssment = kMeans(datamat,2)
总结
K-mean均值算法的原理非常简单,就是通过计算数据点距分类点的距离大小来判断所属关系,临界条件就是数据的所属关系不再发生改变。但是这种方式也存在一定的问题,很容易陷入到局部最优解。为了更好的解决这个问题,我们下一章说一下改进后的算法,也就是二分K-均值法。
直达链接:二分K-mean均值算法
另附 python小程序-生成GIF图和分解GIF图:小程序地址

