記事ディレクトリ
気分良ければちょうどいいよ〜
コード
./utils.py
import numpy as np


def fc_forward(x, w, b):
    """z = x @ w + b

    全连接层(full connect)的前向传播"""
    assert w.shape[0] == x.shape[1]
    assert w.shape[1] == b.shape[0]
    return np.matmul(x, w) + b


def fc_backward(x, w, z_grad):
    """z = x @ w + b

    全连接层的反向传播"""
    # x @ w = z
    # -> z.shape = x.shape[0], z.shape[1]
    assert z_grad.shape[0] == x.shape[0]
    assert z_grad.shape[1] == w.shape[1]

    x_grad = z_grad @ w.T
    w_grad = x.T @ z_grad / x.shape[0]  # 除去 batch_size
    b_grad = np.mean(z_grad, 0)

    return x_grad, w_grad, b_grad


def relu_forward(z):
    """a = relu(z)

    relu前向传播"""
    return z * (z > 0)


def relu_backward(z, a_grad):
    """a = relu(z)

    relu反向传播"""
    return a_grad * (z > 0)


def mse(y_true, y_pred):
    """loss = np.mean((y_true - y_pred) ** 2, axis=-1)

    均方误差

    :param y_true: shape = (batch_size, class_num)
    :param y_pred: shape = (batch_size, class_num)
    :return: shape = (batch_size,)"""
    assert y_true.shape == y_pred.shape
    return np.mean((y_true - y_pred) ** 2, axis=-1)


def mse_grad(y_true, y_pred):
    """grad = d_loss/d_y_pred = 2 * (y_true - y_pred) * -y_pred

    :param y_true: shape = (batch_size, class_num)
    :param y_pred: shape = (batch_size, class_num)
    :return: shape = (batch_size, class_num)"""

    assert y_true.shape == y_pred.shape
    return 2 * (y_pred - y_true)
./main.py
from utils import *
import numpy as np
import matplotlib.pyplot as plt
batch_size = 1000
lr = 1e-1
# 1. 准备数据
np.random.seed(0)
x = np.linspace(-1, 1, batch_size).reshape(batch_size, 1)
true = x ** 2 + 2 + np.random.randn(batch_size, 1) * 0.1 # y_true
# 2. 初始化权重与偏置
w1 = np.random.randn(1, 100) * 0.1
w2 = np.random.randn(100, 1) * 0.1
b1 = np.zeros((100,))
b2 = np.zeros((1,))
for i in range(501):
# 1. forward
z = fc_forward(x, w1, b1) # (batch_size, 100)
a = relu_forward(z) # (batch_size, 100)
pred = fc_forward(a, w2, b2) # (batch_size, 1)
# 2. loss
loss = mse(true, pred) # (batch_size,)
# 3. backward
pred_grad = mse_grad(true, pred) # (batch_size, 10)
a_grad, w2_grad, b2_grad = fc_backward(a, w2, pred_grad) # (batch_size, 100), (100, 1), (1,)
z_grad = relu_backward(z, a_grad) # (batch_size, 100)
_, w1_grad, b1_grad = fc_backward(x, w1, z_grad) # (1, 100), (100,)
# 4. update
w1 -= lr * w1_grad # (1, 100)
w2 -= lr * w2_grad # (100, 1)
b1 -= lr * b1_grad # (100,)
b2 -= lr * b2_grad # (1,)
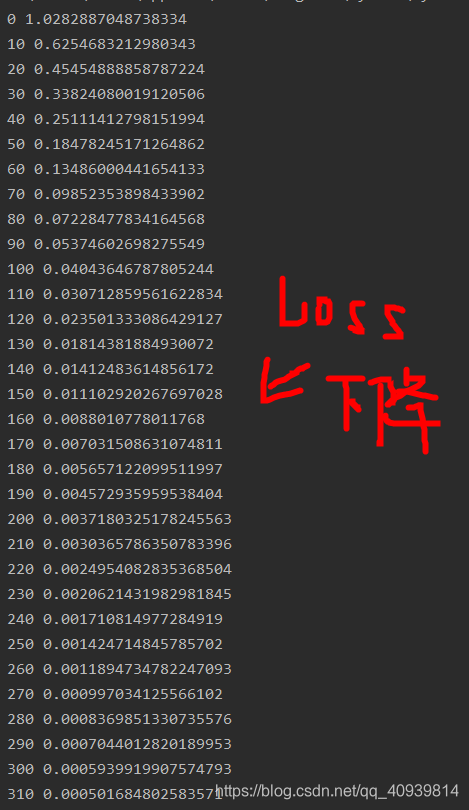
if i % 10 == 0:
print(i, np.mean(loss)) # 500 0.012295234080318703
if i % 100 == 0:
plt.scatter(x, true, 5)
plt.plot(x, pred)
plt.show()
スクリーンショットを実行