1. Topic background
1. Problem background:
Digital payment is developing, but so is cybercrime. Telecommunications fraud cases continue to occur frequently, and the proportion of consumers damaged continues to rise. According to the report, 64% of the respondents used their mobile phone numbers to register multiple accounts at the same time, including financial accounts, social accounts and consumer accounts, etc., and more than half of them encountered telecom fraud and suffered losses. Register financial accounts and other accounts with mobile phones at the same time. In the event of information leakage, criminals are more likely to take over financial payment accounts and steal funds.
With the acceleration of mobile payment product innovation, all kinds of mobile payments are showing a trend of differentiation among consumer groups. The rich mobile application scenarios of third-party payment are preferred by young people. The increase in payment methods also makes personal information very easy to be stolen by criminals. . According to the Data Breach Index, more than 5 million records are stolen every day, a worrying statistic that shows how common fraud remains for both card-present and card-not-present types of payments.
In today's digital world, where trillions of card transactions occur every day, detecting fraudulent activity is a serious challenge.
2. Data description:
The data comes from some anonymous data collection agencies. The data has seven features and a list of class labels. Here is some simple explanation of the data characteristics (the meaning of each column is not important to us, but for machine learning, it can easily discover the meaning. It is a bit abstract, but it does not need to really understand each What a feature really is. Just understand how to use it so your model can learn. Many datasets, especially in the financial domain, often hide what a piece of data represents because it's sensitive information. Data owners don't want Let others know, and the data developer has no legal right to know)
➢ distance_from_home: the distance between the bank card transaction location and home;
➢ distance_from_last_transaction: the distance from the last transaction;
➢ ratio_to_median_purchase_price: the ratio of the last transaction to the median price of previous transactions;
➢ repeat_retailer: whether the transaction occurred at the same merchant;
➢ used_chip: the transaction was conducted by chip (bank card);
➢ used_pin_number: whether the PIN was used during the transaction
➢ online_order : whether it is an online transaction order;
➢ fraud: fraudulent behavior (classification label);
3. Solve the problem:
1) Use a variety of machine learning models for data mining to model a given data set;
2) Further mine and analyze the sample data, adjust the parameters of different models through cross-validation and grid tuning, find the optimal solution, and further compare multiple optimal models;
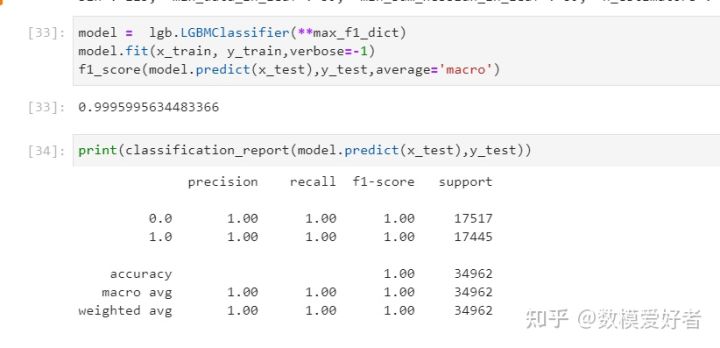
3) Through the precision (prediction accuracy), recall (recall rate), f1-score (F1 score value), and give the reason for choosing a certain prediction model;
4) Visualize the model performance evaluation through various graphing methods
2. Overall thinking and explanation of scoring points
This question is a classification question, there are no other questions, so it is a standard machine learning regression process, the specific process is as follows:
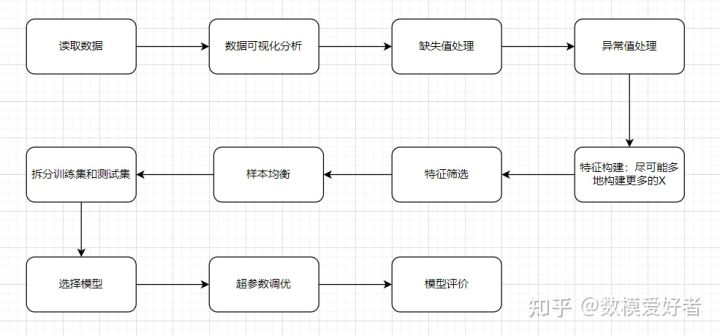
Focus on some bonus items:
- [Select Model] Use multiple models for comparison
- [Hyperparameter tuning] Use heuristic algorithm to find the optimal solution
- [Sample Balance] Rationality and Effect
3. Specific solution steps
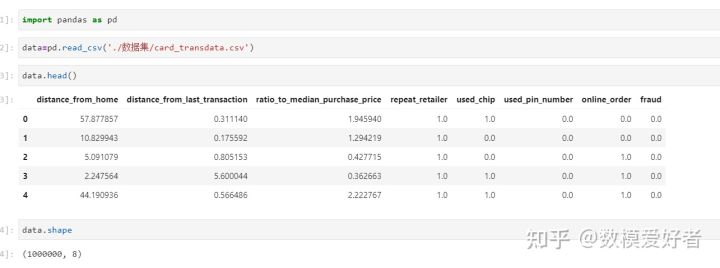
step1: read the attachment data;
You can use pandas to read the attached data. The data is very standard. You can see that there are 100W rows of data and 8 columns of data.
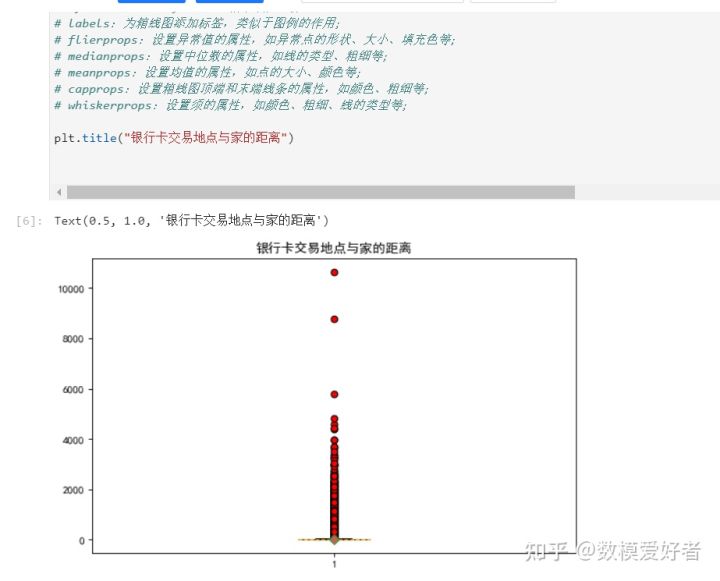
step2: data visualization analysis;
Here you can draw your own through pie charts, frequency distribution histograms, and box plots to view the data distribution
step3&4: Missing value processing & abnormal value processing;
To deal with missing values and outliers, generally speaking, missing values are also considered outliers (isn’t a null value an outlier value), and the outliers can be identified first, either through the percentile identification method or the 3σ identification method, Then use the padding.
step5: feature construction
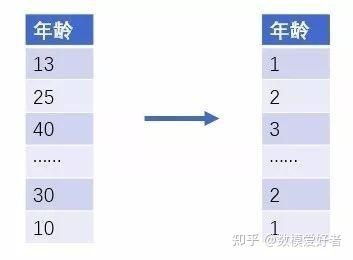
Binning and partitioning can be used
Sometimes, it makes more sense to convert numerical attributes into categories, and at the same time, it can make the algorithm reduce the interference of noise by dividing the values in a certain range into definite blocks. For example, we predict whether a person owns a certain type of clothing, where age is an exact factor. In fact, the age group is a more relevant factor, so we can divide the age distribution into age groups such as 1-10, 11-18, 19-25, 26-40, respectively representing four age groups: infants, teenagers, youth, and middle-aged groups so that similar age groups exhibit similar attributes. In addition, we can also do some statistical fields for binning and partitioning as data characteristics.
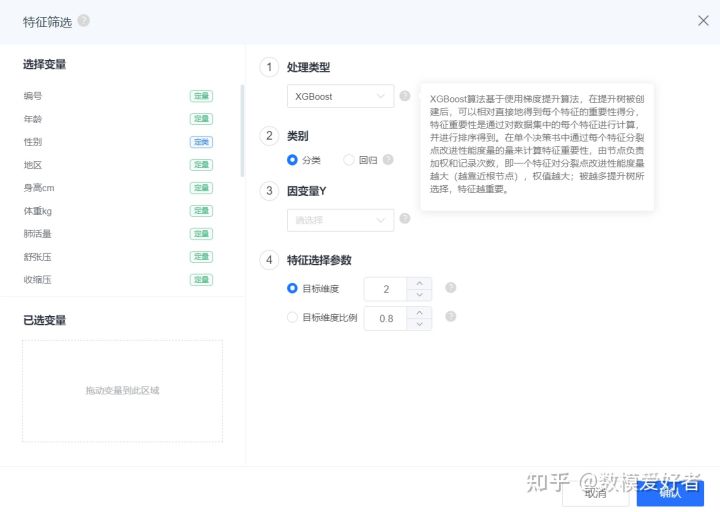
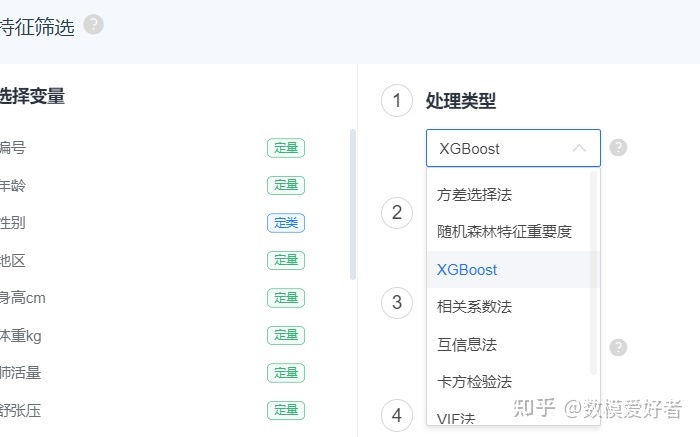
step6: feature screening
You can refer to the feature screening of SPSSPRO
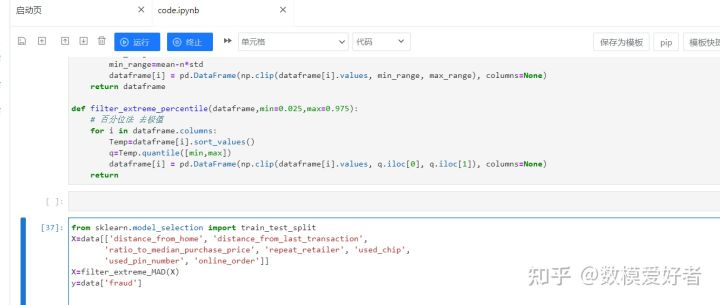
step7: sample equalization
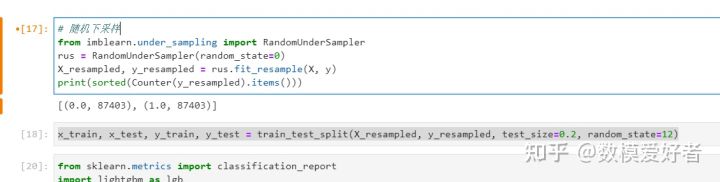
step8: split training set and test set
,

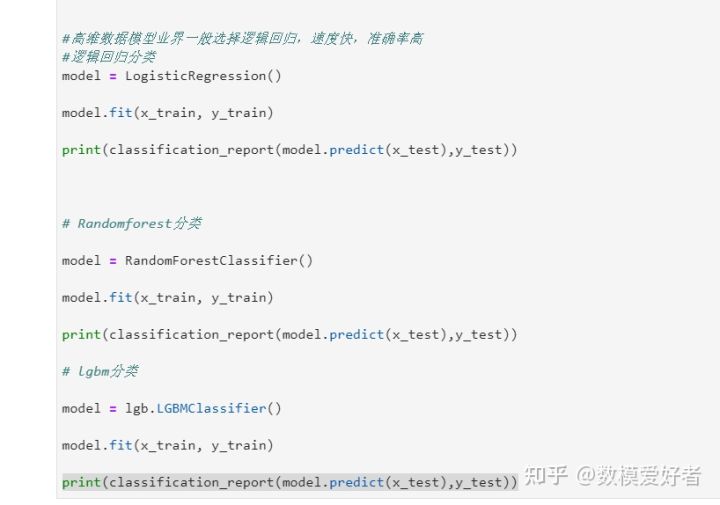
step9: select model
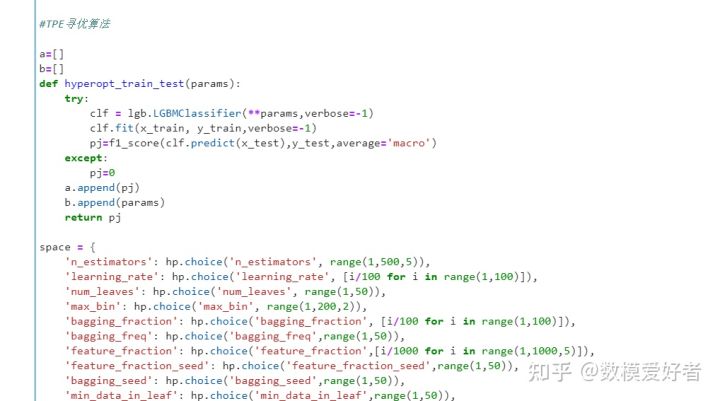
step9: hyperparameter tuning
step10: model evaluation