When it comes to data visualization graphics, our first thought should be matplotlib library, which can
axesinvoke different drawing methods (such as objects, etc.axes.plot()).
Data analysis used as pandas library providesSeriesDataFramean object type and the like, we can call the target for drawing (e.g.,Series.plot()).
This article describes the association between the library and drawing similarities and differences between them.
1. association
- Pandas library provides
SeriesDataFramean object type and the like can be used as data sources into matplotlib Paint parameters, such asaxes.plot(Series) - Can call the method of drawing objects Pandas, such as
Series.plot(kind='line'), but in the final analysis the matplotlib related pandas is automatically help you generateaxesobjects. - Pandas we can draw out of the map back to the specified
axesobject, such asSeries.plot(kind='line', ax=ax1)took this picture in the broken lineax1on the object.
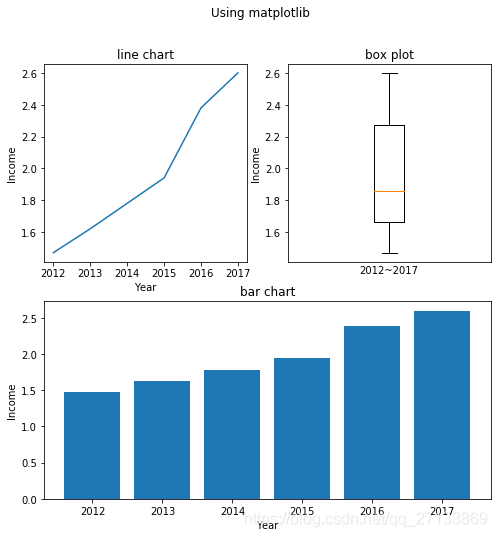
The following two methods using the drawing I Drawing matplotlib Pandas and draw the same piece of many children Chart
matplotlib method:
import matplotlib.pyplot as plt
from pandas import Series
data = Series([1.47,1.62,1.78,1.94,2.38,2.60],index=['2012','2013','2014','2015','2016','2017'])
#实例化fig1对象
fig1=plt.figure(figsize=(8,8),facecolor='w')
#实例化ax对象
ax1 = fig1.add_subplot(2,2,1)
ax2 = fig1.add_subplot(2,2,2)
ax3 = fig1.add_subplot(2,1,2)
#ax对象画图
  #画ax1
ax1.plot(data)#注意对象名是ax1,它是matplotlib中的axes对象类型
ax1.set_title('line chart')
ax1.set_xlabel('Year')
ax1.set_ylabel('Income')
  #画ax2
ax2.boxplot(data)
ax2.set_xticks([])
ax2.set_title('box plot')
ax2.set_xlabel('2012~2017')
ax2.set_ylabel('Income')
  #画ax3
ax3.bar(data.index, data)
ax3.set_title('bar chart')
ax3.set_xlabel('Year')
ax3.set_ylabel('Income')
#设置fig1标题
fig1.suptitle('Using matplotlib')
Pandas method:
import matplotlib.pyplot as plt
from pandas import Series
data = Series([1.47,1.62,1.78,1.94,2.38,2.60],index=['2012','2013','2014','2015','2016','2017'])
#实例化fig1对象
fig2=plt.figure(figsize=(8,8),facecolor='w')
#实例化ax对象
ax4 = fig2.add_subplot(2,2,1)
ax5 = fig2.add_subplot(2,2,2)
ax6 = fig2.add_subplot(2,1,2)
#用pandas绘图并将图像回传给ax对象
  #画ax4
data.plot(kind='line',ax=ax4)#注意对象名是data,它是Pandas中的Series对象类型
ax4.set_title('line chart')
ax4.set_xlabel('Year')
ax4.set_ylabel('Income')
  #画ax5
data.plot(kind='box',ax=ax5)
ax5.set_xticks([])
ax5.set_title('box plot')
ax5.set_xlabel('2012~2017')
ax5.set_ylabel('Income')
  #画ax6
data.plot(kind='bar',ax=ax6)
ax6.set_title('bar chart')
ax6.set_xlabel('Year')
ax6.set_ylabel('Income')
#设置fig2标题
fig2.suptitle('Using Pandas')
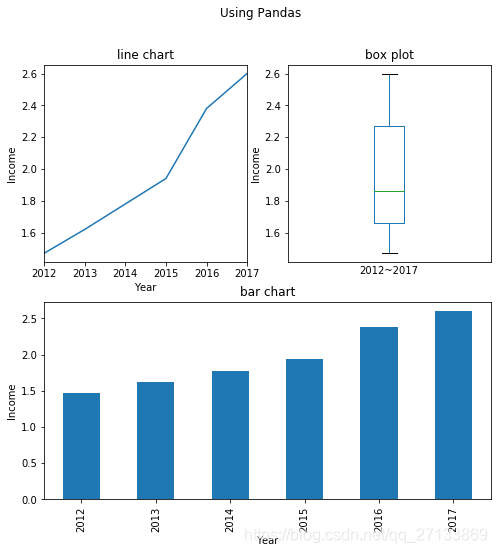
The above two examples can be seen in the drawing, and calls call Pandas matplotlib drawing many times to achieve the same effect
2. Different points
Carefully draw a histogram analysis of two statements ax3.bar(data.index, data)and data.plot(kind='bar',ax=ax6)
find the call ax3when drawing bar()method there are two arguments data.indexand data, respectively, the x-axis of this chart category and the y-axis height.
And when the pandas with a drawing, we only use the dataobjects on the front, it can automatically recognize the datainside indexand value.
从上面也可以看出来,对于用Series DataFrame这些用Pandas对象封装的多维的数据,调用Pandas绘图会有更方便和更好的支持。
下面再举一例:
我们有一个DataFrame类型的人员信息表格,每一行包含一个人的性别,收入等信息。现在我要按照性别分类,画出女性的收入的箱线图和男性收入的箱线图:
import pandas as pd
df = pd.read_csv('Data/bank-data.csv',index_col=0)
df
| age | sex | region | income | married | children | car | save_act | current_act | mortgage | pep | |
|---|---|---|---|---|---|---|---|---|---|---|---|
| id | |||||||||||
| ID12101 | 48 | FEMALE | INNER_CITY | 17546.00 | NO | 1 | NO | NO | NO | NO | YES |
| ID12102 | 40 | MALE | TOWN | 30085.10 | YES | 3 | YES | NO | YES | YES | NO |
| ID12103 | 51 | FEMALE | INNER_CITY | 16575.40 | YES | 0 | YES | YES | YES | NO | NO |
| ID12104 | 23 | FEMALE | TOWN | 20375.40 | YES | 3 | NO | NO | YES | NO | NO |
| ID12105 | 57 | FEMALE | RURAL | 50576.30 | YES | 0 | NO | YES | NO | NO | NO |
| ... | ... | ... | ... | ... | ... | ... | ... | ... | ... | ... | ... |
| ID12696 | 61 | FEMALE | INNER_CITY | 47025.00 | NO | 2 | YES | YES | YES | YES | NO |
| ID12697 | 30 | FEMALE | INNER_CITY | 9672.25 | YES | 0 | YES | YES | YES | NO | NO |
| ID12698 | 31 | FEMALE | TOWN | 15976.30 | YES | 0 | YES | YES | NO | NO | YES |
| ID12699 | 29 | MALE | INNER_CITY | 14711.80 | YES | 0 | NO | YES | NO | YES | NO |
| ID12700 | 38 | MALE | TOWN | 26671.60 | NO | 0 | YES | NO | YES | YES | YES |
600 rows × 11 columns
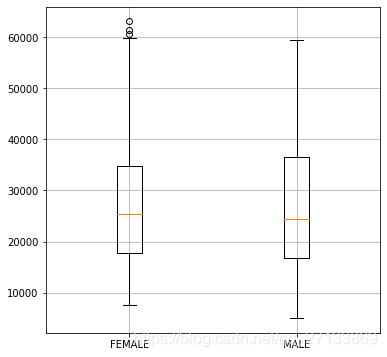
如果要用matplotlib绘图的话,就必须对DataFrame进行有条件的筛选切片,选出来所有女性的income列和男性的income列,然后再画箱线图:
fig7 = plt.figure(figsize=(6,6),facecolor='w')
ax7 = plt.axes()
ax7.boxplot( (df.loc[df['sex']=='FEMALE', 'income'], df.loc[df['sex']=='MALE', 'income']),
            labels=('FEMALE','MALE'))
ax7.grid()
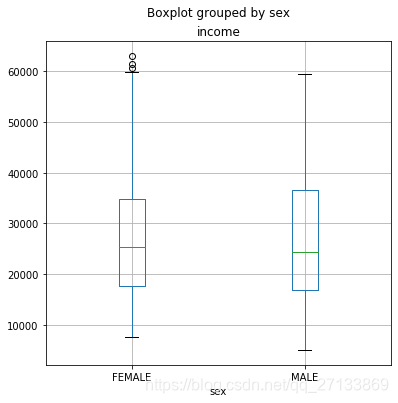
如果使用Pandas绘图的话,只需以df作为对象放在前面,调用boxplot()方法,并将'income',by='sex'填入参数里即可,相当于是Pandas自动帮你切片出income这一列,并以sex归类聚合了,比调用matplotlib方便不少,也直观很多:
fig8 = plt.figure(figsize=(6,6),facecolor='w')
ax8 = plt.axes()
df.boxplot('income', by='sex',ax=ax8)#对于多类别,需要聚合的数据,用pandas调用绘图要比axex调用绘图来得方便
3.总结
In most cases we can choose Pandas matplotlib drawing and graphics to achieve the same function, but also inextricably linked between them.
In some multidimensional data Pandas package (e.g. DataFrame), the drawing will be more convenient to call Pandas and better support, eliminating the need for manual slicing, troubles such as aggregate data.
Find useful, do not begrudge comment like share point oh, I hope you forgive me, have any questions please correct me to discuss.
Based on CC-BY-SA 4.0 protocol, welcome to reprint
(blog get tired? Go to my station B dude?)
