First, what is the JVM tuning?
The so-called JVM tuning refers to adjusting the Java Virtual Machine heap memory size. Then the memory settings that how to set it? Set much more appropriate, not a waste of memory, without affecting performance?
Analysis: The principle is based on the recommendation to be set according to a formula inside the Java Performance.
Specifically:
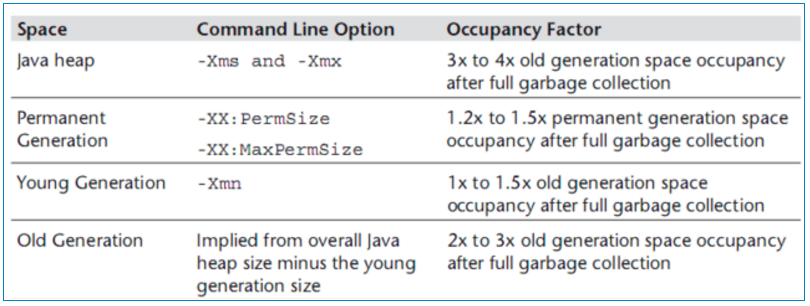
Java heap size throughout the set, Xmx and Xms set 3-4 times the object's survival years old, that is 3-4 times the memory occupied by the old years after FullGC
Permanent behalf PermSize and MaxPermSize set 1.2-1.5 times the survival object to the old era.
Xmn survival of the young generation set target for 1-1.5 years old times.
Old's memory size is set 2-3 times the survival object to the old era.
Description:
1, Sun official suggested the young generation size is about 3/8 of the entire stack, so in the manner set out above, in line with Sun's recommendation.
2, the young generation heap size = size + size of the old generation, that xmx = xmn + years old size. Permsize does not affect the heap size.
3, why should it be set in accordance with the above come? No specific explanation, but it should be after a conclusion according to various tuning.
Second, how to confirm the survival of the object's old size?
Mode 1 (Recommended / more secure):
Adding JVM arguments log in GC, GC log will record each generation of memory size after each FullGC, observe space after years old GC. Memory can be observed FullGC situation after a period of time (such as two days), and to estimate the size of the object survived after FullGC old age (after many FullGC according to the spatial memory of old age after many times the size of the data FullGC size averaged)
Mode 2 :( mandatory trigger FullGC, will affect the online service, with caution)
1 more feasible manner, but need to change JVM parameters, and analyze the log. Also, when using the CMS collector, there may not trigger FullGC (only happen CMS GC), so the log does not FullGC logging. It is more difficult to handle at the time of analysis.
So, sometimes we need to force trigger a FullGC, to observe old's survival after FullGC object size.
Note: mandatory trigger FullGC, online services will cause pause (STW), be careful, it is recommended mode of operation is, first service node removed before the mandatory FullGC, then hung back service available nodes after FullGC, external services
FullGC triggered at different times, after years old according to estimates FullGC old's memory situation after surviving multiple FullGC object size
Third, how to trigger FullGC?
Jmap use tool that can trigger FullGC
jmap -dump: live, format = b, file = heap.bin <pid> will dump the current live objects to a file, then triggers FullGC
jmap -histo: live <pid> Print the number of instances of each class of memory footprint, the full name of the object class number information .live sub-parameters plus, only this time live statistics will trigger FullGC.
IV Summary
In the case of relatively tight memory may be memory tune the manner described above, a memory to find a set of acceptable frequency on the GC and GC consuming, can meet the current service need less memory
But memory is a relatively well-off, they can increase relative to the service a little more than a memory, can reduce the frequency of GC, GC will increase the number of corresponding time-consuming.
General requirements for low-latency may be considered a multi-bit memory disposed on delay less demanding, less memory may be provided as described above.
Added: permanent generation (zone method) is not in the stack, so there are a whole heap size = before the young generation read an article described the old generation + + permanent generation description is incorrect.