1. color space conversion
There are more than 150 OpenCV color space conversion method. But we will study only the two most widely used, BGR↔Gray and BGR↔HSV, BGR and grayscale conversion using cv2.COLOR_BGR2GRAY,
BGR and HSV conversion using cv2.COLOR_BGR2HSV. In the HSV space, H represents hue / chroma range [0,179], S represents the saturation range [0,255], V represents luminance range [0,255]. But different values for different software
dst = cv.cvtColor( src, code[, dst[, dstCn]] )
parameter:
src: an input image: unsigned 8-bit, 16-bit unsigned (... CV_16UC), or a single-precision floating point.
code: conversion mode
dst: the same depth of the original image size of the output image. Can be omitted
dstCn: Standard image channel number, the default is 0, represented by the src and determined code.
Print all the code:
import cv2 as cv


flags = [i for i in dir(cv) if i.startswith('COLOR_')]
print(flags)
Function Description:
This function converts the input image from one color space to another color space.
For example
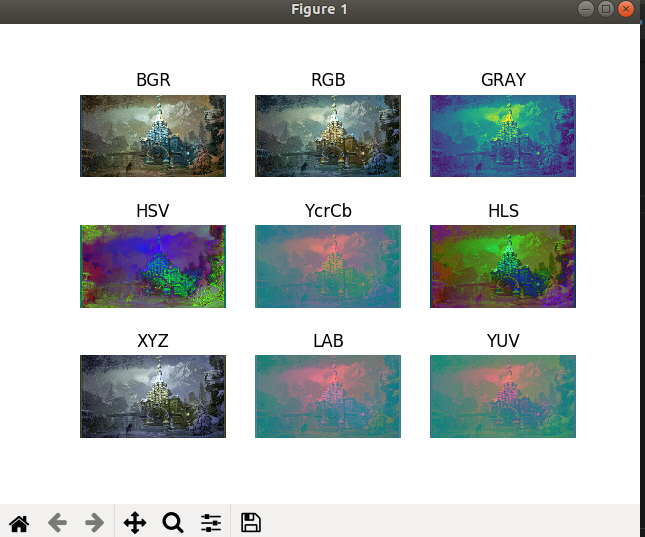
import matplotlib.pyplot as plt
import cv2

img_BGR = cv2.imread('2.jpg')  # BGR
plt.subplot(331), plt.imshow(img_BGR), plt.axis('off'), plt.title('BGR')

img_RGB = cv2.cvtColor(img_BGR, cv2.COLOR_BGR2RGB)
plt.subplot(332), plt.imshow(img_RGB), plt.axis('off'), plt.title('RGB')

img_GRAY = cv2.cvtColor(img_BGR, cv2.COLOR_BGR2GRAY)
plt.subplot(333), plt.imshow(img_GRAY), plt.axis('off'), plt.title('GRAY')

img_HSV = cv2.cvtColor(img_BGR, cv2.COLOR_BGR2HSV)
plt.subplot(334), plt.imshow(img_HSV), plt.axis('off'), plt.title('HSV')

img_YcrCb = cv2.cvtColor(img_BGR, cv2.COLOR_BGR2YCrCb)
plt.subplot(335), plt.imshow(img_YcrCb), plt.axis('off'), plt.title('YcrCb')

img_HLS = cv2.cvtColor(img_BGR, cv2.COLOR_BGR2HLS)
plt.subplot(336), plt.imshow(img_HLS), plt.axis('off'), plt.title('HLS')

img_XYZ = cv2.cvtColor(img_BGR, cv2.COLOR_BGR2XYZ)
plt.subplot(337), plt.imshow(img_XYZ), plt.axis('off'), plt.title('XYZ')

img_LAB = cv2.cvtColor(img_BGR, cv2.COLOR_BGR2LAB)
plt.subplot(338), plt.imshow(img_LAB), plt.axis('off'), plt.title('LAB')

img_YUV = cv2.cvtColor (img_BGR, cv2.COLOR_BGR2YUV)
plt.subplot ( 339), plt.imshow (img_YUV), plt.axis ( ' OFF ' ), plt.title ( ' the YUV ' )
plt.show ()

CV2. imshow ( ' Gray ' , img_GRAY)

K = cv2.waitKey (0)   # is always detected keyboard
IF K == 27:   # press ESC exit
    cv2.destroyAllWindows ()