
Building a complete and comprehensive indicator system is the first step for enterprises to use data to guide business operations decisions. But after setting the indicators, the monitoring of the indicators is often ignored by everyone. When indicators fluctuate abnormally (up or down), companies need to be able to detect them in time and quickly find the real reasons behind them, so that they can formulate corresponding strategies. Otherwise, they will just hit the target blindly and go around in circles.
Specific scenarios where indicators fluctuate abnormally, such as:
· The search traffic of enterprise keywords suddenly decreased. What is the reason?
· The GMV figure in March dropped by 40% from February. How should we analyze it?
· The number of orders in a certain category has increased sharply recently. Why?
Then, this article will introduce in detail how to establish a complete indicator anomaly monitoring and corresponding attribution analysis mechanism, so that when you encounter such problems in the future, you can quickly discover business problems and opportunities from the data and improve the speed of business advancement.
Detection of indicator anomalies based on statistical analysis
The daily data trends of enterprises will fluctuate up and down within a certain range, but the floating ranges of different indicators will be different. When the business is in a period of rapid growth, the daily fluctuation range of indicators is larger; when the business is in a stable period, the daily fluctuation range of indicators is smaller; the coarser the statistical granularity, the larger the amount of data, and the smaller the volatility of statistical results. Therefore, different standards need to be used for different indicators to measure whether there are abnormalities in indicator fluctuations.
There are three main methods for monitoring indicator anomalies:
· Threshold setting based on actual business experience
· Perform statistical analysis based on data results
· Integrate algorithms into modeling predictions
This article will mainly introduce how to evaluate whether indicator fluctuations are abnormal based on statistical analysis methods .
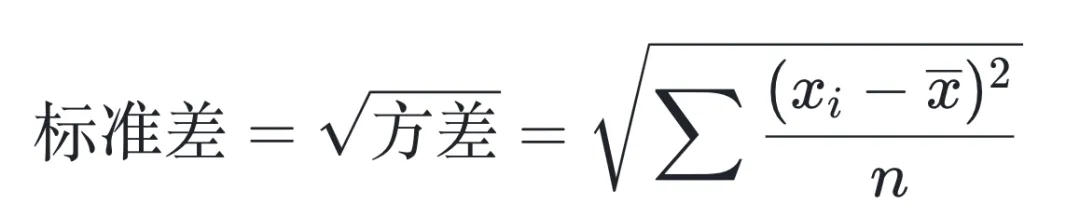
In statistics, the data distribution of indicators usually satisfies the normal distribution . The normal distribution is symmetrical and uses two data: mean and standard deviation. The mean can reflect the average level of the data, and the standard deviation can reflect the fluctuation range of the data. The larger the standard deviation, the greater the volatility of the data. The formula for calculating standard deviation is as follows:
The position of the data in the normal distribution can be used to determine whether the indicator fluctuations are in line with expectations. In the normal distribution, the probability that the data is distributed within 2 times the standard deviation is 95.5%, and the probability that it is within 3 times the standard deviation is 99.7%. In daily life, 2 times the standard deviation can be used as a measurement standard.
Normal data results will fluctuate within the range of the mean ±2* standard deviation. If the actual data exceeds this range, the data fluctuation is considered abnormal.
Daily data fluctuation patterns will have the same or similar patterns of change in units of days, weeks, months, and years. Here, we take the daily activity indicator as an example to illustrate the monitoring process of abnormal indicator fluctuations.
The daily activity indicator of a certain game APP usually fluctuates on a weekly basis. We now plan to determine whether there are abnormal fluctuations in this Monday's daily activity data based on the data trends of the past five weeks.
Data preparation is as follows:
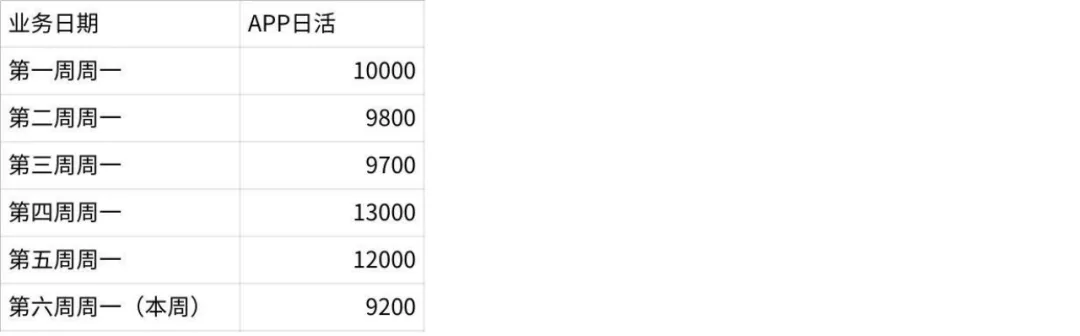
The average value of Mondays in the first five weeks of the above data is: 10900, standard deviation: 1507. The 2 times standard deviation of the data are 7887 and 13913 respectively. The data on Monday this week is 7700. If it is outside the 2 times standard deviation range, it means that the activity on one day this week is The indicator data fluctuates abnormally, and further analysis is required to determine whether the abnormal fluctuations are truly abnormal in the business.
Attribution analysis of indicator changes
There are many attribution methods for indicator changes , which can be summarized into two categories: horizontal attribution analysis and vertical attribution analysis.
Horizontal attribution analysis
Horizontal attribution analysis means that for combined indicators, the process indicators can be split, the fluctuation influencing factors of each process indicator can be analyzed, and then the multiple influencing factors can be integrated and analyzed.
如:昨日的付费金额显著增高。分析增高原因时,先对付费金额做工时拆解:付费金额 = 日活 * 平均付费金额,平均付费金额在正常范围内波动,日活显著增加,进一步对相关业务做分析,发现是昨日买量增加带来的结果影响。
vertical attribution analysis
Vertical attribution analysis is to perform attribution analysis on indicators through dimension drill-down . Dimension drill-down analysis mainly includes two analysis granularities: one is to analyze the contribution of each dimension to the indicator, and the other is to analyze the contribution of the dimension value to the indicator.
The calculation of the contribution degree of a dimension can be calculated based on the summary of the contribution degree of each dimension value. There are many calculation methods for calculating the contribution degree of each dimension value. The calculation of the contribution degree can be based on various methods such as prediction algorithms. This article introduces a simple method to calculate the degree of contribution based on the average growth rate.
Under a single dimension, the contribution of each dimension value can be calculated by the following formula:
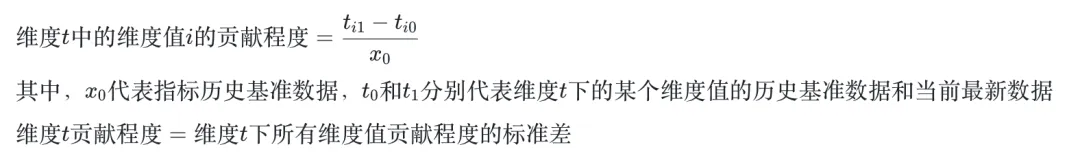
Next, take sales as an example to introduce the calculation process.
The sales of a certain product line on January 1 and January 2 were 30.97 million yuan and 33 million yuan respectively. Broken down to the city dimension, the two-day data performance of each city is as follows:

In the city dimension:
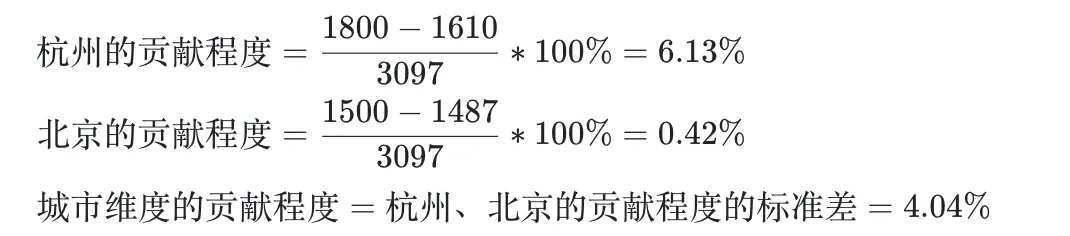
Based on the above steps, the calculation of dimension contribution and dimension value contribution can be simply realized.
Intelligent indicator fluctuation monitoring & intelligent attribution analysis
In actual data scenarios, the number of dimension values in each dimension ranges from tens to hundreds to thousands. Calculating the dimension contribution manually every day will be a huge workload. The analysis efficiency is too low, which makes it easy for business parties to draw conclusions based on experience. If the inference is wrong, wrong decisions will most likely be made.
The intelligent indicator fluctuation monitoring and intelligent attribution analysis functions of Kangaroo Cloud Indicator Platform can quickly and comprehensively help users track business performance, thereby further promoting business development.
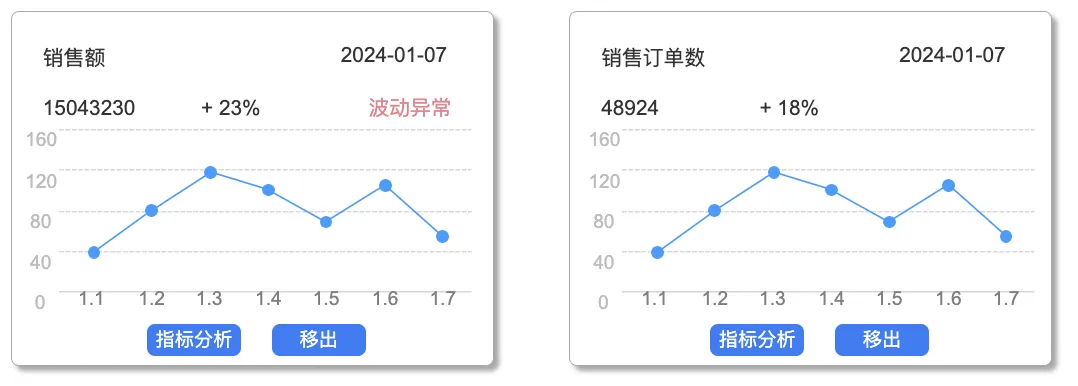
View indicator dashboard
For indicators that the enterprise is concerned about, indicators can be added to the attention board for daily data observation and monitoring. In the dashboard, you can visually view the current data performance and recent data trends of all indicators. The system will make intelligent diagnosis based on the current data to determine whether the indicator fluctuations are normal fluctuations, help users quickly locate abnormal data, and analyze and respond to data changes in a targeted manner.
Metric attribution analysis
When an indicator result is abnormal, it is a lot of work to perform attribution analysis on dimensions and dimension values in sequence. Being able to systematize analysis methods and processes will greatly improve the efficiency of attribution analysis and have an extremely positive role in promoting business development.
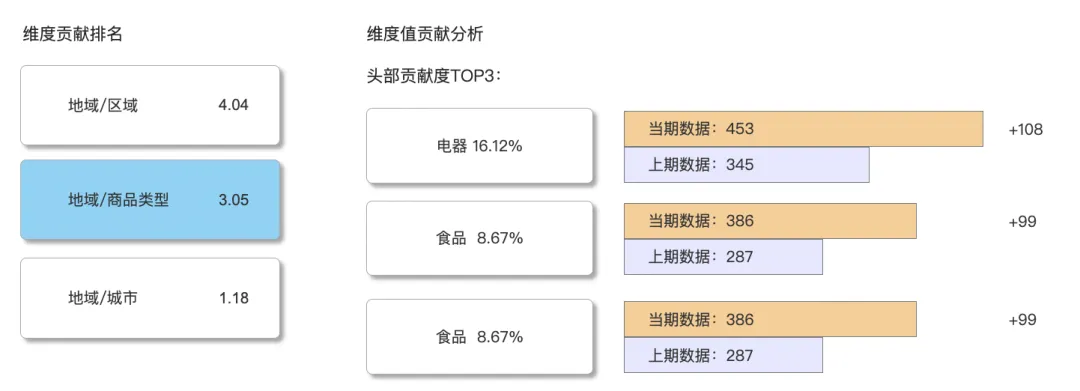
When performing indicator attribution analysis, the system will differentiate between dimension value calculation indicator fluctuations, further calculate the dimension contribution, and sort them in descending order according to the contribution, allowing users to focus on the more important influencing factors.
Under the dimension of concern, users can further check the contribution of subdivided dimension values, quickly discover the reasons for data changes, and promote business improvement through data.
Click the link below to try [ Indicator Management Platform ] for free: https://www.dtstack.com/easydigit/dataindex?src=szsm
"Industry Indicator System White Paper" download address: https://www.dtstack.com/resources/1057?src=szsm
"Dutstack Product White Paper" download address: https://www.dtstack.com/resources/1004?src=szsm
"Data Governance Industry Practice White Paper" download address: https://www.dtstack.com/resources/1001?src=szsm
For those who want to know or consult more about big data products, industry solutions, and customer cases, visit the Kangaroo Cloud official website: https://www.dtstack.com/?src=szkyzg
Linus took it upon himself to prevent kernel developers from replacing tabs with spaces. His father is one of the few leaders who can write code, his second son is the director of the open source technology department, and his youngest son is an open source core contributor. Robin Li: Natural language will become a new universal programming language. The open source model will fall further and further behind Huawei: It will take 1 year to fully migrate 5,000 commonly used mobile applications to Hongmeng. Java is the language most prone to third-party vulnerabilities. Rich text editor Quill 2.0 has been released with features, reliability and developers. The experience has been greatly improved. Ma Huateng and Zhou Hongyi shook hands to "eliminate grudges." Meta Llama 3 is officially released. Although the open source of Laoxiangji is not the code, the reasons behind it are very heart-warming. Google announced a large-scale restructuring