Logs are an important reference for handling production failures, performance optimization, and business analysis, and are an indispensable part of the stable operation of the system. With the rapid expansion of business system scale, especially the gradual popularization of micro-service architecture, a system may involve multiple application modules and service instances. It is extremely difficult and inefficient for operation and maintenance personnel to locate problems in the traditional mode.
When server resources increase, various types of system logs, business logs, component logs, and container logs are scattered on different devices, making troubleshooting extremely difficult. Therefore, it is particularly necessary to build an efficient and unified log center capability. This article mainly studies the real-time log analysis platform based on ELK architecture.
1. Architecture design
ELK is the abbreviation of three components, representing Elasticsearch, Logstash, and Kibana respectively. Elasticsearch is an open source distributed search engine that provides three major functions: collecting, analyzing, and storing data. Logstash is mainly a tool for collecting and filtering logs. The disadvantage is that it consumes a lot of performance.
Kibana can provide a visual interface for log analysis for Logstash and ElasticSearch, which can help summarize, analyze and search important data logs. At the same time, with the development of the ELK ecosystem, Beats log collection tools are involved, among which the lightweight log collection tool FileBeat is mostly used.

This architecture is suitable for production-level high concurrent log collection requirements.
-
Collection end : Use the lightweight filebeat component for log collection to collect real-time data generated by various data sources such as servers, containers, and applications.
-
Message queue : The Kafka message queue mechanism is introduced to solve the IO performance bottleneck and scalability problems caused by log reading in high-concurrency and large-scale scenarios.
-
Processing end : Logstash consumes the data in the Kafka message queue. After log filtering and analysis, the data is transferred to the ES cluster for storage.
-
Storage : Elasticsearch is used for log storage services, receiving data processed in logstash log format, commonly used index templates to store different types of logs, compressing and storing data in fragments and providing various APIs for user query and operation.
-
Display side : Use Kibana to retrieve log data in Elastisearch, visualize log information through views, tables, dashboards, maps, etc., and provide log analysis and retrieval services.
2. Log collection
Log collection types are mainly divided into three types:
-
System log : System operation log includes message and secure, etc.
-
Service logs : such as normal database operation logs, error logs, slow query logs, etc.
-
Business log : Most of the application running core logs are Java log Log4j
There are two main types of log collection methods: ⬇️
1) File method
filebeat.ymlCore configuration example
filebeat.inputs:- type: logenabled: falsepaths:- /tmp/*.logtags: ["sit","uat"]fields:role: "云原生运维"date: "202308"- type: logenabled: truepaths:- /var/log/*.logtags: ["SRE","team"]---------------------------output.elasticsearch:enabled: truehosts: ["192.168.0.1:9200","192.168.0.2:9200","192.168.0.3:9200"]index: "cmdi-linux-sys-%{+yyyy.MM.dd}"setup.ilm.enabled: falsesetup.template.name: "dev-linux"setup.template.pattern: "dev-linux*"setup.template.overwrite: falsesetup.template.settings:index.number_of_shards: 3index.number_of_replicas: 2
Configuration instructions: ⬇️
type is used to identify the log type
enabled is used to identify whether the collection of this item is enabled
path is used to configure the collection log path, and the log file is adapted through the fuzzy matching mode
tag is used to identify the label
output.elasticsearch This part is the configuration of the log storage service, here Index templates using copy and sharding mechanisms to receive different types of log storage requirements, and elasticsearch storage authentication services can be added as needed.
2) Kubernetes cluster method
In order to adapt to the changing log collection requirements of Pod services in the Kubernetes environment, dynamic log collection needs to be designed.
Step 1) Create sa
apiVersion: v1kind: ServiceAccountmetadata:name: filebeatnamespace: kube-systemlabels:app: filebeat
Step 2) RBAC-based role control setting
apiVersion: rbac.authorization.k8s.io/v1kind: ClusterRoleBindingmetadata:name: filebeatsubjects:- kind: ServiceAccountname: filebeatnamespace: kube-systemroleRef:kind: ClusterRolename: filebeatapiGroup: rbac.authorization.k8s.io---apiVersion: rbac.authorization.k8s.io/v1kind: RoleBindingmetadata:name: filebeatnamespace: kube-systemsubjects:- kind: ServiceAccountname: filebeatnamespace: kube-systemroleRef:kind: Rolename: filebeatapiGroup: rbac.authorization.k8s.io
Step 3) CM file settings
data:filebeat.yml: |-filebeat.inputs:- type: containerpaths:- /var/log/containers/*.logprocessors:- add_kubernetes_metadata:in_cluster: truematchers:- logs_path:logs_path: "/log/containers/"- drop_event.when.not:or:- equals.kubernetes.namespace: sit-devoutput.elasticsearch:hosts: ['192.168.0.1:9200', '192.168.0.2:9200', '192.168.0.3:9200']index: "sit-%{[kubernetes.container.name]:default}-%{+yyyy.MM.dd}"setup.template.name: "sit"setup.template.pattern: "sit-*"
Step 4) Deploy daemonset collection service
containers:- name: filebeatimage: elastic/filebeat:v8.6.2args: ["-c", "/etc/filebeat.yml","-e",]env:- name: ELASTICSEARCH_HOSTvalue: 192.168.0.1- name: ELASTICSEARCH_PORTvalue: "9200"securityContext:runAsUser: 0# If using Red Hat OpenShift uncomment this:#privileged: trueresources:limits:memory: 200Mirequests:cpu: 100mmemory: 100Mi
Start the containerized collection service according to the above configuration to collect relevant logs into the database.
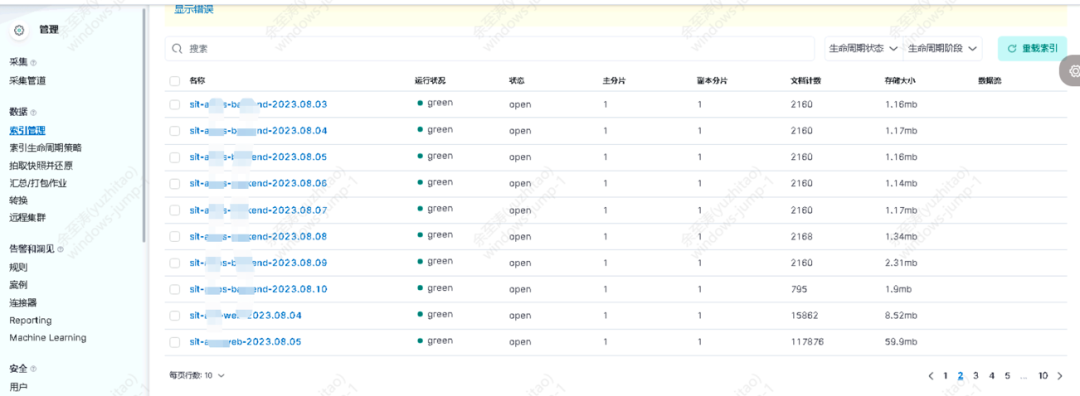
3. Visual presentation
After the collection service is started, the log index service can be queried by connecting to the Elasticsearch service through Kibana. The same type of logs are distinguished by different time and date indexes. ⬇️
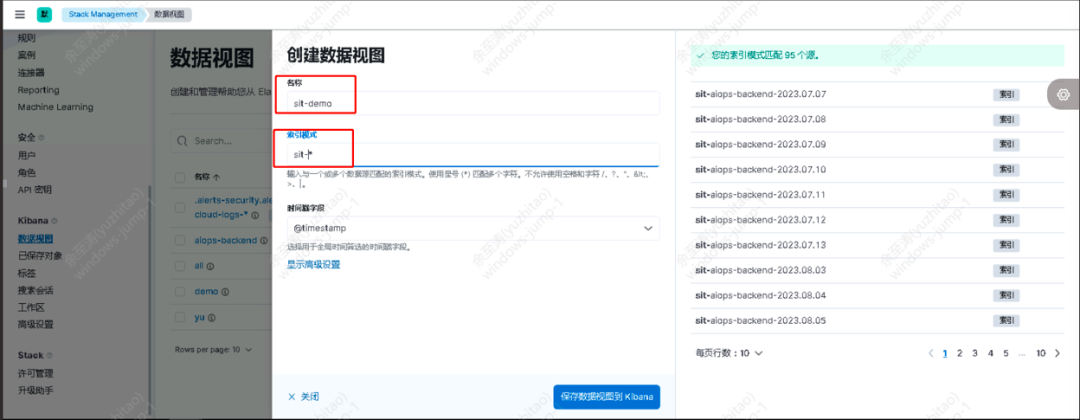
Create data views and create corresponding visual view information for different types of indexes.
The name part is the view name, which can be defined by yourself.
Index patterns 正则表达式complete specific data views by matching specific index sources.
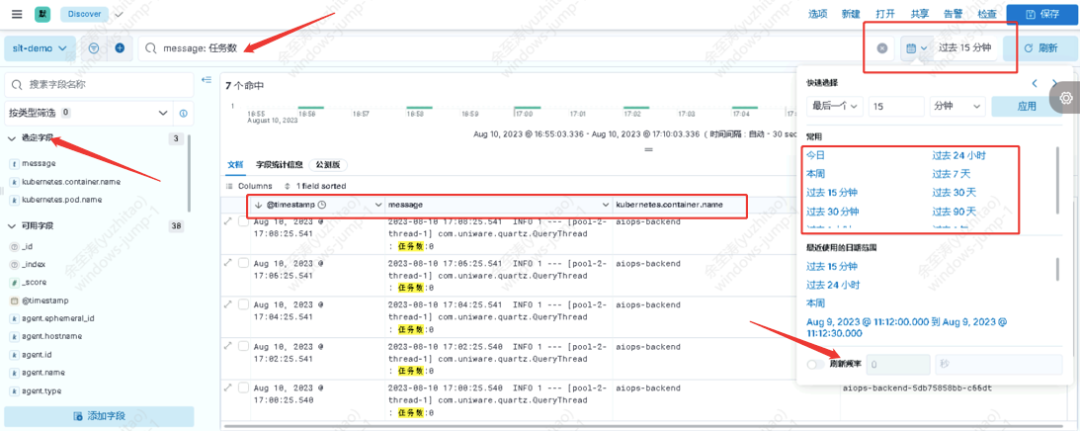
Visual presentation of data view ⬇️
Support different and flexible selected log fields for combined presentation
Support log retrieval service of KQL syntax, which can meet key core log query requirements
Support historical log retrieval requirements
Support custom refresh frequency
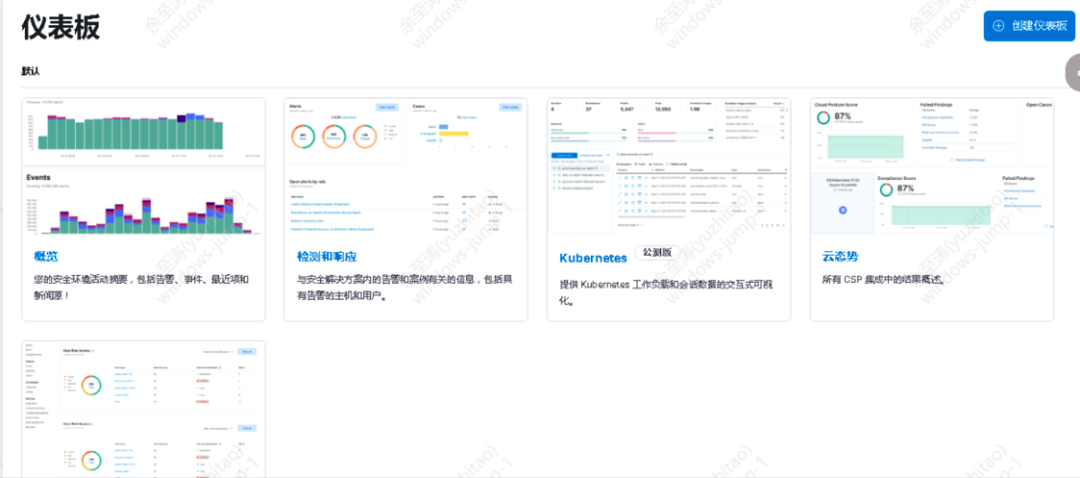
Multiple types of dashboard templates and custom dashboards ⬇️
4. Summary
The ELK log system provides log collection, storage, analysis, and visual presentation capabilities. With the help of the full-text indexing function of Elasticsearch, it has powerful search capabilities and supports second-level responses to queries of tens of billions of data. At the same time, the current expansion capability of flexible clusters is Production-level centralized log centers provide a good solution.
However, it has limited ability to process log formats. Some scene log formats need to be preprocessed and converted by other components. At the same time, there are certain limitations in alarm, authority management, and correlation analysis, which need to be continuously optimized.
With the development of the open source community, I believe that the ELK system will become more mature and complete, and can meet the needs of more scenarios.