Table of contents
02 GSMap-MVK storage method and data set introduction
01 Preface
It's so late, I still hope to write this blog and record my life.
The dataset I downloaded is the GSMap-MVK dataset, and the delay is about 2.5 months, I remember. I thought about processing it while downloading.
For example, one of the files is as follows:
gsmap_mvk.20190101.1400.v7.2112.0.dat.gz
After decompression:
gsmap_mvk.20190101.1400.v7.2112.0.dat
was found to be the default format of ENVI, so I tried to use ArcGIS to open it, and found that it was an unsupported format. I think it may be because this kind of .dat can only be opened by ENVI, so I used ENVI opened again, to no avail. Guess whether it may be hdf4/hdf5/nc4, but found that it is not. I understand that I have met an opponent, and I reconfirmed that there is no download error in the data and tried other files, all of which are the same. So look for blog documents and so on. I found that some blogs have indeed solved the problem, but they did not explain why it is necessary to do so, so I went to the official website and other channels to understand the data set. Now as follows.
02 GSMap-MVK storage method and data set introduction
Here is a link to JAXA's explanation document about GSMap related data format: http://sharaku.eorc.jaxa.jp/GSMaP/document/DataFormatDescription.pdf
Maybe this document is outdated, because my data set is GSMap-MVK, but I didn't find the description of MVK, and since MVK is the standard version, then we will take the closest GSMap-Gauge data set (not only This is the reason, but through the document, it is found that most of the .dat datasets are stored in this way) for parsing.
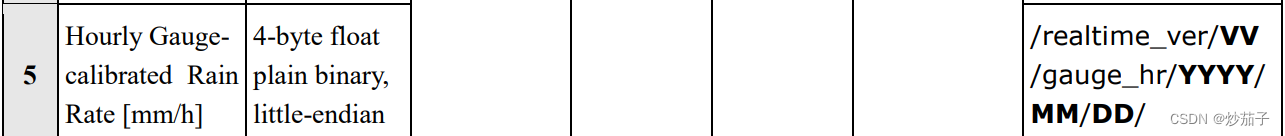
Through Gauge's Data format, we learned that its .dat file is composed of 4-byte floating-point numbers, so this is easy to handle. At first I thought that there should be many other things in .dat, but I didn’t expect that it only contained a bunch of four-byte floating point numbers about the precipitation rate, and did not store anything else including the coordinate system.
So, what about coordinate systems, etc.? Continue to browse the documentation:
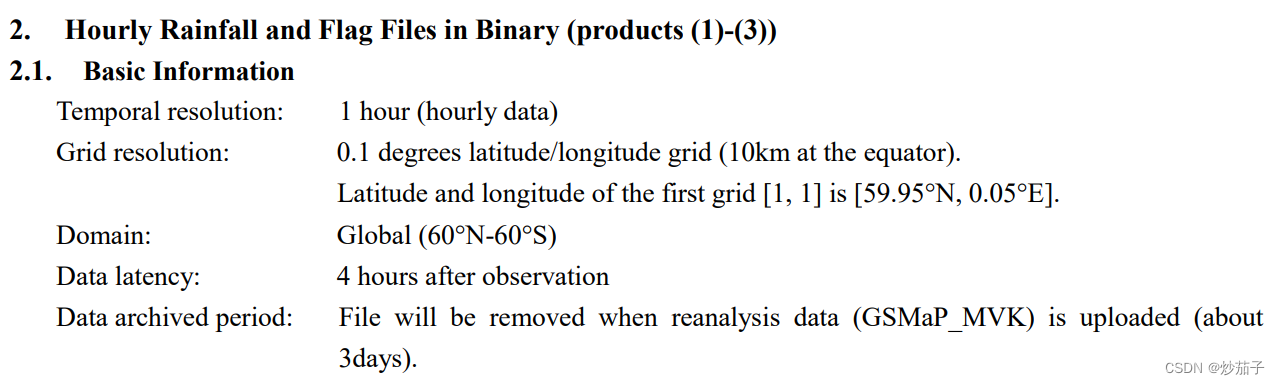
It is found that the resolution of latitude and longitude is 0.1°, the coverage range is 0~360, 60°N~60°S, and the center coordinate of the upper left pixel is (59.95°N, 0.05°E). Then basically there are affine parameters.
In addition, we also need the number of rows and columns of the image, so look at the document:
It can be found that for all binary files (that is, files with floating-point numbers of how many bytes), the number of rows and columns is 3600rows×1200lines. I was a little confused when I saw this just now. The span is so large that it should be 3600 rows and 1200 columns. It happens that there is a picture in the document that matches my guess (below).
The basic information of the image is visualized as follows: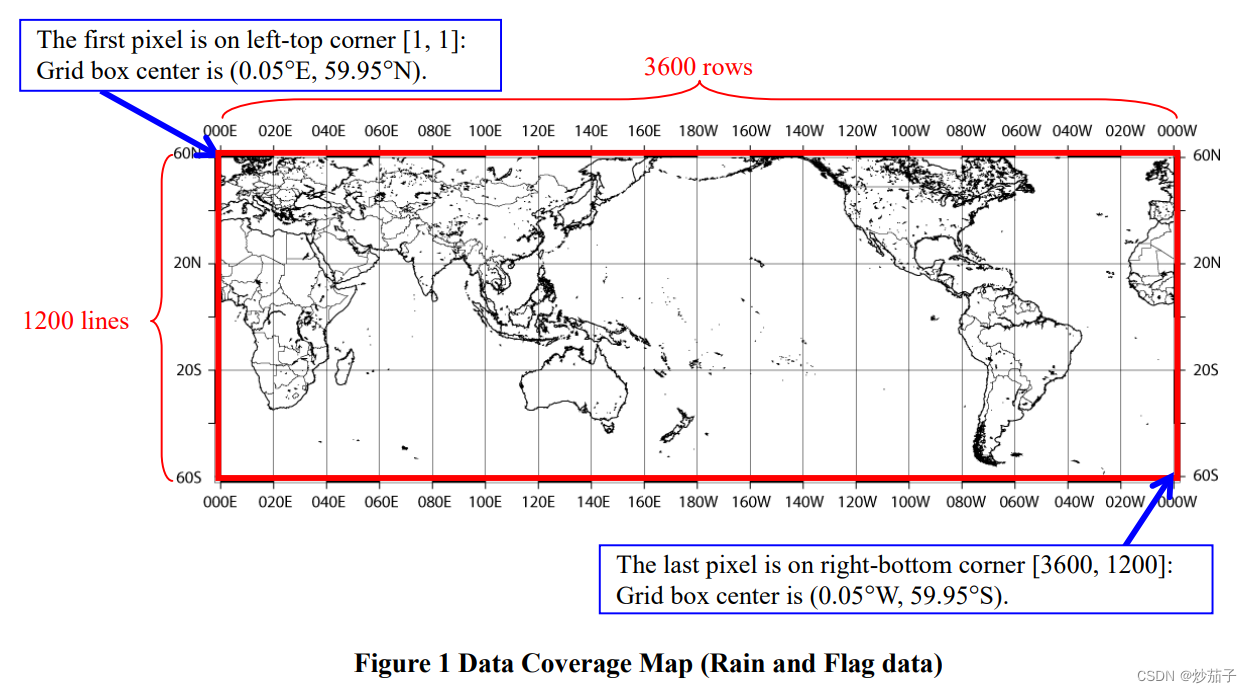
As for what the coordinate system is, to be honest, for those that do not directly specify the coordinate system or only provide some parameters or latitude and longitude data sets, I usually output according to the WGS84 coordinate system, because it is the default.
In addition, the missing value problem that needs to be explained, refer to the document:
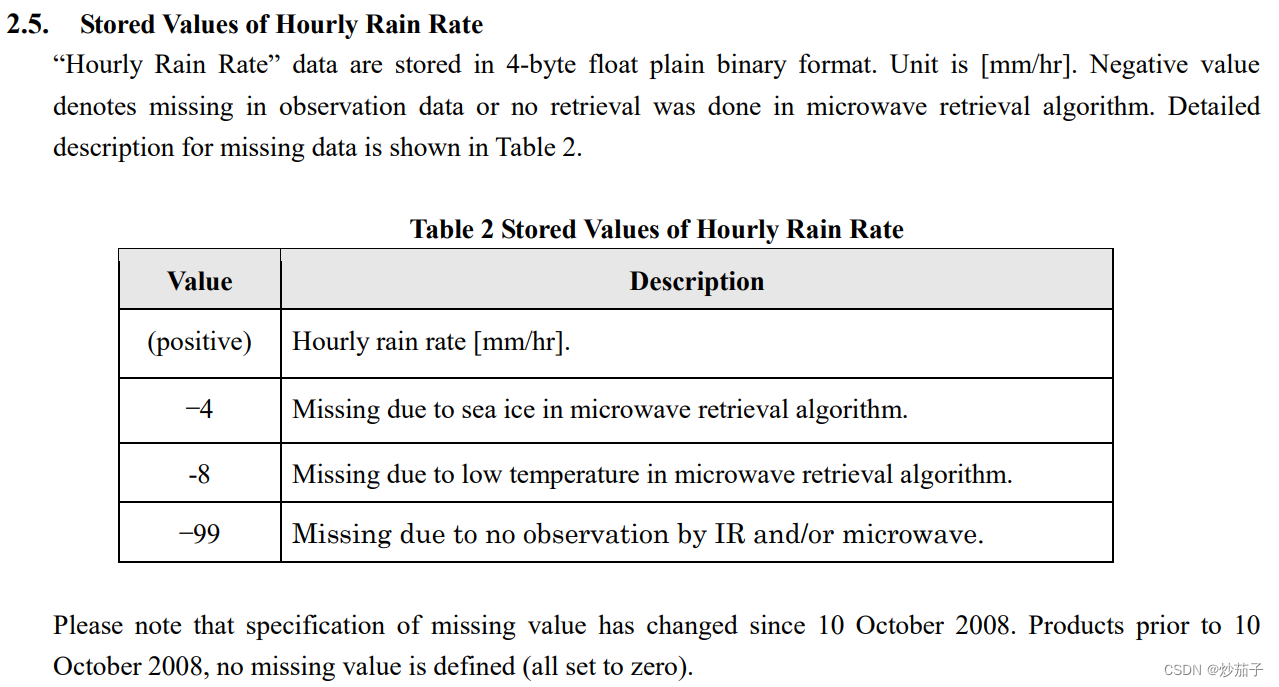
If your data set is before 2008, then all missing values are set to 0. If it is after 2018, then the missing values are set to -4, -8, -99, because I treat them equally, and the precipitation rate/precipitation amount is different. It may be negative, so set all negative numbers to NoData.
03 code implementation
It is relatively simple to implement after knowing the basic information.
There is an answer using QGIS implementation, reference: gdal - Reading JAXA GSMaP data in QGIS? - Geographic Information Systems Stack Exchange
There are also official documents using ENVI IDL, fortran language implementation, etc. After linking to FTP, it is in a similar sample folder

Of course, there are also implementations using python, for example:
Python reads GSMAP data - Programmer Sought
Python processing GPM (IMERG/GSMaP) satellite precipitation data - Programmer Sought
Here I will show something new. Everyone’s files should be .gz compressed files, so if you decompress them first, the data volume will double, and then the decompressed data will be processed and the output data will increase again. Therefore, I directly Enter the compressed package for processing. The step of decompression is omitted, once your data volume is particularly large, you need to consider it.
The code requires you to additionally install rasterio, numpy modules
import gzip
import rasterio
import numpy as np
from rasterio.transform import from_origin

# preparation
in_path = r'F:\ExtremePrecipitation\TEMP\gsmap_mvk.20190101.0400.v7.2112.0.dat.gz'
out_path = r'F:\ExtremePrecipitation\TEMP\gsmap_mvk.20190101.0400.v7.2112.0.tif'
rows = 1200
cols = 3600
lon_upper_left = 0
lat_upper_left = 60
lon_res = 0.1
lat_res = 0.1
_type = np.float32  # because 4-Bytes floats means 32 bits floats, 1 Byte = 8 bits

# get data from .gz file
with gzip.open(in_path, 'rb') as f:
    data = f.read()
    data = np.frombuffer(data, dtype=_type)
    data = np.array(data).reshape(rows, cols)
    data[data < 0] = np.nan
    with rasterio.open(out_path, 'w', driver='GTiff',
                       height=rows, width=cols,
                       count=1, dtype=data.dtype,
                       crs='+proj=latlong',  # the coordinate acrually is WGS84
                       nodata=np.nan,
                       transform=from_origin(lon_upper_left, lat_upper_left, lon_res, lat_res)) as dst:
        dst.write(data, 1)  # write the precipitation dataset into the first band of the tif file
I use the rasterio module for processing, of course you can use gdal for processing, but rasterio is more Pythonic for me.
In addition, if you have a lot of files to process, then you need to pay attention to the memory not to be full when improving the code. It is recommended to use glob.iglob instead of glob.glob because the former gets the path generator and the latter gets the path list, here I won't go into too much detail. (glob is a built-in module)
bye~