
Quantitative strategy development, high-quality community, sharing of trading ideas and other related content
"text"
ˇ
What is the most important thing in trading?
Timing of course~~~

"Opportunity is the most difficult thing in this world to get and the easiest thing to lose." What is hard to get but easy to lose is time; when the time comes but not to follow, it is also opportunity. Therefore, the sage always moves with the time, and the wise man will be inspired by the opportunity. .The original text comes from "Kyushu Spring and Autumn"
Quilting is not the most uncomfortable thing. The uncomfortable thing is that the market comes after you stop the loss, and you almost see the dawn sun. What is it called? Timing~~~
No one comes for a minute from the big frame A, and the person who just cut the props pulls you out and kills you in seconds. What is this called? Timing~~~
Huanwen Fangtou withdrew his army, and after stacking up with elite troops, he walked cautiously all the way, and was about to return to the Eastern Jin Dynasty. He was about to relax, and more than half of them were killed or injured by Murongchui's 8,000 elite cavalry raid. What is it called? Timing~~~
There are too many timing moments in life, either you catch others, or they catch you. This market is not it, I also want to grasp the timing of the market, I don't know if it is possible.
Closer to home, if we want to seize market opportunities, we need specific methods and established rules. We do quantification, so every step must be clearly explained.
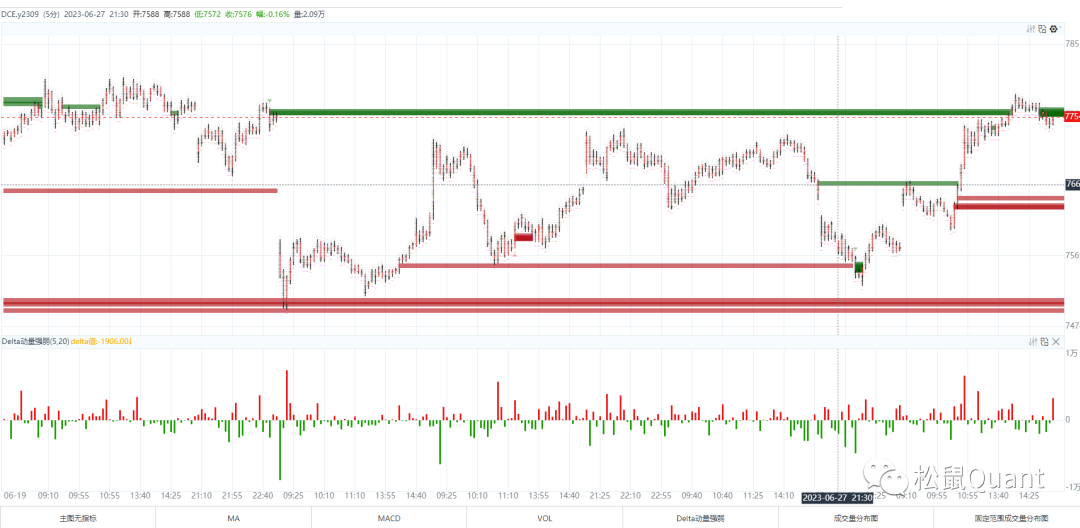
A few years ago, I found order flow very interesting. It describes the market from a microscopic point of view. It uses the smallest granular data to calculate active buying and selling indicators, find price support, resistance, which K line actively buys more, which one It is to actively sell more, how the active buying and selling power in the whole market is distributed, etc. What attracts me the most is that it can clearly describe the long-short power of the market with quantity. This point is very critical for quantitative strategies, and a complete trading condition can be written, rather than ambiguous places like some subjective theories. "The difference between the order flow chart and the ordinary K-line"
Can't order flow be wrong? Wrong, often wrong. Don't be afraid of it being wrong, there is a corresponding stop loss and take profit, and what you do is a profit-loss ratio.
(Graphic source: Squirrel Sandbox)
(Graphic source: Squirrel Sandbox)
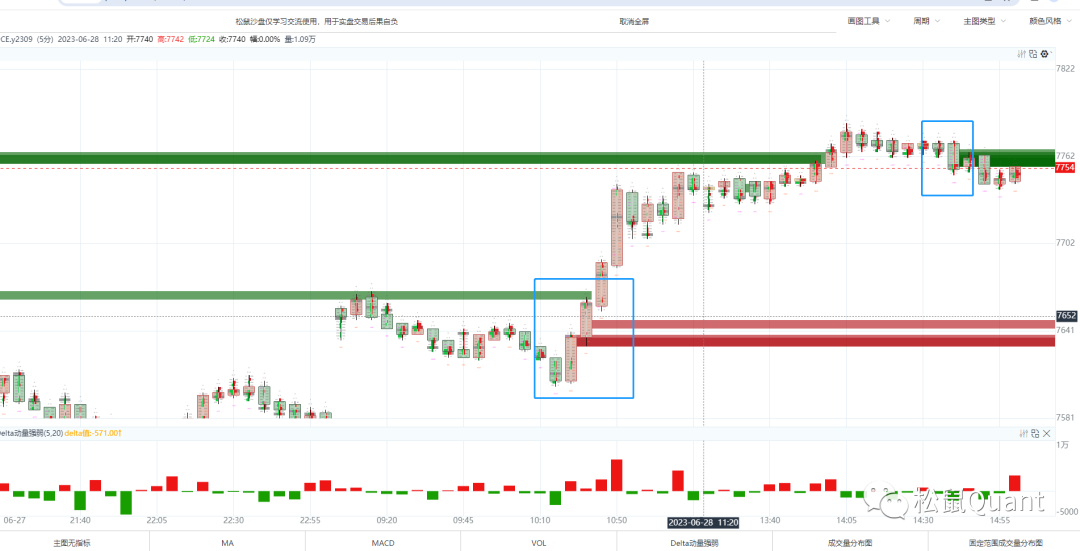
The red and green horizontal lines in the figure are accumulations caused by multiple imbalances, which are divided into long accumulations and short accumulations. That is to say, there is a huge contradiction between supply and demand on a certain K line, and one party has an absolute advantage.
This is a trading signal. When the signal appears, you can try to take advantage of this opportunity. The stop loss is set at the lowest price of the signal K line or the highest price of the short position. Waiting for an opportunity with a larger profit-loss ratio at a small trial and error cost . In other words, you have to grasp the timing of the main force~ haha
strategy logic
1. Conditions for opening a position: The number of long accumulations is greater than X to go long, and the number of short accumulations is greater than X to short. Both forehand and backhand.
2. Fixed stop loss: the stop loss price is calculated as a percentage of the opening price.
3. Tracking take profit: use the chandelier method to track the price and calculate the market line.
The strategy logic is very simple, without so many twists and turns. That's what I really like about it, it's a no-brainer. Order Flow strategies differ from traditional technical indicator strategies in that they cannot predict signals. If it is MACD or KDJ, you can even predict whether it will cross, but the order flow cannot. It is an active buying and selling force calculated based on the smallest granularity, and you can only know it when it appears.
Policy Module
1. Calculate of data by tick (or tick-by-tick) data
2. Calculate accumulation signals or other indicators based on the data
3. Synthesize accumulation signal as bar data for backtesting
4. Real-time generation of OF data and signals based on CTP (solid version)

Handicap strategies are divided into two versions: the backtest version and the real version . Today we are talking about the backtest version. After getting the source code in the club, the group members will definitely ask a lot of questions, and the implementation of the strategy code is more complicated. We first digested the backtest version, and then released the CTP real version in early July.
tick generates of data:
def orderflow_df_new(df_tick,df_min):df_of=pd.DataFrame({})t1 = time.time()startArray = pd.to_datetime(df_min['starttime']).valuesvoluememin= df_min['volume'].valueshighs=df_min['high'].valueslows=df_min['low'].valuesopens=df_min['open'].valuescloses=df_min['close'].valuesendArray = pd.to_datetime(df_min['datetime']).valuestTickArray = pd.to_datetime(df_tick['datetime']).valuesbp1TickArray = df_tick['bid_p'].valuesap1TickArray = df_tick['ask_p'].valueslastTickArray = df_tick['lastprice'].valuesvolumeTickArray = df_tick['volume'].valuessymbolarray = df_tick['symbol'].valuesindexFinal = 0for index,tEnd in enumerate(endArray):start = startArray[index]bidDict = {}askDict = {}bar_vol=voluememin[index]bar_close=closes[index]bar_open=opens[index]bar_low=lows[index]bar_high=highs[index]bar_symbol=symbolarray[index]dt=endArray[index]for indexTick in range(indexFinal,len(df_tick)):#.........................bidDictResult,askDictResult = process(bidDict,askDict)bidDictResult=dict(sorted(bidDictResult.items(),key=operator.itemgetter(0)))askDictResult=dict(sorted(askDictResult.items(),key=operator.itemgetter(0)))prinslist=list(bidDictResult.keys())asklist=list(askDictResult.values())bidlist=list(bidDictResult.values())delta=(sum(askDictResult.values()) - sum(bidDictResult.values()))df=pd.DataFrame({'price':pd.Series([prinslist]),'Ask':pd.Series([asklist]),'Bid':pd.Series([bidlist])})df['symbol']=bar_symboldf['datetime']=dtdf['delta']=str(delta)df['close']=bar_closedf['open']=bar_opendf['high']=bar_highdf['low']=bar_lowdf['volume']=bar_voldf['ticktime']=tTickArray[indexTick]df['dj']=GetOrderFlow_dj(df)print(df)df_of = pd.concat([df_of, df], ignore_index=True)print(time.time() - t1)return df_of
After calculating the order flow data, the output is as follows:
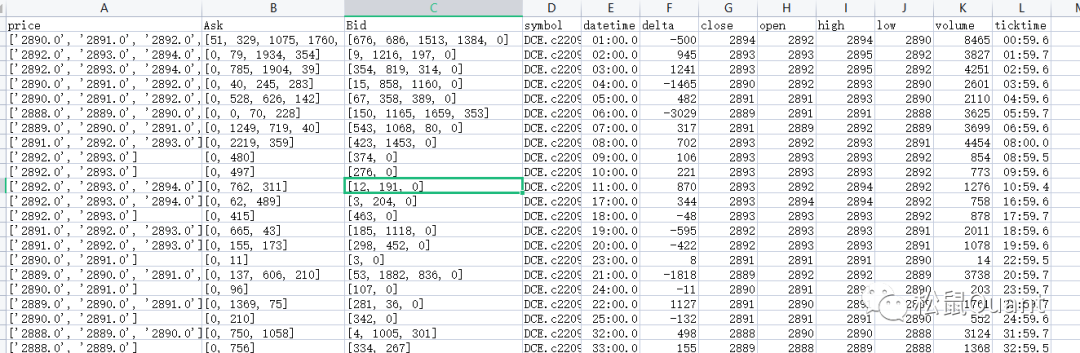
The three columns of price, Ask, and Bid are the core data in the order flow K-line, as shown in the figure below:

With this script, you can continuously generate orderflow data for research. Then we are calculating the imbalance and accumulation of each K line. Our trading conditions are based on accumulation, so we only need to calculate the accumulation column to achieve Bar level backtesting. As shown below:

The sig column is the number of accumulations of this bar, positive numbers are long accumulations, and negative numbers are short accumulations.
Code to calculate pileup:
order= {"Price":price_s[i],"Ask":{ "Value":Bid_s[i]},"Bid":{ "Value":Ask_s[i]}}if i>=1 and i<len(price_s)-1:if (order["Ask"]["Value"]>Ask_s[i+1]*int(Config['Value1'])):order["Ask"]["Color"]=itemAskBG[1]gxx+=1gj+=1if gj>=int(Config['Value2']) and Config['Value4']==True:duiji['price']=price_s[i]duiji['time']=dtimeduiji['longshort']=-1duiji['cout']=gjduiji['color']='rgba(0,139,0,0.45)'#绿色if float(duiji['price'])>0:djcout+=1else :gj=0if (order["Bid"]["Value"]>Bid_s[i-1]*int(Config['Value1'])):xq+=1xxx+=1order["Bid"]["Color"]=itemBidBG[1]if xq>=int(Config['Value2']) and Config['Value4']==True:duiji['price']=price_s[i]duiji['time']=dtimeduiji['longshort']=1duiji['cout']=xqduiji['color']='rgba(255,0,0,0.45)' #红色if float(duiji['price'])>0:djcout+=-1else :xq=0
Why use Bar level to backtest order flow strategy?
We have developed many orderflow strategy scripts before, for details, please refer to the orderflow series. They are all Tick-by-Tick backtests. To be honest, they are too slow. The 6-month tick-by-tick backtest takes several hours. It is difficult to do research at such a slow speed. If your machine has a small memory, it may crash halfway. So we changed our thinking and said that the signal calculation is good when the data is generated, and we only need to backtest the Bar that contains the signal . There has been a qualitative leap in data generation + backtesting time, and these tasks can be completed in less than 2 minutes, as shown in the figure below:

It took 78 seconds to generate orderflow data + signal.
Then we backtest it in 10 seconds:

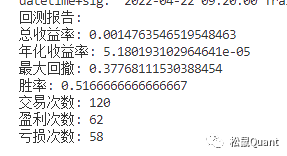
The backtest has adjusted the handling fee and slippage, and the specific product needs to be set accordingly, which is also the troublesome part of BackTrader. In order to avoid price stealing, we use the fixed signal of the previous bar to judge, and use the opening price of the root bar to trade. This backtest is Shanghai Nickel for 1 minute, and the backtest time is from January to June 2023.

The condition settings are: accumulation is greater than 5 times, positive and negative, fixed stop loss 0.005, fixed stop profit 0.01
And thread 5M:
The condition settings are: accumulation is greater than 0 times, positive and negative, fixed stop loss 0.005, fixed stop profit 0.01
Regarding why the rate of return is so low, because I placed an order for 1 lot, and the initial capital setting is 100W.
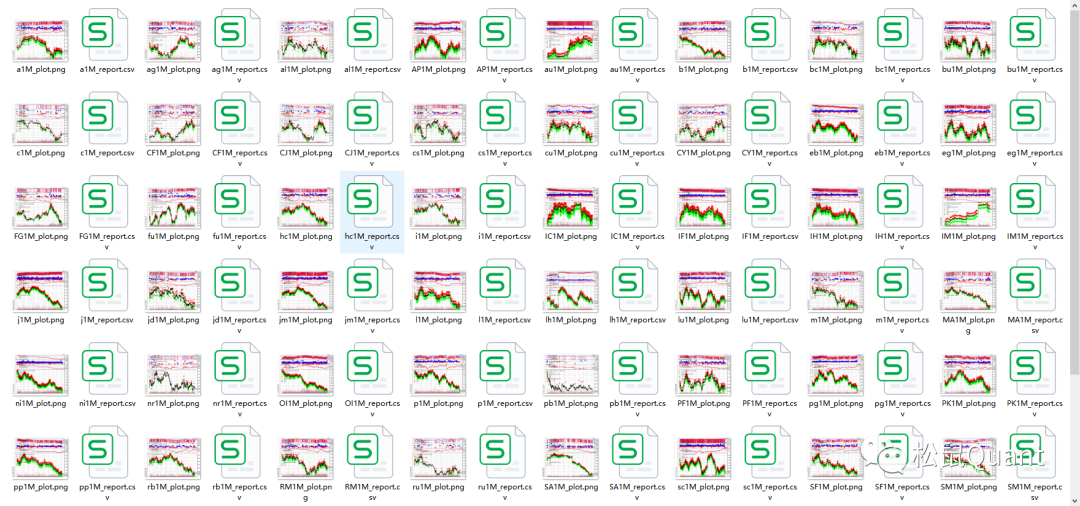
I back-tested the situation of different varieties under the same cycle parameters. I will not post them one by one because there are too many data. I uploaded them to the backstage of the club. You can download them and watch them slowly.

In addition, I want to emphasize that I currently do not have parameter optimization in backtesting. The logic of this strategy is very special, and the logic of CTA cannot be rigidly applied. It is necessary to set parameters for specific varieties, as shown in the figure below:

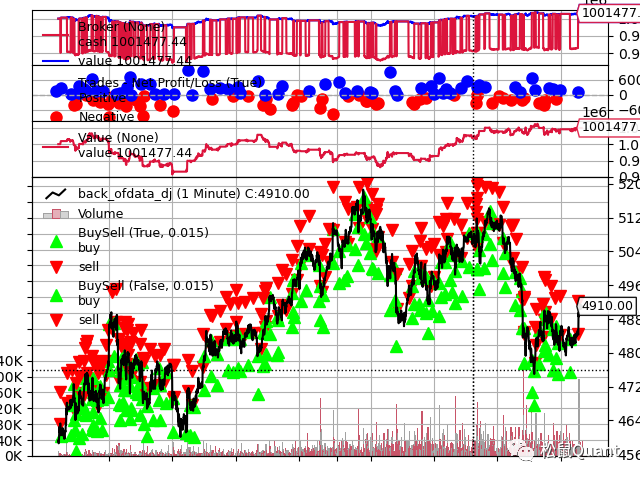
That's 1 minute of nickel.

This is the signal graph of the thread for 1 minute. Why is there such a big difference in the number of signals? Because of the handicap characteristics of each variety, there are essential differences in activity . To prescribe the right medicine, don't just use one set of parameters to conquer the world, one trick is eaten all over the world, do you think it is penicillin or isatis root?
The script for generating order flow is based on domestic commodities, and can also generate underlying data such as stocks, BTC, and foreign disks. Anyway, the script is universal, and there is no requirement for what data to use, as long as the header is modified.
Our handicap strategy will be tested in July. In fact, some friends in the group have already started manual operation, but today we made it fully automatic. There is still a lot of room for research on all aspects of order flow. We provide the most basic version. After you get the source code, you can play by yourself, which is more interesting than traditional CTA strategies.
OK, I will record a video explaining how to use and the complete code . After you get the source code, you can ask questions in the group. There must be many questions. I will wait for you in the club group.
One last question:
Do you know what is called timing?
This strategy is only for learning and communication, and investors are personally responsible for the profit and loss of real trading transactions.