Hello,
I'm having some problems using the contourf function on a log-log scale plot. I have 9 data points in a 2D scatterplot that color a third variable. The code I use to plot the data and plot is included below.
a = reshape(mtot_1,1,[]); % convert matrix to row vector
b = reshape(MFR_1,1,[]); % convert matrix to row vector
c = reshape(SN_maxes_1,1,[]); % convert matrix to row vector
figure(4)
clf
hold on
scatter(b, a, [], c, 'filled')
set(gca,'xscale','log')
set(gca,'yscale','log')
colorbar
xlabel('MFR')
ylabel('total mass flow')
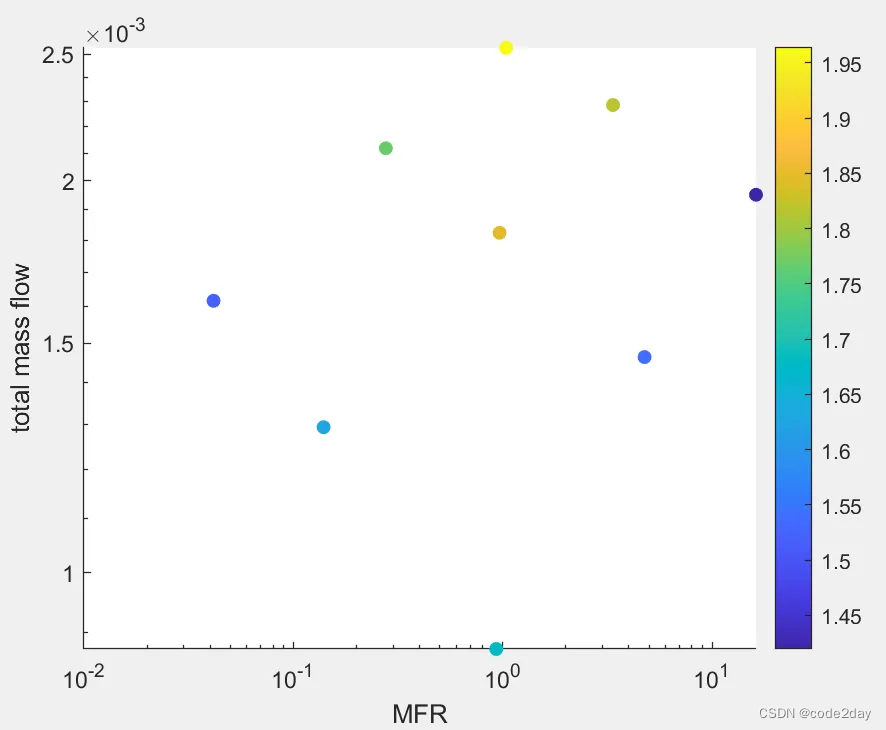
As you can see, on the log-log scale the data points form a sort of "slanted quadrilateral" shape, and the edges appear "straight" when plotted on the log-log scale. I want to create a contour plot from these 9 points, but when I do so, it looks like the plot below, because the contours are generated with a linear interpolation method on the normal linear axis scale Creates straight lines between points that then appear distorted or curved when plotted on a log-log scale. I've also included the code I use.
figure(5)
clf
hold on
contourf(MFR_1, mtot_1, SN_maxes_1, 100, 'LineStyle', 'none')
scatter(b, a, [], c, 'f