The training model found that the loss is very large. One of the reasons is that the data is not normalized?
In deep learning, normalization and standardization are two common data preprocessing techniques, which are used to adjust the input data to an appropriate range to improve the training effect of the model. Although their goals are similar, normalization and standardization differ in implementation and effect.
1. Normalization (Normalization) usually refers to scaling the data to a range between 0 and 1. The most common normalization method is to subtract the minimum value from the eigenvalue of each sample, and then divide by the difference between the maximum and minimum values. This ensures that all eigenvalues fall within the range 0 to 1. Normalization preserves the distribution shape of the original data, but may be sensitive to outliers. It is especially useful when the value range of a feature is unknown or varies widely.
For the image, after normalization, it just changes from [0,255] to [0,1] but the display is the same.

def Transform(data):
    max = data.max()
    min = data.min()
    return (data - min) / (max - min)
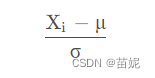
2. Standardization is to transform the data into a distribution with a mean of 0 and a standard deviation of 1. Standardization is done by subtracting the mean and dividing by the standard deviation. Normalized data has zero mean and unit variance such that all features are of similar scale. Normalization is usually robust to outliers, but it can change the shape of the original data distribution. Standardization is often used when the value range of the feature is known and the difference is not large.
import torchvision.transforms as transforms
transforms.Normalize(mean = (0.485, 0.456, 0.406), std = (0.229, 0.224, 0.225))
In short, normalization scales the data between 0 and 1, preserves the shape of the data distribution, and is suitable for features with unknown value ranges or large differences. Standardization transforms the data into a distribution with a mean of 0 and a standard deviation of 1, so that all features have a similar scale, and is suitable for features with known value ranges and little difference. The choice of which method to use depends on the characteristics of the data and the requirements of the specific task.