Meituan: How does Spring Cloud build a dynamic thread pool?
say up front
In the reader exchange group (50+) of Nien, a 40-year-old architect , some friends have recently obtained interview qualifications for first-tier Internet companies such as Meituan, Jitu, Youzan, Xiyin, Baidu, Netease, and Didi. Encountered a few very important interview questions:
(1) How does Spring Cloud build a dynamic thread pool?
(2) In the production scenario, how should the core parameters of the thread pool be dynamically adjusted?
Etc., etc…
Thread pools and dynamic thread pools are the focus and high-frequency points of interviews.
As the architect of the technology center and data center, Nien is committed to researching a 3-level architecture knowledge universe for everyone, so here, I will take you through an analysis and practical operation of how Spring Cloud builds a dynamic thread pool architecture.
Of course, as an article, it’s just an introduction. When I have an opportunity later, I will take you to do this high-quality practical operation and guide you to write in your resume.
Let the interviewer love to "can't help himself, drooling" .
Also include this question and reference answers in our " Nin Java Interview Collection " V66 version, for the reference of later friends, to improve everyone's 3-high architecture, design, and development level.
Note: This article is continuously updated in PDF. For PDF files of the latest Nien architecture notes and interview questions, please go to the official account [Technical Freedom Circle] at the end of the article to obtain.
Article directory
-
- Meituan: How does Spring Cloud build a dynamic thread pool?
- say up front
- Business Scenario Analysis
- Why do you need a dynamic thread pool?
- SpringCloud thread pool monitoring management solution
- Step 1: Expand the thread pool and obtain thread pool indicator data
- Step 2: Dynamically configure thread pool parameters
- Step 3: Monitor the thread pool
- Step 4: Access Prometheus
- Summary of dynamic parameter adjustment of Nacos registration center
- Recommended open source solutions for dynamic thread pools
- SpringCloud project uses dynamic-tp dynamic thread pool
- references
- The realization path of technical freedom PDF:
Business Scenario Analysis
Traffic floods are common scenarios encountered in the Internet production environment, such as the rush to buy goods at a certain point in time, or the centralized triggering of scheduled tasks at a certain time point, these scenarios may cause traffic floods, so how to deal with traffic floods is what we must face right question.
In the vertical dimension, we can think from the proxy layer, WEB layer, service layer, cache layer, and data layer. In the horizontal dimension, we can think from the directions of high-frequency detection, cache front-end, node redundancy, and service degradation. In this article, we think from the perspective of dynamically adjusting the number of threads in the service layer.
The dynamic thread pool means that we can adjust some parameters of the thread pool according to the different traffic. For example, the number of threads can be reduced during low-peak business periods, and the number of threads can be increased during peak business periods to increase processing threads to cope with traffic floods.
In this article, we combine SpringCloud applications to thoroughly introduce how to build a dynamic thread pool.
Why do you need a dynamic thread pool?
Thread pool is an important tool in Java concurrent programming, it can effectively manage and reuse threads, and improve system performance and throughput.
However, if the thread pool is improperly configured and used, it will also bring some serious problems, such as memory overflow, CPU overload, response delay, service unavailability, etc.
These problems are often exposed in the production environment, bringing huge risks and losses to the system.
So do you want to better manage and monitor your thread pool status and performance?
Do you want to dynamically adjust your thread pool parameters without restarting your application?
Do you want to receive timely alarm notifications of your thread pool exceptions or risks?
If your answer is yes, then this article will teach you how to use and these three powerful components SpirngCloudunder the microservice framework to realize indicator exposure, dynamic parameter adjustment, indicator collection and visual monitoring of custom thread pools, and alarm function.NacosPrometheusGrafana
Through this article, you will learn:
- How to use
Nacosthe registry to store and manage your thread pool parameters and implement dynamic refresh - How to use Micrometer to create and manage your thread pool metrics and export them to Prometheus format
- How to use Prometheus to pull metrics data from your application and store it in its own time series database
- How to use it
Grafanato get indicator data from Prometheus and create beautiful and practical dashboards to display your indicator data - How to use the alarm function of
PrometheusorGrafanato set alarm rules and notification channels for your indicator data, and receive alarm notifications in time when the indicators meet certain conditions, such as DingTalk, email, etc. If there is a problem with the thread pool or after the modification is completed, it can be notified and alerted based on the monitored information. In this way, it is necessary to consider the diversity of notification and alarm methods: for example, notification and alarm based on channels such as DingTalk, WeChat, Feishu, and email.
This article will provide you with detailed steps and code, so that you can easily follow the operation and implement your own thread pool monitoring and management system.
What are the benefits of thread pool monitoring and parameter dynamics?
We need to monitor the thread pool to understand the running status and performance indicators of the thread pool, find and solve problems in time, and optimize the configuration and use of the thread pool.
Monitoring the thread pool has several benefits:
- You can observe the core parameters of the thread pool
, such as the number of core threads, the maximum number of threads, the queue capacity, the number of active threads, the number of tasks, etc., to judge whether the thread pool is properly configured and fully utilized. - You can analyze the running status of the thread pool
, such as task execution time, task waiting time, task rejection rate, task failure rate, etc., to evaluate the performance and stability of the thread pool. - You can set an early warning mechanism for the thread pool
. For example, when the thread pool reaches a certain threshold or an exception occurs, relevant personnel will be notified in time and corresponding measures will be taken to avoid system crashes or affect user experience. - Dynamically adjust your thread pool parameters without restarting your application
How to get some metrics data of thread pool?
To monitor the status and performance of the thread pool, we need to obtain some indicator data of the thread pool.
ThreadPoolExecutorThe class provides some methods to get these data, such as:
- Number of core threads:
getCorePoolSize() - Maximum number of threads:
getMaximumPoolSize() - Blocking queue:
getQueue(), through which information such as queue length and number of elements can be obtained - Number of worker threads:
getPoolSize(), including core threads and non-core threads - Number of active threads:
getActiveCount(), that is, threads that are executing tasks - The maximum number of working threads:
getLargestPoolSize(), which is the maximum value that the thread pool has ever reached - Number of tasks:
getTaskCount(), including historically completed and ongoing tasks
In addition to these methods, ThreadPoolExecutorthe class also has some hook methods, which have no specific implementation, but we can override them to get more data, such as:
beforeExecute: The method that will be called before the Worker thread executes the task, where we can record the time when the task starts to executeafterExecute: The method that will be called after the Worker thread executes the task, where we can calculate the time-consuming task execution, and calculate the maximum time-consuming, minimum time-consuming, average time-consuming, etc. based on the time-consumingterminated: The method called before the thread pool changes from state to TERMINATED state, we can do some cleaning or statistical work here
Through these methods, we can obtain various indicator data of the thread pool, which provides a basis for monitoring the thread pool.
SpringCloud thread pool monitoring management solution
So, how to realize the monitoring of the thread pool?
We can take the following steps:
- The first step is to extend
ThreadPoolExecutorthe class, rewritebeforeExecute,afterExecuteandterminatedmethods to obtain more indicator information, such as the shortest execution time, the longest execution time, and the average execution time. - The second step is to combine
Nacosthe registration center to realize the dynamic change of the core parameters of the thread pool and take effect in real time. - The third step is to use the Actuator provided by Spring Boot to customize an Endpoint to publish the indicator data of the thread pool, so that we can obtain the monitoring information of the thread pool through HTTP requests.
- The fourth step is to use some open source components to collect, store, display and warn the indicator data of the thread pool, such as
Prometheus,GrafanaandAlertManager. These components can help us realize a visual monitoring interface and flexible early warning strategies.
Next, we implement a complete thread pool monitoring and management solution step by step according to the above steps.
Step 1: Expand the thread pool and obtain thread pool indicator data
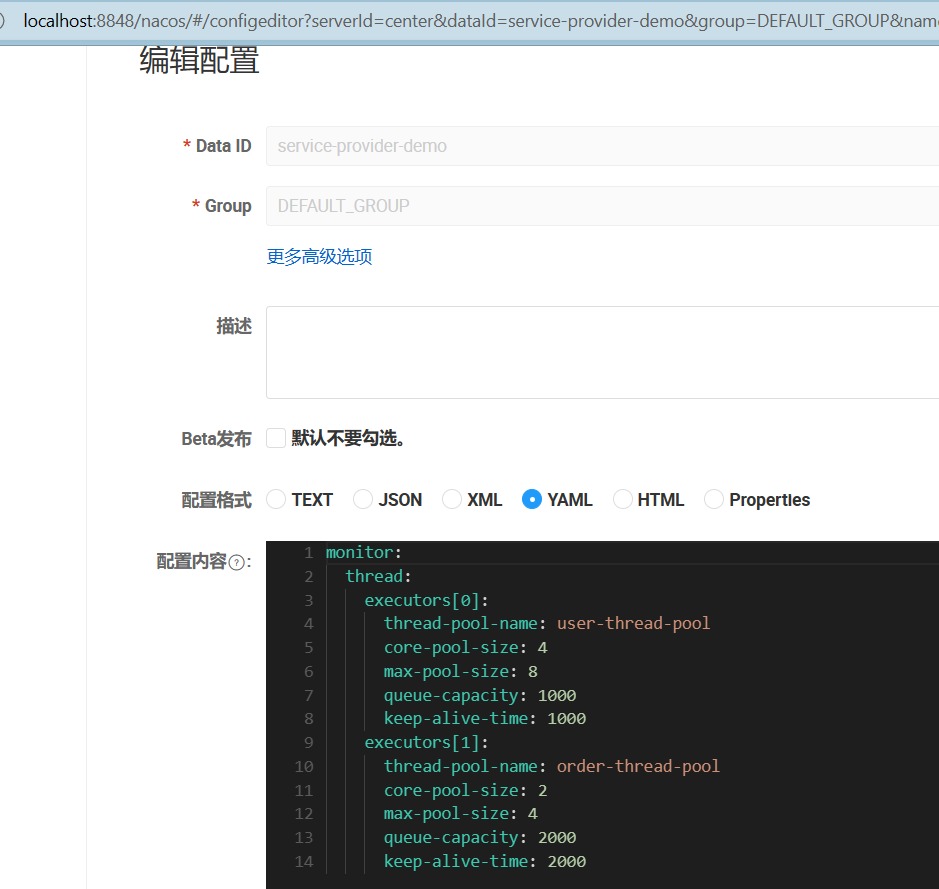
First, we add the following sample configuration in springbootthe project configuration file (for example: application.yml), which will be used to dynamically generate thread pools based on this configuration.
monitor:
  thread:
    executors[0]:
      thread-pool-name: first-monitor-thread-pool
      core-pool-size: 4
      max-pool-size: 8
      queue-capacity: 1000
      keep-alive-time: 1000
    executors[1]:
      thread-pool-name: second-monitor-thread-pool
      core-pool-size: 2
      max-pool-size: 4
      queue-capacity: 2000
      keep-alive-time: 2000
According to the above configuration, we write the corresponding configuration class to read the thread pool properties declared in the configuration file. The code is as follows:
/**
 * 获取线程池配置属性
 */
@ConfigurationProperties(prefix = "monitor.thread")
@Data
@Component
public class ThreadPoolConfigProperties {


    private List<ThreadPoolProperties> executors = new ArrayList<>();
}

/**
 * 线程池的核心属性声明。
 */
@Data
@NoArgsConstructor
@AllArgsConstructor
public class ThreadPoolProperties {


    /**
     * 线程池名称
     */
    private String threadPoolName;

    /**
     * 核心线程数,默认为 Runtime.getRuntime().availableProcessors()
     */
    private Integer corePoolSize = Runtime.getRuntime().availableProcessors();

    /**
     * 最大线程数,默认为 Runtime.getRuntime().availableProcessors()* 2
     */
    private Integer maxPoolSize = Runtime.getRuntime().availableProcessors() * 2;

    /**
     * 队列最大数量
     */
    private Integer queueCapacity;

    /**
     * 空闲线程存活时间
     */
    private Long keepAliveTime = 1L;

    /**
     * 空闲线程存活时间单位
     */
    private TimeUnit unit = TimeUnit.MILLISECONDS;
}
Then, we need to extend ThreadPoolExecutorthe class, rewrite beforeExecute, afterExecuteand terminatedmethods to obtain more indicator information, such as the shortest execution time, the longest execution time, and the average execution time.
Extended key points:
- When constructing a thread pool, pass in the name of the thread pool in the construction method
poolName, which can be used as the prefix of the thread name in the thread pool to facilitate log tracking. - In
beforeExecutethe method,ThreadLocalthe start time stamp before the execution of the current thread task is recorded through the object, which is used for subsequent calculation of the execution time of the thread task. - In
afterExecutethe method, calculate the execution time of the current thread, accumulate the total time consumption, and calculate the average time consumption, maximum time consumption, and minimum time consumption. - In the thread pool life cycle related methods, print the thread pool related indicator information, and provide public method exposure indicator information.
- Implement a custom thread factory. When creating a new thread, the thread pool name is
poolNameprefixed with the creation line program number to name the thread.
/**
 * 线程池监控类
 * <p>
 * 计算线程执行每个任务处理的耗时,以及平均耗时、最大耗时、最小耗时,以及输出监控日志信息等等
 */
public class MonitorThreadPool extends ThreadPoolExecutor {


    private static final Logger LOGGER = LoggerFactory.getLogger(MonitorThreadPool.class);

    /**
     * 默认拒绝策略
     */
    private static final RejectedExecutionHandler DEFAULT_HANDLER = new AbortPolicy();

    /**
     * 线程池名称,一般以业务名称命名,方便区分
     */
    private final String poolName;

    /**
     * 最短执行时间
     */
    private Long minCostTime = 0L;

    /**
     * 最长执行时间
     */
    private Long maxCostTime = 0L;
    /**
     * 总的耗时
     */
    private AtomicLong totalCostTime = new AtomicLong();
    /**
     * 用于暂存任务执行起始时间戳
     */
    private ThreadLocal<Long> startTimeThreadLocal = new ThreadLocal<>();

    /**
     * 初始化
     */
    public MonitorThreadPool(int corePoolSize, int maximumPoolSize, long keepAliveTime, TimeUnit unit, BlockingQueue<Runnable> workQueue,String poolName) {


        super(corePoolSize, maximumPoolSize, keepAliveTime, unit, workQueue,new MonitorThreadFactory(poolName),DEFAULT_HANDLER);
        this.poolName = poolName;
    }

    /**
     * 线程池延迟关闭时(等待线程池里的任务都执行完毕),统计线程池情况
     */
    @Override
    public void shutdown() {


        // 统计已执行任务、正在执行任务、未执行任务数量
        LOGGER.info("{} 关闭线程池, 已执行任务: {}, 正在执行任务: {}, 未执行任务数量: {}",
                this.poolName, this.getCompletedTaskCount(), this.getActiveCount(), this.getQueue().size());
        super.shutdown();
    }

    /**
     * 线程池立即关闭时,统计线程池情况
     */
    @Override
    public List<Runnable> shutdownNow() {


        // 统计已执行任务、正在执行任务、未执行任务数量
        LOGGER.info("{} 立即关闭线程池,已执行任务: {}, 正在执行任务: {}, 未执行任务数量: {}",
                this.poolName, this.getCompletedTaskCount(), this.getActiveCount(), this.getQueue().size());
        return super.shutdownNow();
    }

    /**
     * 任务执行之前,记录任务开始时间
     */
    @Override
    protected void beforeExecute(Thread t, Runnable r) {


        //记录任务开始时间
        startTimeThreadLocal.set(System.currentTimeMillis());
        super.beforeExecute(t, r);
    }

    /**
     * 任务执行之后,计算任务结束时间
     */
    @Override
    protected void afterExecute(Runnable r, Throwable t) {


        // 当前任务耗时
        long costTime = System.currentTimeMillis() - startTimeThreadLocal.get();
        startTimeThreadLocal.remove();
        // 更新最大耗时时长
        maxCostTime = maxCostTime > costTime ? maxCostTime : costTime;
        if (getCompletedTaskCount() == 0) {


            minCostTime = costTime;
        }
        // 更新最小耗时时长
        minCostTime = minCostTime < costTime ? minCostTime : costTime;
        // 统计总耗时
        totalCostTime.addAndGet(costTime);
        LOGGER.info("{}-monitor: " +
                        "任务耗时: {} ms, 初始线程数: {}, 核心线程数: {}, 执行的任务数量: {}, " +
                        "已完成任务数量: {}, 任务总数: {}, 队列里缓存的任务数量: {}, 池中存在的最大线程数: {}, " +
                        "最大允许的线程数: {},  线程空闲时间: {}, 线程池是否关闭: {}, 线程池是否终止: {}",
                this.poolName,
                costTime, this.getPoolSize(), this.getCorePoolSize(), this.getActiveCount(),
                this.getCompletedTaskCount(), this.getTaskCount(), this.getQueue().size(), this.getLargestPoolSize(),
                this.getMaximumPoolSize(), this.getKeepAliveTime(TimeUnit.MILLISECONDS), this.isShutdown(), this.isTerminated());
        super.afterExecute(r, t);
    }

    // 获取最小耗时时长
    public Long getMinCostTime() {


        return minCostTime;
    }

    // 获取最大耗时时长
    public Long getMaxCostTime() {


        return maxCostTime;
    }

    // 计算平均耗时时长
    public long getAverageCostTime() {


        if (getCompletedTaskCount() == 0 || totalCostTime.get() == 0) {


            return 0;
        }
        // 总完成耗时除以总完成任务数
        return totalCostTime.get() / getCompletedTaskCount();
    }

    /**
     * 生成线程池所用的线程,改写了线程池默认的线程工厂,传入线程池名称,便于问题追踪
     */
    static class MonitorThreadFactory implements ThreadFactory {


        private static final AtomicInteger POOL_NUMBER = new AtomicInteger(1);
        private final ThreadGroup group;
        private final AtomicInteger threadNumber = new AtomicInteger(1);
        private final String namePrefix;

        /**
         * 初始化线程工厂
         *
         * @param poolName 线程池名称
         */
        MonitorThreadFactory(String poolName) {


            SecurityManager s = System.getSecurityManager();
            group = Objects.nonNull(s) ? s.getThreadGroup() : Thread.currentThread().getThreadGroup();
            namePrefix = poolName + "-" + POOL_NUMBER.getAndIncrement() + "-thread-";
        }

        /**
         * 新增线程
         * @param r a runnable to be executed by new thread instance
         * @return
         */
        @Override
        public Thread newThread(Runnable r) {


            Thread t = new Thread(group, r, namePrefix + THREAD_NUMBER.getAndIncrement(), 0);
            if (t.isDaemon()) {


                t.setDaemon(false);
            }
            if (t.getPriority() != Thread.NORM_PRIORITY) {


                t.setPriority(Thread.NORM_PRIORITY);
            }
            return t;
        }
    }
}
Finally, we implement the thread pool management function,
- By
ThreadPoolConfigPropertiesreading the thread pool configuration information, and then generating the correspondingMonitorThreadPoolthread pool object based on the information. - Through the thread pool name
poolName, provide the corresponding thread pool instance.
/**
 * 线程池管理上下文
 */
@Component
@Slf4j
public class ThreadPoolManager {


    @Autowired
    private ThreadPoolConfigProperties threadPoolConfigProperties;
    /**
     * 存储线程池对象
     */
    public Map<String, MonitorThreadPool> threadPoolExecutorMap = new HashMap<>();

    /**
     * 根据配置信息,初始化线程池
     */
    @PostConstruct
    public void init() {


        createThreadPools(threadPoolConfigProperties);
    }

    /**
     * 初始化线程池的创建
     *
     * @param threadPoolConfigProperties
     */
    private void createThreadPools(ThreadPoolConfigProperties threadPoolConfigProperties) {


        threadPoolConfigProperties.getExecutors().forEach(config -> {


            if (!threadPoolExecutorMap.containsKey(config.getThreadPoolName())) {


                MonitorThreadPool threadPoolMonitor = new MonitorThreadPool(
                        config.getCorePoolSize(),
                        config.getMaxPoolSize(),
                        config.getKeepAliveTime(),
                        config.getUnit(),
                        new LinkedBlockingQueue<Runnable>(config.getQueueCapacity()),
                        config.getThreadPoolName()
                );
                threadPoolExecutorMap.put(config.getThreadPoolName(),
                        threadPoolMonitor);
            }
        });
    }

    // 根据线程池名称,获取对应线程池实例
    public MonitorThreadPool getThreadPoolExecutor(String poolName) {


        MonitorThreadPool threadPoolExecutorForMonitor = threadPoolExecutorMap.get(poolName);
        if (threadPoolExecutorForMonitor == null) {


            throw new RuntimeException("找不到名字为" + poolName + "的线程池");
        }
        return threadPoolExecutorForMonitor;
    }

    // 获取线程池Map
    public Map<String, MonitorThreadPool> getThreadPoolExecutorMap() {


        return threadPoolExecutorMap;
    }

}
At this point, we have implemented a basic thread pool configuration and monitoring function,
- The corresponding thread pool can be instantiated through the configuration file
- When the thread pool is running, it will print detailed indicator information in the relevant lifecycle methods for developers' reference.
In order to verify whether the thread pool function implemented above meets the requirements, we write another test interface,
/**
 * 线程池测试接口
 */
@RestController
@Slf4j
public class ThreadPoolController {


    @Autowired
    private ThreadPoolManager threadPoolManager;

    @GetMapping("/execute")
    public String doExecute() {


        threadPoolManager.getThreadPoolExecutorMap().forEach((poolName, monitorThreadPool) -> {


            for (int i = 0; i < 100; i++) {


                int taskId = i;
                monitorThreadPool.execute(() -> {


                    try {


                        log.info("run task:" + taskId);
                        Thread.sleep(new Random().nextInt(4000));
                    } catch (InterruptedException e) {


                        e.printStackTrace();
                    }
                });
            }
        });
        return "success";
    }
}
This interface is used to submit 100 tasks to each thread pool.
Next, let's look at some of the output results:
 [   user-thread-pool-1-thread-1]   LN:? user-thread-pool-monitor: 任务耗时: 2849 ms, 初始线程数: 4, 核心线程数: 4, 执行的任务数量: 4, 已完成任务数量: 92, 任务总数: 100, 队列里缓存的任务数量: 4, 池中存在的最大线程数: 4, 最大允许的线程数: 8,  线程空闲时间: 1000, 线程池是否关闭: false, 线程池是否终止: false
 [   user-thread-pool-1-thread-1]   LN:? run task:96
 [   user-thread-pool-1-thread-4]   LN:? user-thread-pool-monitor: 任务耗时: 3407 ms, 初始线程数: 4, 核心线程数: 4, 执行的任务数量: 4, 已完成任务数量: 93, 任务总数: 100, 队列里缓存的任务数量: 3, 池中存在的最大线程数: 4, 最大允许的线程数: 8,  线程空闲时间: 1000, 线程池是否关闭: false, 线程池是否终止: false
 [   user-thread-pool-1-thread-4]   LN:? run task:97
 [  order-thread-pool-2-thread-2]   LN:? order-thread-pool-monitor: 任务耗时: 2266 ms, 初始线程数: 2, 核心线程数: 2, 执行的任务数量: 2, 已完成任务数量: 52, 任务总数: 100, 队列里缓存的任务数量: 46, 池中存在的最大线程数: 2, 最大允许的线程数: 4,  线程空闲时间: 2000, 线程池是否关闭: false, 线程池是否终止: false
 [  order-thread-pool-2-thread-2]   LN:? run task:54
 [   user-thread-pool-1-thread-1]   LN:? user-thread-pool-monitor: 任务耗时: 1553 ms, 初始线程数: 4, 核心线程数: 4, 执行的任务数量: 4, 已完成任务数量: 94, 任务总数: 100, 队列里缓存的任务数量: 2, 池中存在的最大线程数: 4, 最大允许的线程数: 8,  线程空闲时间: 1000, 线程池是否关闭: false, 线程池是否终止: false
 [   user-thread-pool-1-thread-1]   LN:? run task:98
 [   user-thread-pool-1-thread-3]   LN:? user-thread-pool-monitor: 任务耗时: 2396 ms, 初始线程数: 4, 核心线程数: 4, 执行的任务数量: 4, 已完成任务数量: 95, 任务总数: 100, 队列里缓存的任务数量: 1, 池中存在的最大线程数: 4, 最大允许的线程数: 8,  线程空闲时间: 1000, 线程池是否关闭: false, 线程池是否终止: false
 [   user-thread-pool-1-thread-3]   LN:? run task:99
 [   user-thread-pool-1-thread-4]   LN:? user-thread-pool-monitor: 任务耗时: 2017 ms, 初始线程数: 4, 核心线程数: 4, 执行的任务数量: 4, 已完成任务数量: 96, 任务总数: 100, 队列里缓存的任务数量: 0, 池中存在的最大线程数: 4, 最大允许的线程数: 8,  线程空闲时间: 1000, 线程池是否关闭: false, 线程池是否终止: false
 [  order-thread-pool-2-thread-1]   LN:? order-thread-pool-monitor: 任务耗时: 2713 ms, 初始线程数: 2, 核心线程数: 2, 执行的任务数量: 2, 已完成任务数量: 53, 任务总数: 100, 队列里缓存的任务数量: 45, 池中存在的最大线程数: 2, 最大允许的线程数: 4,  线程空闲时间: 2000, 线程池是否关闭: false, 线程池是否终止: false
 [  order-thread-pool-2-thread-1]   LN:? run task:55
 [   user-thread-pool-1-thread-2]   LN:? user-thread-pool-monitor: 任务耗时: 3932 ms, 初始线程数: 4, 核心线程数: 4, 执行的任务数量: 3, 已完成任务数量: 97, 任务总数: 100, 队列里缓存的任务数量: 0, 池中存在的最大线程数: 4, 最大允许的线程数: 8,  线程空闲时间: 1000, 线程池是否关闭: false, 线程池是否终止: false
 [  order-thread-pool-2-thread-1]   LN:? order-thread-pool-monitor: 任务耗时: 467 ms, 初始线程数: 2, 核心线程数: 2, 执行的任务数量: 2, 已完成任务数量: 54, 任务总数: 100, 队列里缓存的任务数量: 44, 池中存在的最大线程数: 2, 最大允许的线程数: 4,  线程空闲时间: 2000, 线程池是否关闭: false, 线程池是否终止: false
 [  order-thread-pool-2-thread-1]   LN:? run task:56
Step 2: Dynamically configure thread pool parameters
The core problem facing the use of thread pools is that the parameters of thread pools are not easy to configure .
On the one hand, the operating mechanism of the thread pool is not well understood, and a reasonable configuration needs to rely heavily on the personal experience and knowledge of developers;
On the other hand, the performance of the thread pool is closely related to the type of task, and the running conditions of IO-intensive and CPU-intensive tasks are very different. As a result, the industry does not have some mature experience strategies to help developers refer to.
Unreasonable thread pool parameter settings, such as the number of core threads, maximum number of threads, task queue capacity, idle thread survival time, etc., may cause the thread pool to fail to process tasks effectively, or consume too many system resources, and even cause memory overflow.
So is there a fixed calculation formula that allows developers to easily calculate the parameters of the thread pool in a certain scenario?
The following figure shows some mainstream thread pool parameter configuration schemes in the industry:
The number of threads in class 1: IO-intensive tasks determine the number of threads
CPU核心数两倍的线程
Number of Class 2 Threads: CPU-intensive tasks determine the number of threads
线程数量应当等于CPU的核心数
Class 3 Threads: Determine the number of threads for mixed tasks
最佳线程数目 =(线程等待时间与线程CPU时间之比 + 1)* CPU核数
The above thread pool calculation formula. For details, please refer to the PDF of Nien's "Java High Concurrency Core Programming Volume 2 Enhanced Edition" by Tsinghua University Press.
In fact, most threads are mixed threads, and it is difficult to accurately estimate the thread waiting time and thread CPU time. Therefore, an effective method is: According to the monitoring indicators, the number of threads in the standard thread pool is dynamic.
How to realize the dynamic configuration and immediate effect of thread pool parameters? An effective method is to migrate the parameters of the thread pool from the code to the distributed configuration center.
The core design of the dynamic thread pool includes the following three aspects:
- Simplified thread pool configuration:
There are 8 thread pool construction parameters, but the core is 3: ,corePoolSize,maximumPoolSize,workQueuewhich determine the task allocation and thread allocation strategy of the thread pool.
In practical applications, there are mainly two scenarios for us to obtain concurrency:
(1) Executing subtasks in parallel to improve response speed. In this case, a synchronous queue should be used, and no tasks should be cached, but executed immediately.
(2) Execute large batches of tasks in parallel to improve throughput. In this case, a bounded queue should be used to buffer a large number of tasks. The queue capacity must be declared to prevent unlimited accumulation of tasks.
Therefore, the thread pool only needs to provide the configuration of these three key parameters, and provide the choice of two queues, which can meet the vast majority of business needs. - Parameters can be modified dynamically:
In order to solve the problems of poor parameter matching and high cost of modifying parameters.
We need to encapsulate the thread pool so that the thread pool can listen to external messages and modify the configuration according to the messages.
The configuration of the thread pool needs to be placed on the platform side so that developers can easily view and modify the configuration of the thread pool. - Increase thread pool monitoring :
Without status observation, there is no basis for improvement.
We have added monitoring capabilities to the lifecycle of tasks executed by the thread pool to help developers understand the status of the thread pool.
For the above three aspects, we first implement the functional design of the first two aspects, and then we implement the third aspect in the subsequent steps.
The specific implementation steps are as follows:
1 Centralized management of parameters using the configuration center
Migrate thread pool property configuration from local configuration file to Nacosregistry.
2 Let the configuration of nacos take effect dynamically
ThreadPoolConfigPropertiesThe class is @RefreshScopeannotated, which is used to nacossynchronize to the system object in real time after the configuration is modified on the network.
3 Modify the parameters of the thread pool
ThreadPoolManagerListen to EnvironmentChangeEventevents and modify the corresponding thread pool properties through ThreadPoolConfigPropertiesinstances.
1. Use nacos in the configuration center for centralized management of parameters
NacosA configuration example is shown in the figure below:
2. Let the configuration of nacos take effect dynamically
ThreadPoolConfigPropertiesAfter modifying the configuration on the class plus @RefreshScope 注解, 用于在nacos`, it will be synchronized to the system object in real time.
@RefreshScope
public class ThreadPoolConfigProperties
After modifying ThreadPoolConfigProperties, next, springboot will trigger the related EnvironmentChangeEvent environment change event.
EnvironmentChangeEvent event : environment change event.
Receiving this event indicates that configuration data in the application has changed.
EnvironmentChangeEventAkeyscollection of . When the configuration is dynamically modified, the changed configuration valuekeywill be set in the eventkeyscollection .
ThreadPoolManagerListen to EnvironmentChangeEventevents and modify the corresponding thread pool properties through ThreadPoolConfigPropertiesinstances.
/**
 * 调整线程池
 *
 * @param threadPoolConfigProperties
 */
private void changeThreadPools(ThreadPoolConfigProperties threadPoolConfigProperties) {


    threadPoolConfigProperties.getExecutors().forEach(config -> {


        ThreadPoolExecutor threadPoolExecutor = threadPoolExecutorMap.get(config.getThreadPoolName());
        if (Objects.nonNull(threadPoolExecutor)) {


            threadPoolExecutor.setCorePoolSize(config.getCorePoolSize());
            threadPoolExecutor.setMaximumPoolSize(config.getMaxPoolSize());
            threadPoolExecutor.setKeepAliveTime(config.getKeepAliveTime(), config.getUnit());
        }
    });
}

/**
     * 监听事件
     */
@EventListener
public void envListener(EnvironmentChangeEvent event) {


    log.info("配置发生变更" + event);
    changeThreadPools(threadPoolConfigProperties);
}
3. Modify the parameters of the thread pool
Here we changeThreadPoolsonly modify the three attributes of the thread pool corePoolSize, maximumPoolSize, in the method keepAliveTime. Because the thread pool core class ThreadPoolExecutorsupports dynamic modification of these three attributes.
Take setCorePoolSizethe method as an example, this method is used to set the number of cores of the thread. This method will override any value set in the constructor.
If the new value is less than the current value, excess existing threads will be terminated the next time they become idle.
If larger, new threads will be started to execute any queued tasks if necessary.
The troublesome problem is: the thread pool core class ThreadPoolExecutordoes not support modifying the size of the queue capacity. Therefore, queue-capacity is not easy to modify.
As for why modifying the queue capacity is not supported, because BlockingQueuethe interface-related implementation classes do not support dynamic modification of the capacity.
Taking ArrayBlockingQueueand LinkedBlockingQueueas an example, ArrayBlockingQueuethe bottom layer is an array with a fixed size.
The LinkedBlockingQueuecapacity is modified by final and cannot be modified.
private final int capacity;
If we want to ArrayBlockingQueuemake a transformation based on it, but modifying the size will inevitably involve recreating the array, as well as the data migration of the old and new arrays, which is a bit complicated.
If it is considered to be based on LinkedBlockingQueuetransformation, we only need to remove the modification capacityto finalachieve dynamic adjustment.
But there is a problem. LinkedBlockingQueueMany of the specific implementations are designed based on unchanged capacity, and the functions involved need to be adjusted.
Students who are interested in this function can refer to the elasticsearchofficial ResizableBlockingQueuequeue.
The queue supports adjustCapacitydynamic modification of the queue capacity through methods.
package org.elasticsearch.common.util.concurrent;

import java.util.concurrent.BlockingQueue;

/**
 * Extends the {@code SizeBlockingQueue} to add the {@code adjustCapacity} method, which will adjust
 * the capacity by a certain amount towards a maximum or minimum.
 */
final class ResizableBlockingQueue<E> extends SizeBlockingQueue<E> {


    private volatile int capacity;

    ResizableBlockingQueue(BlockingQueue<E> queue, int initialCapacity) {


        super(queue, initialCapacity);
        this.capacity = initialCapacity;
    }

    @Override
    public int capacity() {


        return this.capacity;
    }

    @Override
    public int remainingCapacity() {


        return Math.max(0, this.capacity());
    }

    /** Resize the limit for the queue, returning the new size limit */
    public synchronized int adjustCapacity(int optimalCapacity, int adjustmentAmount, int minCapacity, int maxCapacity) {


        assert adjustmentAmount > 0 : "adjustment amount should be a positive value";
        assert optimalCapacity >= 0 : "desired capacity cannot be negative";
        assert minCapacity >= 0 : "cannot have min capacity smaller than 0";
        assert maxCapacity >= minCapacity : "cannot have max capacity smaller than min capacity";

        if (optimalCapacity == capacity) {


            // Yahtzee!
            return this.capacity;
        }

        if (optimalCapacity > capacity + adjustmentAmount) {


            // adjust up
            final int newCapacity = Math.min(maxCapacity, capacity + adjustmentAmount);
            this.capacity = newCapacity;
            return newCapacity;
        } else if (optimalCapacity < capacity - adjustmentAmount) {


            // adjust down
            final int newCapacity = Math.max(minCapacity, capacity - adjustmentAmount);
            this.capacity = newCapacity;
            return newCapacity;
        } else {


            return this.capacity;
        }
    }
}
Now, let's verify nacoswhether the configuration takes effect in real time after modifying the thread pool properties.
After the project starts, modify the configuration as follows:
monitor:
  thread:
    executors[0]:
      thread-pool-name: user-thread-pool
      core-pool-size: 6
      max-pool-size: 8
      queue-capacity: 1000
      keep-alive-time: 1000
    executors[1]:
      thread-pool-name: order-thread-pool
      core-pool-size: 3
      max-pool-size: 4
      queue-capacity: 2000
      keep-alive-time: 2000
The following logs can be seen in the console:
[ngPolling.fixed-127.0.0.1_8848] c.c.c.n.d.c.thread.ThreadPoolManager     LN:? 配置发生变更org.springframework.cloud.context.environment.EnvironmentChangeEvent[source=org.springframework.boot.web.servlet.context.AnnotationConfigServletWebServerApplicationContext@54534abf, started on Thu May 11 10:38:41 CST 2023, parent: org.springframework.context.annotation.AnnotationConfigApplicationContext@aa549e5]
[ngPolling.fixed-127.0.0.1_8848] o.s.c.e.event.RefreshEventListener       LN:? Refresh keys changed: [monitor.thread.executors[1].core-pool-size, monitor.thread.executors[0].core-pool-size]
Run the test interface, some logs are as follows:
[   user-thread-pool-1-thread-1] c.c.c.n.d.c.thread.MonitorThreadPool     LN:? user-thread-pool-monitor: 任务耗时: 2336 ms, 初始线程数: 6, 核心线程数: 6, 执行的任务数量: 6, 已完成任务数量: 293, 任务总数: 300, 队列里缓存的任务数量: 1, 池中存在的最大线程数: 6, 最大允许的线程数: 8,  线程空闲时间: 1000, 线程池是否关闭: false, 线程池是否终止: false
[   user-thread-pool-1-thread-1] c.c.c.n.d.c.ThreadPoolController         LN:? run task:99
[   user-thread-pool-1-thread-6] c.c.c.n.d.c.thread.MonitorThreadPool     LN:? user-thread-pool-monitor: 任务耗时: 2175 ms, 初始线程数: 6, 核心线程数: 6, 执行的任务数量: 6, 已完成任务数量: 294, 任务总数: 300, 队列里缓存的任务数量: 0, 池中存在的最大线程数: 6, 最大允许的线程数: 8,  线程空闲时间: 1000, 线程池是否关闭: false, 线程池是否终止: false
[  order-thread-pool-2-thread-2] c.c.c.n.d.c.thread.MonitorThreadPool     LN:? order-thread-pool-monitor: 任务耗时: 2019 ms, 初始线程数: 3, 核心线程数: 3, 执行的任务数量: 3, 已完成任务数量: 247, 任务总数: 300, 队列里缓存的任务数量: 50, 池中存在的最大线程数: 3, 最大允许的线程数: 4,  线程空闲时间: 2000, 线程池是否关闭: false, 线程池是否终止: false
[  order-thread-pool-2-thread-2] c.c.c.n.d.c.ThreadPoolController         LN:? run task:50
[  order-thread-pool-2-thread-3] c.c.c.n.d.c.thread.MonitorThreadPool     LN:? order-thread-pool-monitor: 任务耗时: 3586 ms, 初始线程数: 3, 核心线程数: 3, 执行的任务数量: 3, 已完成任务数量: 248, 任务总数: 300, 队列里缓存的任务数量: 49, 池中存在的最大线程数: 3, 最大允许的线程数: 4,  线程空闲时间: 2000, 线程池是否关闭: false, 线程池是否终止: false
Step 3: Monitor the thread pool
So far, we have implemented Nacosthe function of observing the thread running status through the log, and dynamically adjusting the core parameters of the thread pool through the collection with the registration center.
But as a developer, do you often encounter such problems:
When your application is abnormal or performance drops, you need to spend a lot of time and effort to view log files, analyze the cause and solution of the problem. Log files are often scattered on different servers, which are not easy to manage and query centrally.
Log files can also be too large or too many, resulting in insufficient disk space or out of memory.
The format and content of the log files may also be inconsistent or unclear, making it difficult for you to read and understand.
In short, monitoring through logs is an inconvenient and inefficient way, which will affect your development efficiency and application quality.
Is there a better way to monitor your application? The answer is yes.
Spring Boot Actuator is a sub-project of Spring Boot that can add some production-level features to your application, and you only need very little configuration.
These functions include:
- Endpoint: These are special URLs that expose internal information about your application, such as health status, metrics, environment variables, logs, etc. You can
JMXaccess these Endpoints through HTTP or through some tools to visualize the information. - Health: This is an Endpoint that can display the health status of your application, including the status of the application itself and its dependent components (such as database, cache, message queue, etc.). You can customize health indicators and details.
- Metrics: This is an Endpoint that can display various indicators of your application, including memory, CPU, threads, HTTP requests, etc. You can customize metrics and collection methods.
- Auditing: This is a function that can record important events of your application, such as authentication, authorization, failure, etc. You can customize audit events and storage methods.
- Logging: This is a feature that allows you to view and modify the logging level of your application at runtime. You can
JMXmanipulate logs through Endpoint or .
Through Endpoint, you can quickly understand whether your application is running normally, whether there are potential problems or risks, and how to optimize your application performance and resource utilization.
First introduce the actuator dependency
<!--健康检查-->
<dependency>
    <groupId>org.springframework.boot</groupId>
    <artifactId>spring-boot-starter-actuator</artifactId>
</dependency>
Next, we customize an Endpoint class to expose thread pool related indicator information.
@Configuration
@Endpoint(id = "thread")
public class ThreadPoolEndpoint {


    @Autowired
    private ThreadPoolManager threadPoolManager;

    @ReadOperation
    public Map<String, Object> threadPoolsMetric() {


        Map<String, Object> metricMap = new HashMap<>();
        List<Map> threadPools = new ArrayList<>();
        threadPoolManager.getThreadPoolExecutorMap().forEach((k, v) -> {


            MonitorThreadPool tpe = (MonitorThreadPool) v;
            Map<String, Object> poolInfo = new HashMap<>();
            poolInfo.put("thread.pool.name", k);
            poolInfo.put("thread.pool.core.size", tpe.getCorePoolSize());
            poolInfo.put("thread.pool.largest.size", tpe.getLargestPoolSize());
            poolInfo.put("thread.pool.max.size", tpe.getMaximumPoolSize());
            poolInfo.put("thread.pool.thread.count", tpe.getPoolSize());
            poolInfo.put("thread.pool.max.costTime", tpe.getMaxCostTime());
            poolInfo.put("thread.pool.average.costTime", tpe.getAverageCostTime());
            poolInfo.put("thread.pool.min.costTime", tpe.getMinCostTime());
            poolInfo.put("thread.pool.active.count", tpe.getActiveCount());
            poolInfo.put("thread.pool.completed.taskCount", tpe.getCompletedTaskCount());
            poolInfo.put("thread.pool.queue.name", tpe.getQueue().getClass().getName());
            poolInfo.put("thread.pool.rejected.name", tpe.getRejectedExecutionHandler().getClass().getName());
            poolInfo.put("thread.pool.task.count", tpe.getTaskCount());
            threadPools.add(poolInfo);
        });
        metricMap.put("threadPools", threadPools);
        return metricMap;
    }
}
application.ymlExpose the port in
#### 暴露端点
management:
  endpoints:
    web:
      base-path: "/actuator"  # 配置 Endpoint 的基础路径
      exposure:
        include: '*'  #在yaml 文件属于关键字,所以需要加引号
Access the endpoint information through httpthe interface: /service-provider-demo/actuator/thread :
{


    "threadPools": [
        {


            "thread.pool.queue.name": "java.util.concurrent.LinkedBlockingQueue",
            "thread.pool.core.size": 6,
            "thread.pool.min.costTime": 9,
            "thread.pool.completed.taskCount": 300,
            "thread.pool.max.costTime": 7185,
            "thread.pool.task.count": 300,
            "thread.pool.name": "user-thread-pool",
            "thread.pool.largest.size": 6,
            "thread.pool.rejected.name": "java.util.concurrent.ThreadPoolExecutor$AbortPolicy",
            "thread.pool.active.count": 0,
            "thread.pool.thread.count": 6,
            "thread.pool.average.costTime": 1918,
            "thread.pool.max.size": 8
        },
        {


            "thread.pool.queue.name": "java.util.concurrent.LinkedBlockingQueue",
            "thread.pool.core.size": 3,
            "thread.pool.min.costTime": 61,
            "thread.pool.completed.taskCount": 300,
            "thread.pool.max.costTime": 3979,
            "thread.pool.task.count": 300,
            "thread.pool.name": "order-thread-pool",
            "thread.pool.largest.size": 3,
            "thread.pool.rejected.name": "java.util.concurrent.ThreadPoolExecutor$AbortPolicy",
            "thread.pool.active.count": 0,
            "thread.pool.thread.count": 3,
            "thread.pool.average.costTime": 1990,
            "thread.pool.max.size": 4
        }
    ]
}
Step 4: Access Prometheus
Prometheus is an open source monitoring and alerting system, which can pull indicator data from the application's Endpoint and provide query and visualization functions. Using Prometheus can get the following benefits:
- Prometheus can periodically pull indicator data from the application's Endpoint and store it in its own time series database. This makes it possible to view the historical data of the application at any point in time, not just the current data. We can also perform operations such as aggregation, filtering, and calculation on the data to get more insights.
- Prometheus can set alarm rules for indicator data, and when certain conditions are met, it can send us notifications, such as email, SMS, Slack, etc. In this way, we can discover and deal with application anomalies or risks in a timely manner without manual monitoring.
- Prometheus can be integrated with other tools, such as
Grafana,Alertmanageretc., to provide richer visualization and alarm management functions. We can use itGrafanato create beautiful and useful dashboards to display your indicator data. We may also useAlertmanagerto manage and distribute your alert notifications.
In short, using Prometheus, we can monitor and manage our applications more conveniently and efficiently, and improve our application quality and user satisfaction.
GrafanaIt is an open source data visualization and monitoring platform, which can obtain data from a variety of data sources (such as Prometheus, InfluxDB, Elasticsearchetc.) and create beautiful and practical dashboards to display your indicator data.
In addition to the visualization function, Grafanait also provides an alarm function, which allows you to set alarm rules for your indicator data. When certain conditions are met, it can send you notifications, such as emails, SMS, Slack, etc.
Next, we will show how to report the indicator information of the thread pool Prometheus, and Grafanadisplay the indicator data in the form of a chart.
1. Install and configure prometheus and Grafana
For the convenience of demonstration, we directly use docker installation on this machine,
First create relevant folders, config is the configuration folder grafana-storagefor storing grafana data and prometheus-dataprometheus data,
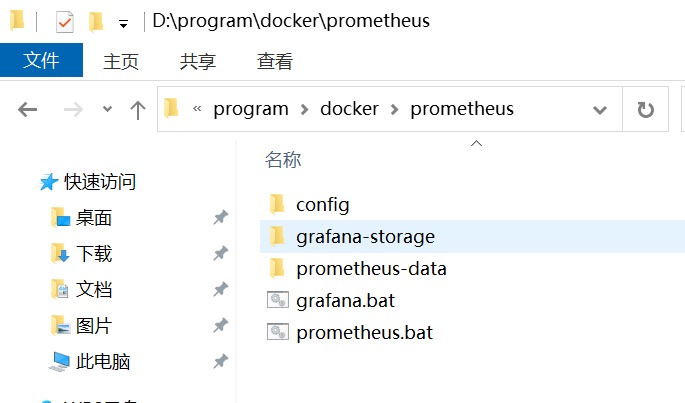
Under the config folder, create a new prometheus.ymlconfiguration file:
global:
  scrape_interval:     60s
  evaluation_interval: 60s

scrape_configs:
  - job_name: prometheus
    static_configs:
      - targets: ['10.23.48.43:9300']
        labels:
          instance: prometheus
  - job_name: springboot
    metrics_path: '/service-provider-demo/actuator/prometheus'
    scrape_interval: 5s
    static_configs:
      - targets: ['10.23.48.43:28088']
        labels:
          instance: service-provider-demo
Among them 10.23.48.43:28088are the ip and port of the service-provider-demo project.
create prometheus.bat:
docker run -d --name=prometheus -p 9300:9090 -v D:\program\docker\prometheus\config\prometheus.yml:/etc/prometheus/prometheus.yml -v D:\program\docker\prometheus\prometheus-data:/prometheus prom/prometheus
create grafana.bat:
docker run -d -p 9400:3000 --name=grafana -v D:\program\docker\prometheus\grafana-storage:/var/lib/grafana grafana/grafana
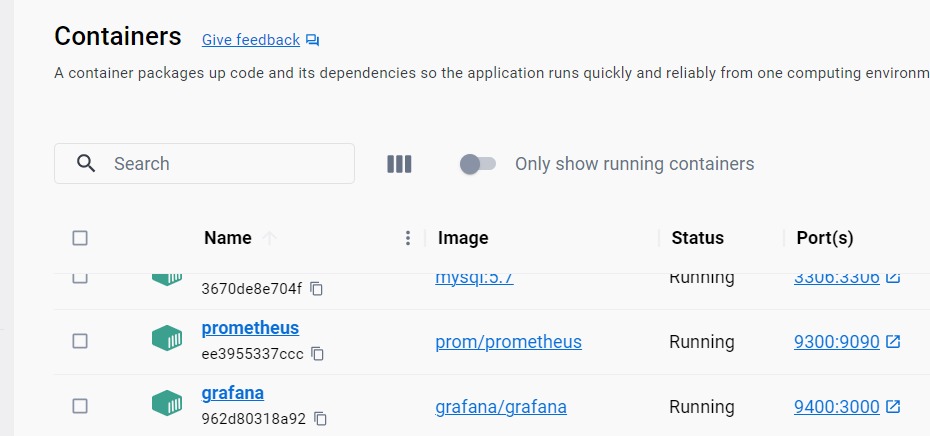
Click prometheus.batand grafana.batscript to start prometheusand respectively grafana. The following picture shows the docker desktop client interface after startup:
The following figure shows the prometheus management page: Prometheus Time Series Collection and Processing Server

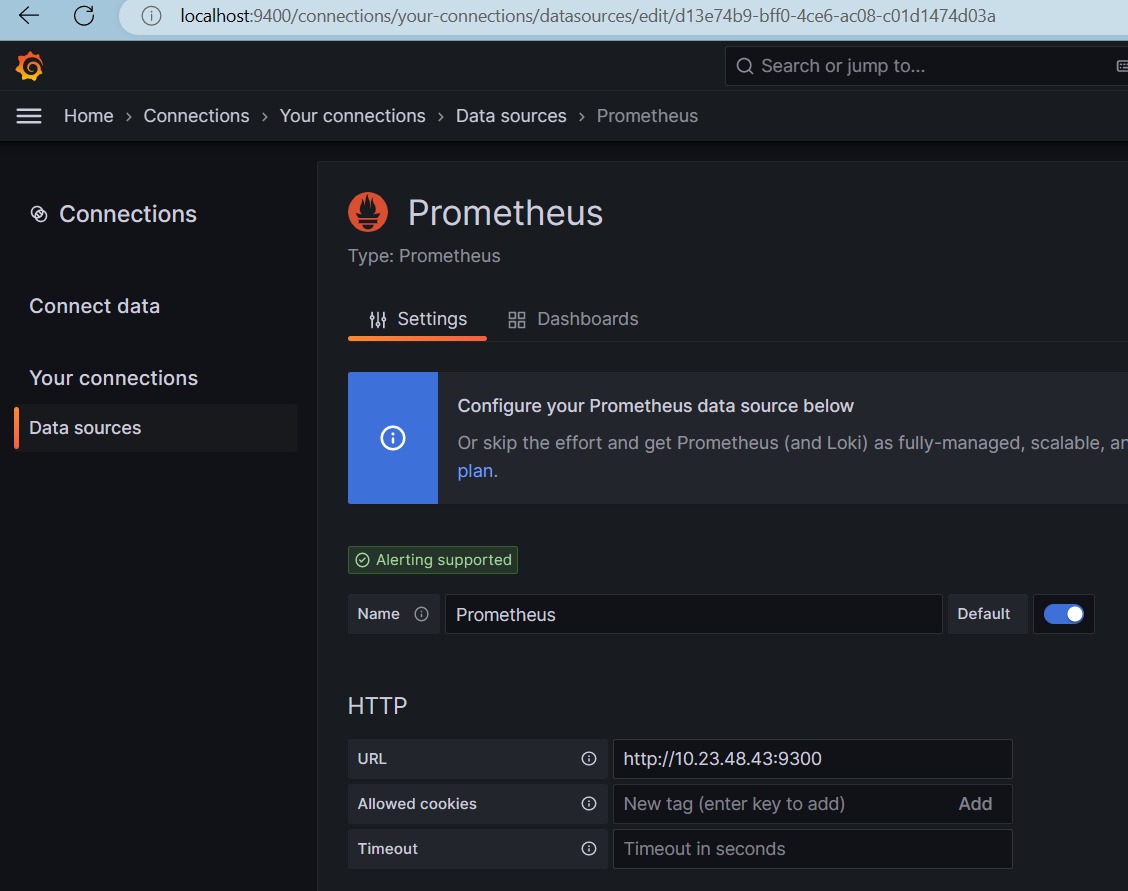
The following picture shows the grafana management page: Data sources - Your connections - Connections - Grafana
In the connections interface, add the native Prometheus data source

In the Dashboards interface, select JVMthe dashboard, and you can see that Application is the related indicator information chart service-provider-demoof the project :JVM
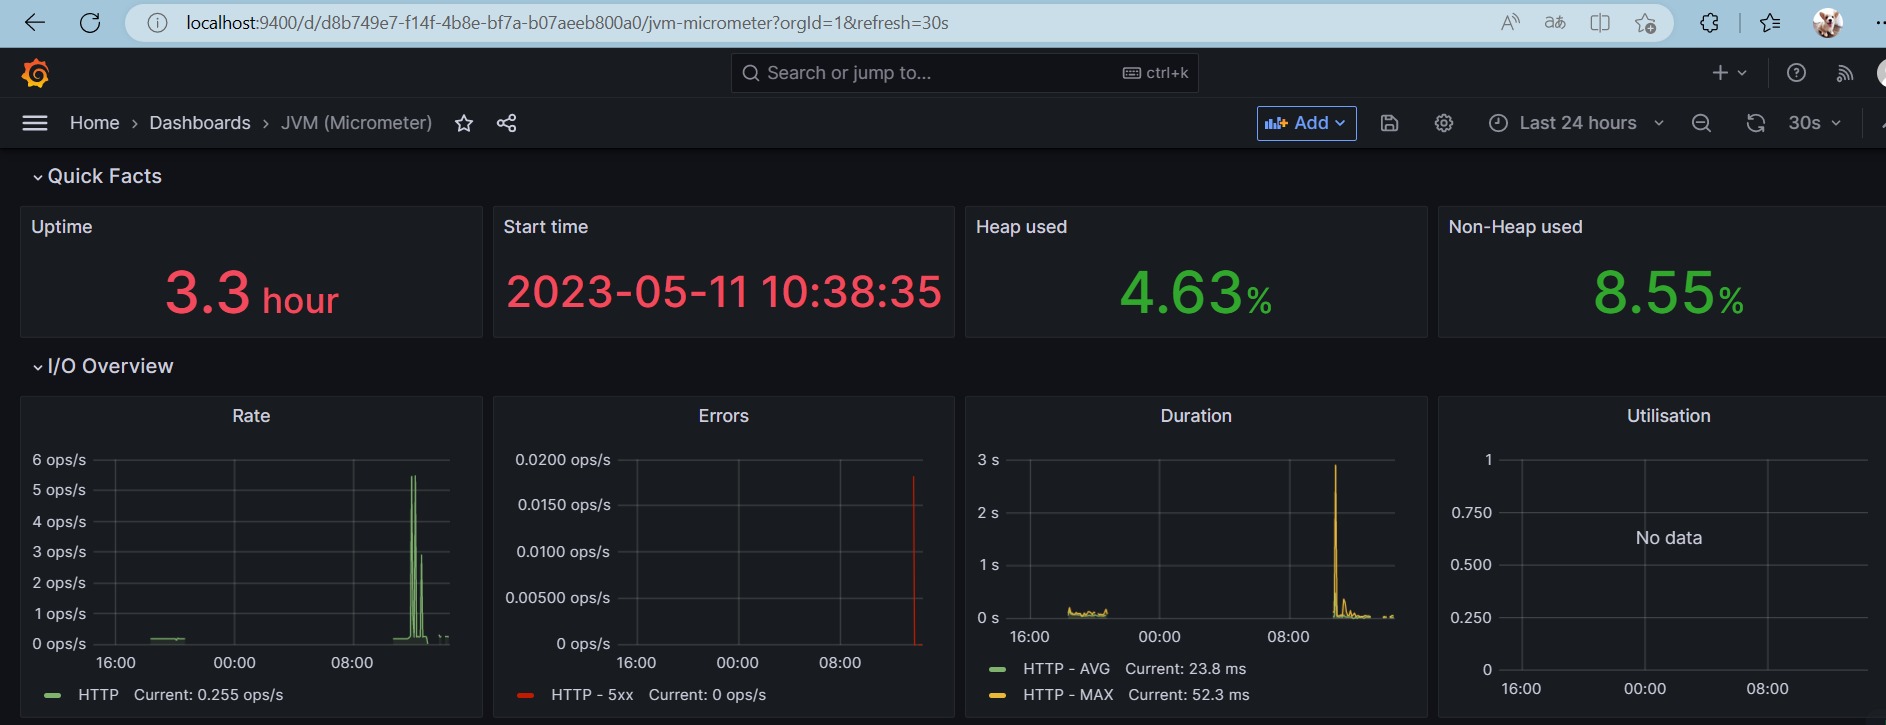
At this point, our environment is configured.
2. Collect thread pool indicator information
First, introduce prometheus-related dependencies in the project:
<!--健康检查-->
<dependency>
    <groupId>org.springframework.boot</groupId>
    <artifactId>spring-boot-starter-actuator</artifactId>
</dependency>

<dependency>
    <groupId>io.micrometer</groupId>
    <artifactId>micrometer-registry-prometheus</artifactId>
</dependency>
application.ymlSet relevant information in the file :
#### 暴露端点
management:
  endpoints:
    web:
      base-path: "/actuator"  # 配置 Endpoint 的基础路径
      exposure:
        include: '*'  #在yaml 文件属于关键字,所以需要加引号
  endpoint:
    health:
      show-details: always
  metrics:
    tags:
      application: ${

    spring.application.name}
    export:
      prometheus:
        enabled: true
        step: 20s
        descriptions: true
Next, we need to use Micrometer to create and manage our thread pool metrics data.
Micrometer is a metric tool library that provides a common set APIso that projects can use the same metrics in different monitoring systems.
We need to inject a MeterRegistrytype of bean, which is Micrometerthe core interface, responsible for registering and managing various types of indicators.
Micrometer supports various types of indicators, such as Counter (counter), Gauge (measurement), Timer (timer), DistributionSummary(distribution summary), etc. We can choose the appropriate types according to our needs, and add names, labels and descriptions to them.
Here, we will register 4 indicators, which are
threadPoolCompletedTaskCount: Number of completed tasks, Counter type (incrementing)threadPoolTotalCostTime: Total time spent on completed tasks, Counter type (incremental)threadPoolActiveCount: Number of current active tasks, Gauge type (varies according to the actual situation)taskCostTimeHistogram: Histogram, task time-consuming distribution, Histogram type (to count the cumulative number of tasks under different time-consuming)
Below is the code used to initialize the above 4 indicators:
@Configuration
public class PrometheusComponent implements ApplicationContextAware {


    private static PrometheusComponent instance;
    /**
     * 已完成任务数
     */
    private Counter threadPoolCompletedTaskCount;
    /**
     * 已完成任务总耗时
     */
    private Counter threadPoolTotalCostTime;
    /**
     * 当前活跃任务数
     */
    private Gauge threadPoolActiveCount;
    /**
     * 直方图,任务耗时分布
     */
    private Histogram taskCostTimeHistogram;
    /**
     * 配置MeterRegistry
     * @param applicationName 应用名称
     * @return
     */
    @Bean
    MeterRegistryCustomizer<MeterRegistry> configurer(@Value("${spring.application.name}") String applicationName)     {


        return (registry) -> registry.config().commonTags("application", applicationName);
    }

    /**
     * 初始化指标对象
     * @param applicationContext
     * @throws BeansException
     */
    @Override
    public void setApplicationContext(ApplicationContext applicationContext) throws BeansException {


        instance = this;
        CollectorRegistry collectorRegistry = applicationContext.getBean(CollectorRegistry.class);
        // 这里指定SpringBoot容器的CollectorRegistry,如果使用默认的会导致无法收集
        // 实例化指标,添加名称、标签和描述,注册到收集器里
        threadPoolCompletedTaskCount = Counter.build().name("thread_pool_task_completed_count").labelNames("poolName")
                .help("线程池已完成任务数").register(collectorRegistry);
        threadPoolTotalCostTime = Counter.build().name("thread_pool_total_cost_time").labelNames("poolName")
                .help("线程池已完成任务总耗时").register(collectorRegistry);

        threadPoolActiveCount = Gauge.build()
                .name("thread_pool_task_active_count").labelNames("poolName")
                .help("线程池当前活跃任务数").register(collectorRegistry);

        taskCostTimeHistogram = Histogram.build().labelNames("poolName")
                .name("thread_pool_task_cost_time").help("请求耗时分布")
                .register(collectorRegistry);
    }

    public static PrometheusComponent getInstance() {


        return instance;
    }

    public Counter threadPoolCompletedTaskCount() {


        return threadPoolCompletedTaskCount;
    }

    public Counter threadPoolTotalCostTime() {


        return threadPoolTotalCostTime;
    }

    public Gauge threadPoolActiveCount() {


        return threadPoolActiveCount;
    }

    public Histogram taskCostTimeHistogram() {


        return taskCostTimeHistogram;
    }
}
Improve MonitorThreadPoolthe thread pool class and add related indicator settings in related methods:
public class MonitorThreadPool extends ThreadPoolExecutor {


    // 用于统计任务耗时, 在任务开始时启动计时,任务结束时关闭计时,获取执行时长
    private ThreadLocal<Histogram.Timer> timerThreadLocal = new ThreadLocal<>();

     省略其它代码

    /**
     * 线程池立即关闭时,统计线程池情况
     */
    @Override
    public List<Runnable> shutdownNow() {


        // 统计已执行任务、正在执行任务、未执行任务数量
        LOGGER.info("{} 立即关闭线程池,已执行任务: {}, 正在执行任务: {}, 未执行任务数量: {}",
                this.poolName, this.getCompletedTaskCount(), this.getActiveCount(), this.getQueue().size());
        // 活跃任务数清零
        PrometheusComponent.getInstance().threadPoolActiveCount().labels(this.poolName).set(0);
        return super.shutdownNow();
    }

    /**
     * 任务执行之前,记录任务开始时间
     */
    @Override
    protected void beforeExecute(Thread t, Runnable r) {


        //记录任务开始时间
        startTimeThreadLocal.set(System.currentTimeMillis());
        // 活跃任务数 +1
        PrometheusComponent.getInstance().threadPoolActiveCount().labels(this.poolName).inc();
        // 开始计时
        timerThreadLocal.set(PrometheusComponent.getInstance().taskCostTimeHistogram()
                .labels(this.poolName)
                .startTimer());
        super.beforeExecute(t, r);
    }


    /**
     * 任务执行之后,计算任务结束时间
     */
    @Override
    protected void afterExecute(Runnable r, Throwable t) {


         省略其它代码
        // 总耗时增加
        PrometheusComponent.getInstance().threadPoolTotalCostTime().labels(this.poolName).inc((double) costTime);
        // 完成任务数+1
        PrometheusComponent.getInstance().threadPoolCompletedTaskCount().labels(this.poolName).inc();
        // 活跃任务数-1
        PrometheusComponent.getInstance().threadPoolActiveCount().labels(this.poolName).dec();
        // 当前任务耗时直方图统计
        Histogram.Timer timer = timerThreadLocal.get();
        if (timer != null) {


            timer.observeDuration();
            timerThreadLocal.remove();
        }
        super.afterExecute(r, t);
    }
}
3. Visual monitoring
- Start the project and initiate an interface request
GET http://localhost:28088/service-provider-demo/execute
- View indicator information through Endpoint
10.23.48.43:28088/service-provider-demo/actuator/prometheus
# HELP thread_pool_total_cost_time 线程池已完成任务总耗时
# TYPE thread_pool_total_cost_time counter
thread_pool_total_cost_time{

    poolName="order-thread-pool",} 203466.0
thread_pool_total_cost_time{

    poolName="user-thread-pool",} 201892.0
# HELP thread_pool_task_completed_count 线程池已完成任务数
# TYPE thread_pool_task_completed_count counter
thread_pool_task_completed_count{

    poolName="order-thread-pool",} 100.0
thread_pool_task_completed_count{

    poolName="user-thread-pool",} 100.0
# HELP thread_pool_task_active_count 线程池当前活跃任务数
# TYPE thread_pool_task_active_count gauge
thread_pool_task_active_count{

    poolName="order-thread-pool",} 0.0
thread_pool_task_active_count{

    poolName="user-thread-pool",} 0.0
# HELP thread_pool_task_cost_time 请求耗时分布
# TYPE thread_pool_task_cost_time histogram
thread_pool_task_cost_time_bucket{

    poolName="order-thread-pool",le="0.005",} 0.0
thread_pool_task_cost_time_bucket{

    poolName="order-thread-pool",le="0.01",} 0.0
thread_pool_task_cost_time_bucket{

    poolName="order-thread-pool",le="0.025",} 1.0
thread_pool_task_cost_time_bucket{

    poolName="order-thread-pool",le="0.05",} 2.0
thread_pool_task_cost_time_bucket{

    poolName="order-thread-pool",le="0.075",} 2.0
thread_pool_task_cost_time_bucket{

    poolName="order-thread-pool",le="0.1",} 2.0
thread_pool_task_cost_time_bucket{

    poolName="order-thread-pool",le="0.25",} 6.0
thread_pool_task_cost_time_bucket{

    poolName="order-thread-pool",le="0.5",} 14.0
thread_pool_task_cost_time_bucket{

    poolName="order-thread-pool",le="0.75",} 19.0
thread_pool_task_cost_time_bucket{

    poolName="order-thread-pool",le="1.0",} 24.0
thread_pool_task_cost_time_bucket{

    poolName="order-thread-pool",le="2.5",} 60.0
thread_pool_task_cost_time_bucket{

    poolName="order-thread-pool",le="5.0",} 100.0
thread_pool_task_cost_time_bucket{

    poolName="order-thread-pool",le="7.5",} 100.0
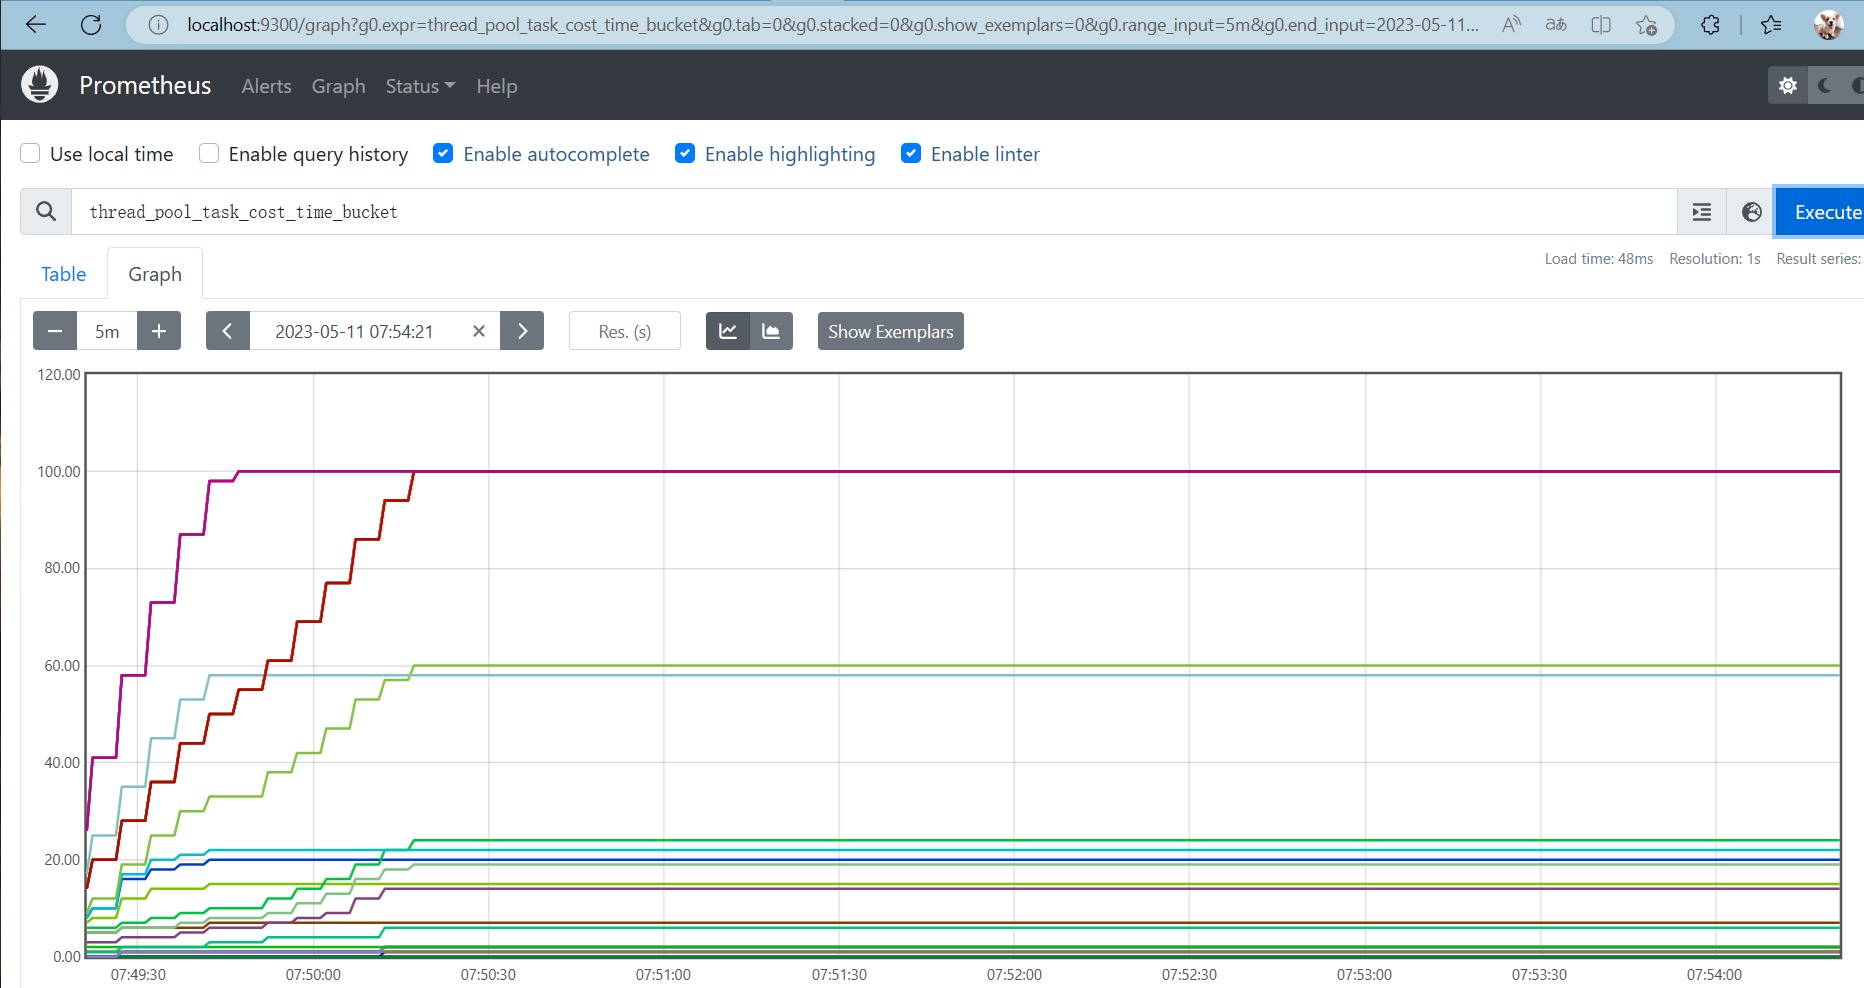
prometheusChart view indicator information
On the Graph page, enter thread_pool_task_cost_time_bucket and click the Execute button:
Grafanapage configuration diagram
First of all, enter JVM the dashboard, and we will add relevant views on the current page.
1) To configure the total time spent on tasks, click Add -> Visualization,
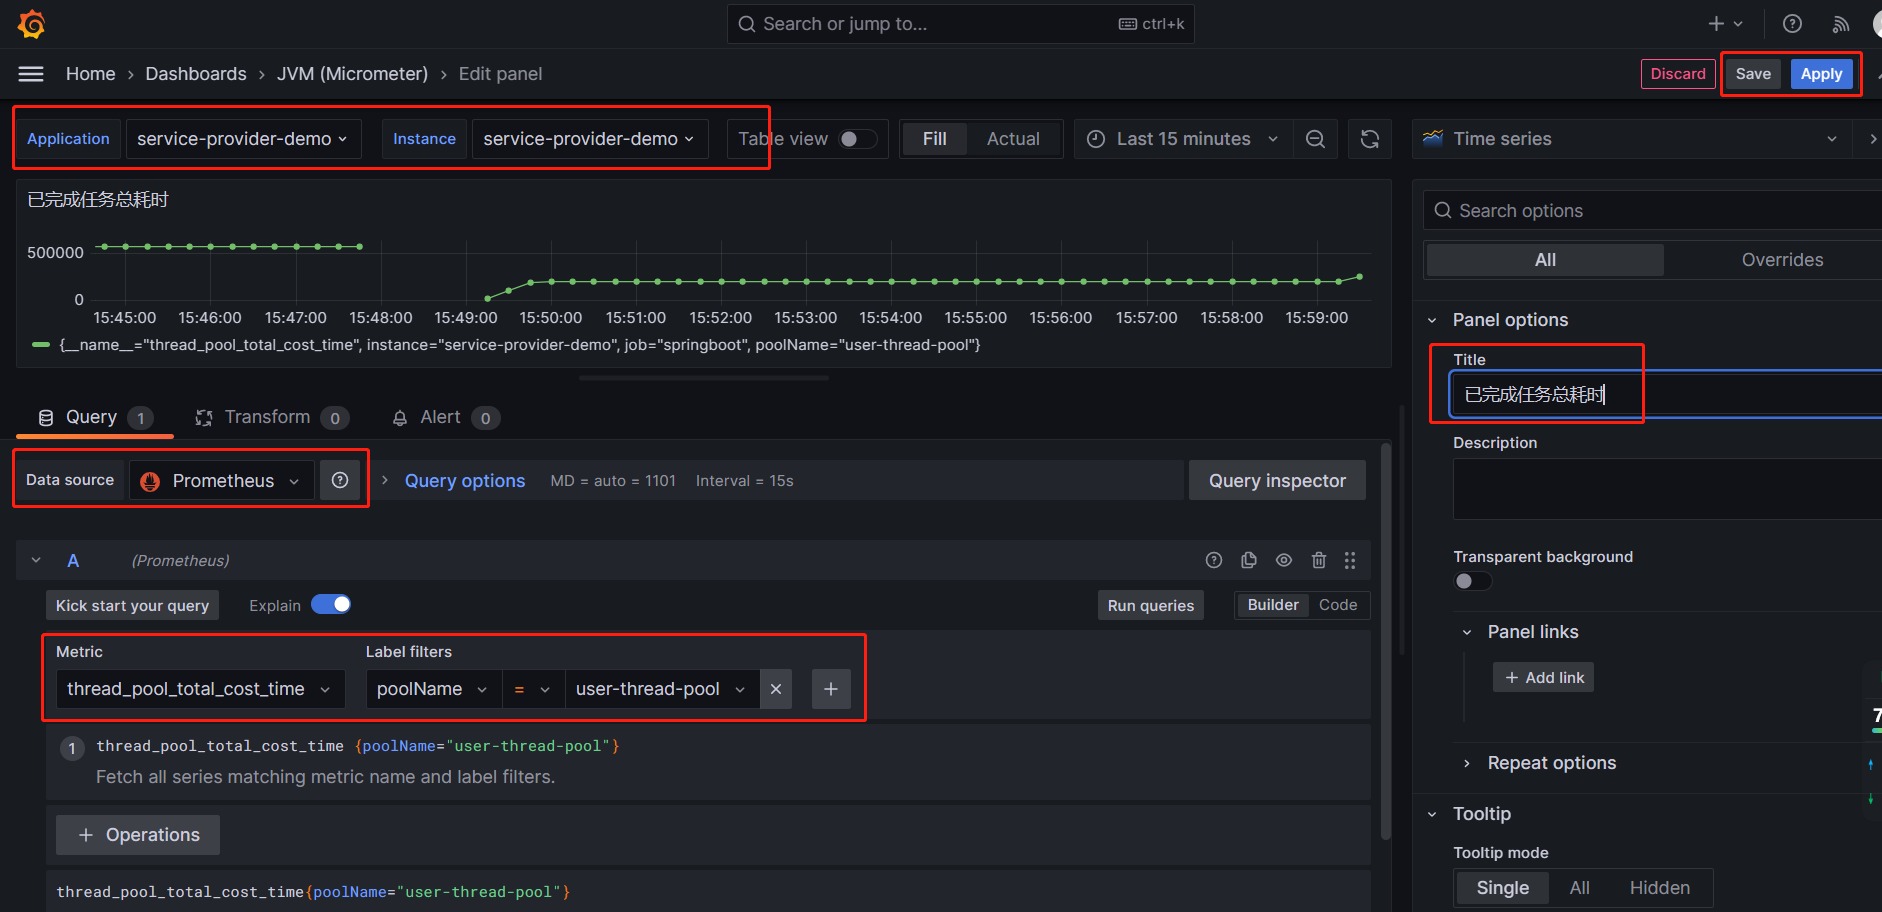
Configure according to the above figure, and finally click the Apply button.
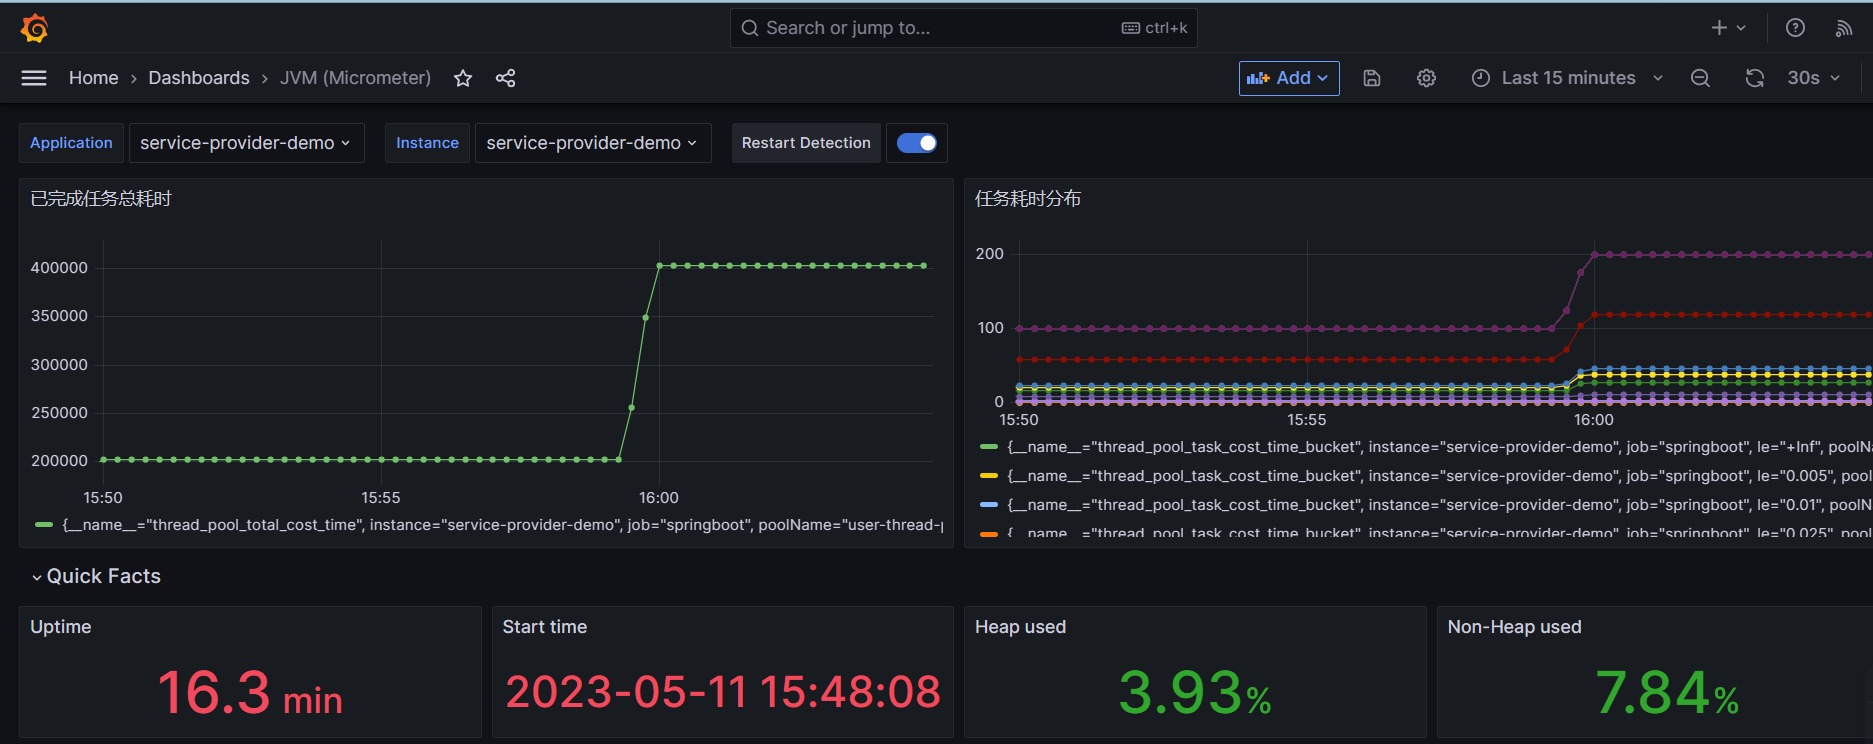
2) Configure the time-consuming distribution histogram of the task, click Add -> Visualization,

3) The final effect is as follows:
Summary of dynamic parameter adjustment of Nacos registration center
Through the above steps, we realized the indicator exposure of the custom thread pool, the dynamic parameter adjustment of the Nacos registration center, the indicator collection and visual monitoring of Prometheus and Grafana. In this way, we can manage and monitor our thread pool status and performance more conveniently and efficiently.
In addition to the monitoring function, we can also use the alarm function of Prometheus or Grafana to set alarm rules and notification channels for our indicators. When the indicators meet certain conditions, such as the average thread time-consuming is too long, a large number of threads execute abnormally, and a large number of tasks are blocked. When rejected, receive alarm notifications in time, such as DingTalk, email, etc. Grafana's alarm function also allows us to intuitively define alarm thresholds and display alarm status on the dashboard.
Due to limited space, this article will not demonstrate the specific operation of the alarm function. Interested partners can refer to the code and related configurations in this article to try to add the alarm function and optimize related functions.
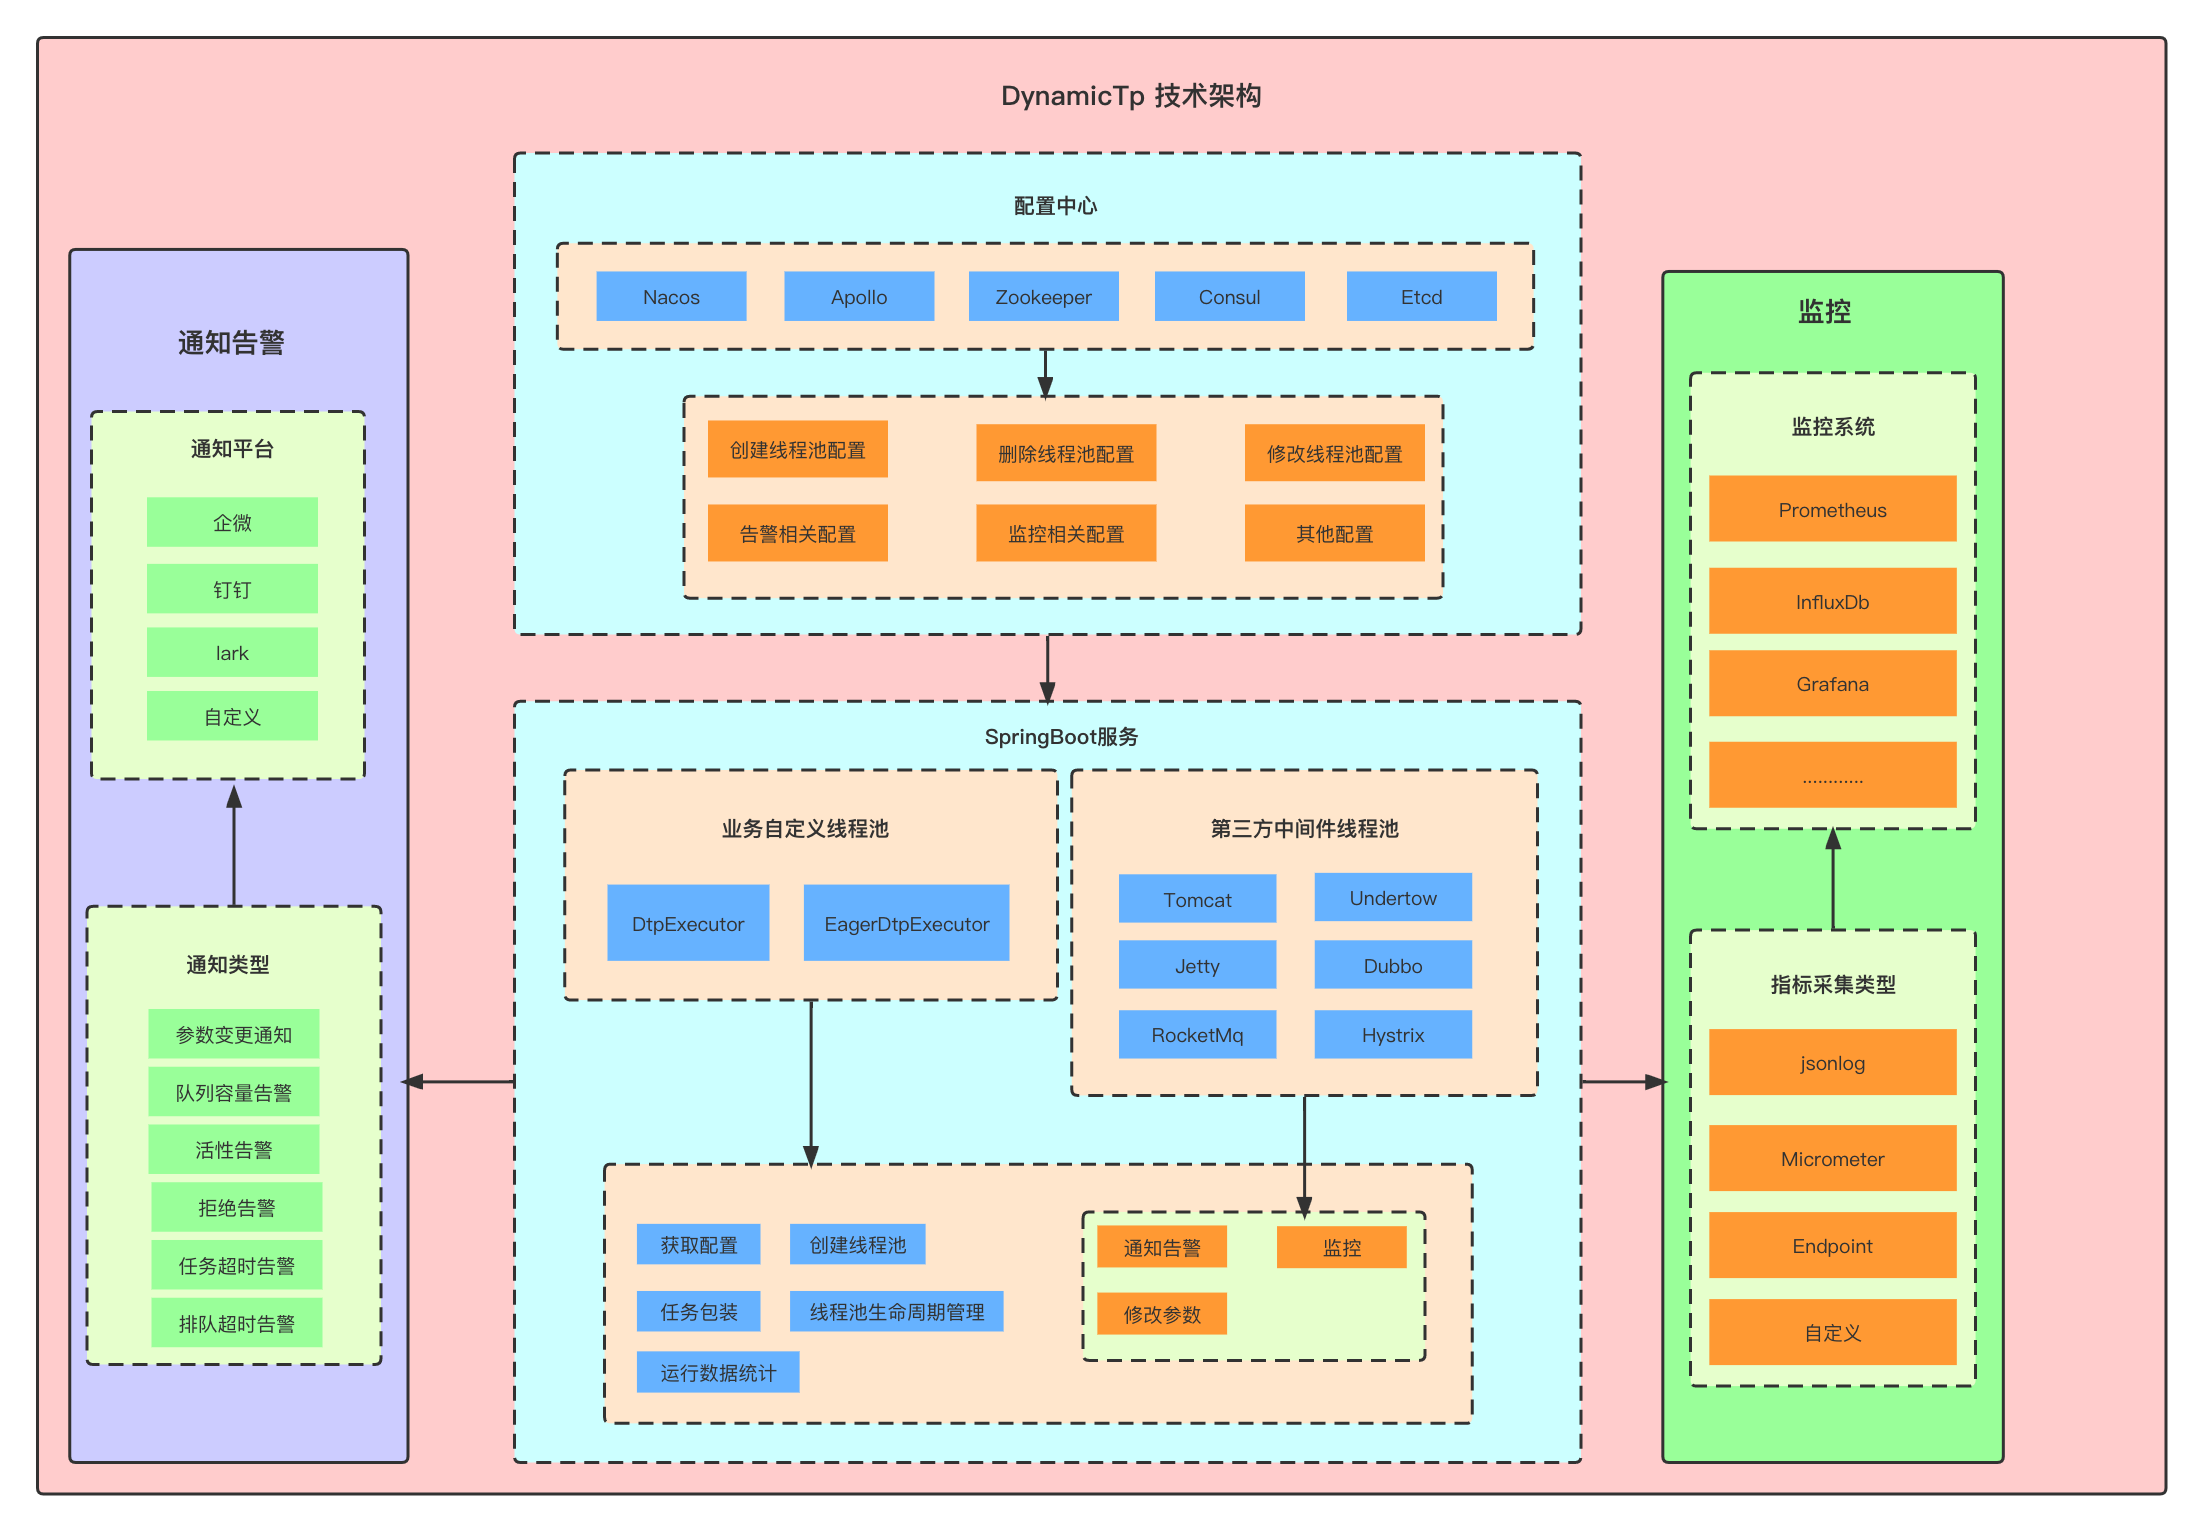
Recommended open source solutions for dynamic thread pools
This article only shows you SpringCloudthe basic idea and method of implementing thread pool management, monitoring, and alarm functions under the framework. If you want to apply it to the actual production environment, you need to expand its functions and optimization.
If you find this process too complex or cumbersome, there is an open source component that already does the job for you, and it is dynamic-tp.
dynamic-tpIt is a lightweight and dynamically monitorable thread pool component based on the configuration center, which can help you:
- Dynamically adjust thread pool parameters without restarting the application
- View thread pool status and performance metrics in real time
- Visually display thread pool indicator data and trend graphs
- Flexible setting of thread pool alarm rules and notification channels
- One-click recovery of thread pool exceptions or risks
Home | dynamic-tp (dynamictp.cn)
SpringCloud project uses dynamic-tp dynamic thread pool
The idea of dynamic-tp dynamic thread pool
1. AlarmCheckEvent event release
According to the imported dynamic-tp-spring-cloud-starter-nacos or dynamic-tp-spring-boot-starter-nacos dependency
Take nacos as an example:
<dependency>
    <groupId>cn.dynamictp</groupId>
    <artifactId>dynamic-tp-spring-boot-starter-nacos</artifactId>
    <version>1.0.9</version>
</dependency>
You can see the automatically assembled files: DtpAutoConfiguration and NacosRefresher. In DtpAutoConfiguration, we can see the imported configuration information:
@ImportAutoConfiguration({

    BaseBeanAutoConfiguration.class})
Based on this annotation, focus on the BaseBeanAutoConfiguration class:
This class mainly does the following things
DtpProperties   线程池相关配置
上下文holder    dtpApplicationContextHolder
dtpBanner打印 dtpBannerPrinter
dtp后置处理器    dtpPostProcessor
dtp注册   dtpRegistry
dtp监控    dtpMonitor
dtpEndpoint  dtpEndpoint
in
1) dtpBanner is the banner printing operation when the console starts the project.
2) dtpPostProcessor dtp post processor processes all related beans
If the bean is an executor, register dtp, which will be registered in DTP_REGISTRY, data structure: Map
Otherwise, the class based on the DynamicTp annotation will be obtained based on the ApplicationHolder. If the current methodMetadata based on DynamicTp is empty, the bean will be returned, otherwise, dtpAnnotationVal will be obtained. poolName is also dtpAnnotationVal.
Register the task executor if the current bean belongs to the thread pool task executor. Wrap the executor and put the notification information notifyItems. registerCommon performs registration.
3) dtpRegistry register dtp DTP_REGISTRY data structure: Map
The most important of these methods is the refresh method:
Get the dtp executor and convert the executor to DtpMainProp. Perform a refresh.
4) dtp monitoring dtpMonitor will perform monitoring and publishing: there are 2 methods that need attention:
Check monitoring checkAlarm
collect Collect monitoring indicator information
Among them: when checking and monitoring, it will send the alarm based on the current information: send the message based on the corresponding channel.
At this time, two events will be published: publishAlarmCheckEvent, publishCollectEvent
The method Refresh in NacosRefresher: Refresh When the configuration changes are detected, doNoticeAsync executes an asynchronous notification to notify the business side that a configuration change has occurred at this time.
After the refresh is completed, execute the RefreshEvent to publish the refresh event.
2. AlarmCheckEvent event monitoring
After the release is complete, you can see that the corresponding monitoring is in
com.dtp.starter.adapter.common.autoconfigure.AdapterCommonAutoConfiguration
adapter public autowiring
@Override
public void onApplicationEvent(@NonNull ApplicationEvent event) {


    try {


        if (event instanceof RefreshEvent) {


            doRefresh(((RefreshEvent) event).getDtpProperties());
        } else if (event instanceof CollectEvent) {


            doCollect(((CollectEvent) event).getDtpProperties());
        } else if (event instanceof AlarmCheckEvent) {


            doAlarmCheck(((AlarmCheckEvent) event).getDtpProperties());
        }
    } catch (Exception e) {


        log.error("DynamicTp adapter, event handle failed.", e);
    }
}
You can see that the three release events we care about are all monitored here:
doRefresh、doCollect、doAlarmCheck
in
The refresh event will perform the notification of the relevant channel
Collecting logs will perform corresponding printing
The warning message will execute the warning
Use of dynamic-tp in Spring Cloud
Usage: Taking nacos as an example, you can see that it realizes the registration of dtp-related beans based on @EnableDynamicTp.
DtpBeanDefinitionRegistrar is the class that completes the registration. It mainly creates the dtp configuration object DtpProperties, binds the dtp configuration, and obtains the actuator. After getting the executor, traverse the execution, bind the corresponding information, build the constructor, and register the bean information. It is convenient for subsequent operations on the thread pool.
@Resource
private ThreadPoolExecutor dtpExecutor1;

@GetMapping("/dtp-nacos-example/test")
public String test() throws InterruptedException {


    task();
    return "success";
}

//获取dtp执行器
public void task() throws InterruptedException {


    //获取dtp执行器
    DtpExecutor dtpExecutor2 = DtpRegistry.getDtpExecutor("dtpExecutor2");
    for (int i = 0; i < 100; i++) {


        Thread.sleep(100);
        dtpExecutor1.execute(() -> {


            log.info("i am dynamic-tp-test-1 task");
        });
        dtpExecutor2.execute(NamedRunnable.of(() -> {


            try {


                Thread.sleep(1000);
            } catch (InterruptedException e) {


                e.printStackTrace();
            }
            log.info("i am dynamic-tp-test-2 task");
        }, "task-" + i));
    }
}
It can be seen from this that two of the most important functions have been implemented: dynamic changes to the thread pool and monitoring and alarming of the thread pool.
references
https://tech.meituan.com/2020/04/02/java-pooling-pratice-in-meituan.html
https://www.cnblogs.com/mic112/p/15424574.html
https://dynamictp.cn/guide/introduction/background.html
https://cloud.tencent.com/developer/article/2228775
The realization path of technical freedom PDF:
Realize your architectural freedom:
" Have a thorough understanding of the 8-figure-1 template, everyone can do the architecture "
" 10Wqps review platform, how to structure it? This is what station B does! ! ! "
" Peak 21WQps, 100 million DAU, how is the small game "Sheep a Sheep" structured? "
" How to Scheduling 10 Billion-Level Orders, Come to a Big Factory's Superb Solution "
" Two Big Factory 10 Billion-Level Red Envelope Architecture Scheme "
… more architecture articles, being added
Realize your responsive freedom:
" Responsive Bible: 10W Words, Realize Spring Responsive Programming Freedom "
This is the old version of " Flux, Mono, Reactor Combat (the most complete in history) "
Realize your spring cloud freedom:
" Spring cloud Alibaba Study Bible "
" Sharding-JDBC underlying principle and core practice (the most complete in history) "
Realize your linux freedom:
" Linux Commands Encyclopedia: 2W More Words, One Time to Realize Linux Freedom "
Realize your online freedom:
" Detailed explanation of TCP protocol (the most complete in history) "
" Three Network Tables: ARP Table, MAC Table, Routing Table, Realize Your Network Freedom!" ! "
Realize your distributed lock freedom:
" Redis Distributed Lock (Illustration - Second Understanding - The Most Complete in History) "
" Zookeeper Distributed Lock - Diagram - Second Understanding "
Realize your king component freedom:
" King of the Queue: Disruptor Principles, Architecture, and Source Code Penetration "
" The King of Cache: The Use of Caffeine (The Most Complete in History) "
" Java Agent probe, bytecode enhanced ByteBuddy (the most complete in history) "
Realize your interview questions freely:
4000 pages of "Nin's Java Interview Collection" 40 topics
Please go to the following "Technical Freedom Circle" official account to get the PDF file update of the above Nien architecture notes and interview questions↓↓↓