Article directory
0 Preface
Due to the need for drawing processing in many scenarios such as scientific research, the author has studied SPSS. This article summarizes the study notes through "SPSS Statistical Analysis from Introduction to Mastery" and its supporting materials combined with relevant online materials. This article explains the relevant analysis.
1. Bivariate correlation analysis
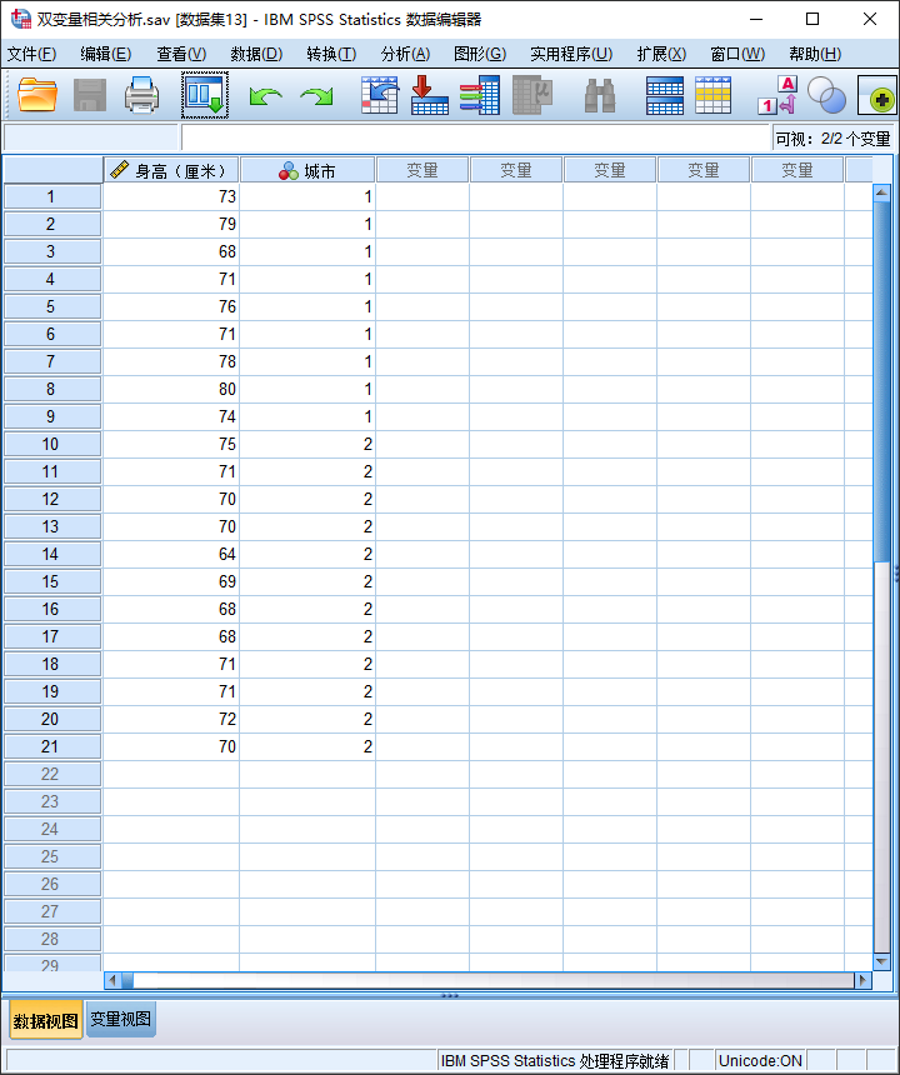
(1) Prepare data
(2) Operation steps
① Select "Analyze|Correlation|Bivariate" in the menu bar;
②Select "Height" and "City" into the "Variables" list box, since the variable "City" obviously does not conform to the normal distribution, In this experiment, select "Spearman" in the "Correlation Coefficient" option group;
③Click "Options", select "Mean and Standard Deviation", "Cross Product Deviation and Covariance", and select "Pairwise Excluded Cases", Click "Continue";
④ Click "OK" to perform bivariate analysis.
(3) Operation results
① View descriptive statistics

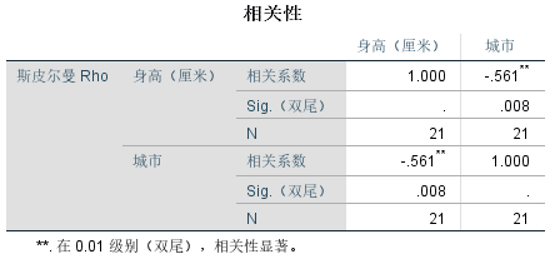
② Check the correlation
2. Partial correlation analysis
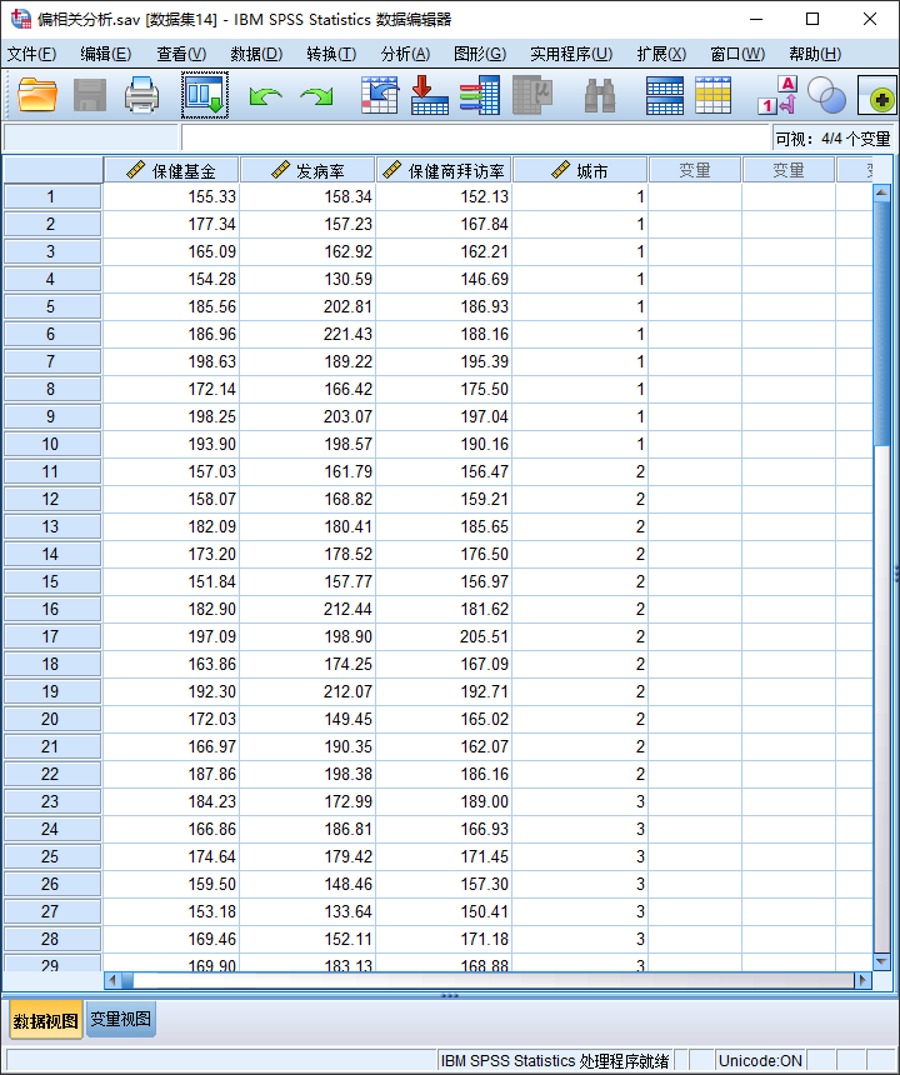
(1) Prepare data
(2) Operation steps
① Select "Analyze|Correlation|Partial Correlation" in the menu bar;
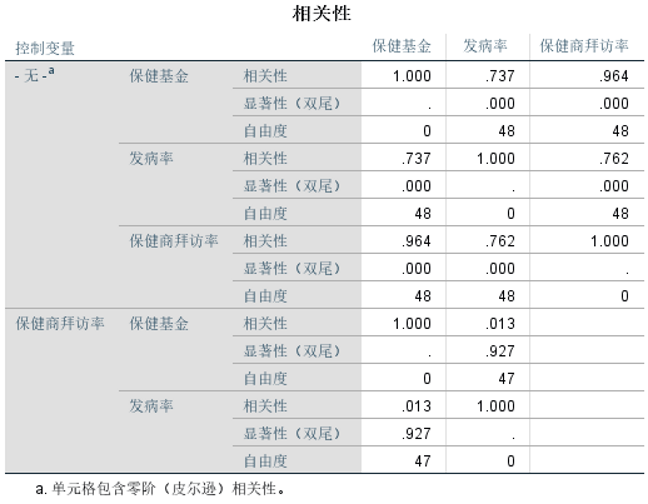
② Select "Insurance Fund" and "Incidence Rate" into the "Variables" list box, and select "Health Care Provider Visit Rate" into " Control" list box;
③Click "Options", select "Mean and Standard Deviation" and "Zero Correlation" in the "Statistics" option group, and select "Pairwise exclusion" in the "Missing Values" option group Case", click "Continue";
④Click "OK" to perform partial correlation analysis.
(3) Operation results
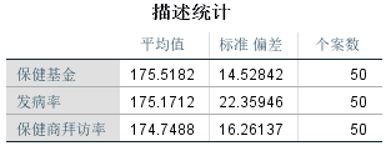
① View descriptive statistics
② Check the correlation
3. Distance analysis
(1) Prepare data

(2) Operation steps
① Select "Analysis|Correlation|Distance" in the menu bar;
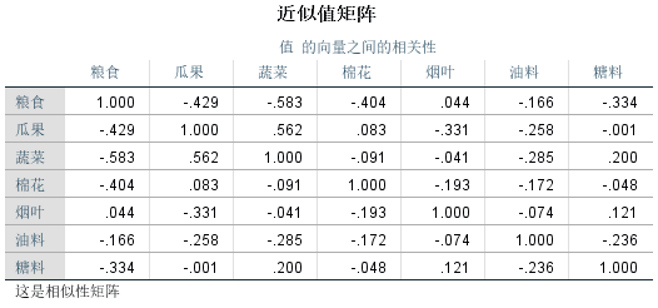
②Select all variables, put all variables except "region" into the "variables" list, and select "between variables" and "variables" respectively Similarity";
③ Click "Measurement", select "Pearson Correlation" in the "Measurement" drop-down list box of "Interval", select "Z score" in the "Standardization" drop-down list box in the "Conversion Value" option group ”;
④Click “OK” to perform distance analysis.
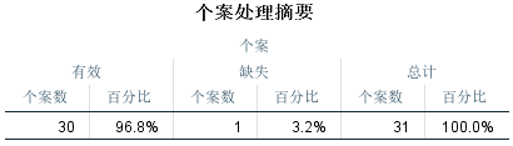
(3) Operation results
① Check the case processing summary
② View the approximation matrix
Reference materials:
[1] Research monk Zhang. Introduction to spss: How to realize the correlation analysis between two variables ; 2017-04-15 [accessed 2023-05-04].
[2] My eyes are only learning. Based on spss Partial correlation analysis (partial correlation analysis) ; 2020-08-15 [accessed 2023-05-04].
[3] sayasora. SPSS realizes distance analysis ; 2020-10-05 [accessed 2023-05-04].