A quick overview of the essence in one minute
When tens of thousands of servers are under low utilization, it means huge waste. Good capacity management can help eliminate some "last-minute" temporary emergency blind or over-purchasing. In addition to reasonable cost control, capacity management also needs to estimate business development and risk changes that may affect customers.
Under the background of reducing costs and increasing efficiency, station B has implemented visual management of the overall capacity from a business perspective. This article describes in detail the background, ideas and results of its capacity management.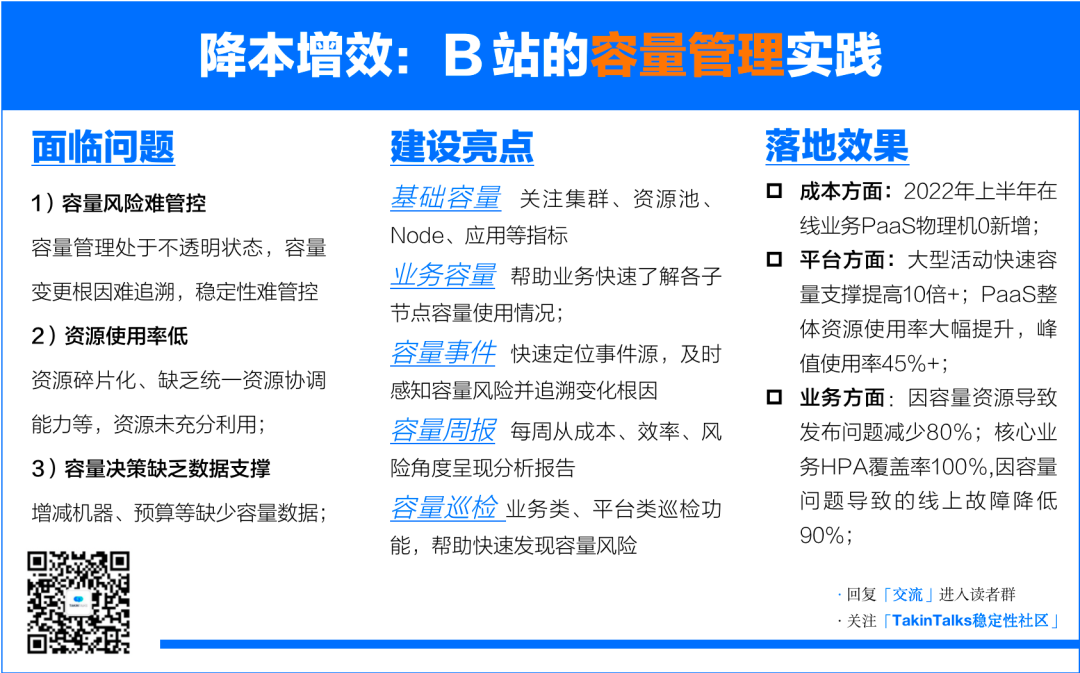
Author  introduction Zhang He, senior SRE expert of Bilibili
A member of the TakinTalks community expert group, joined station B in 2020, and has been responsible for the main station/live broadcast/OGV/promotion search related SRE work. In-depth participation in multi-active, activity assurance, chaos engineering, and capacity management related constructions, and led the architecture design and implementation of capacity management platforms and chaos platforms. He used to be responsible for the infrastructure guarantee of Bilibili S competition, New Year's Eve party, New Year's greetings and other related activities. Currently, he is mainly responsible for promoting the stability of the search business and PaaS governance.
Warm reminder: This article is about 4,500 words, and it is expected to take 9 minutes to read.
Reply "communication" in the background to enter the reader exchange group; reply "2252" to obtain courseware information;
background
For station B, our three biggest activities are S competition, New Year greetings, and New Year's Eve party at station B. Behind the user growth, the SRE team has done a lot of things to ensure business continuity, such as multi-active, chaos engineering and so on.
Let’s talk about it from a different angle today—“capacity management”. Why does station B need a capacity management platform? How is our capacity management system designed? How do we operate on the platform side and business side and make the work "visual"? I will also share some experience of "empowering business" based on the actual application of the capacity management platform in the S12 competition.
1. Why does Station B need capacity management?
Before doing capacity management, Station B faced several obvious pain points, as shown in the figure below.
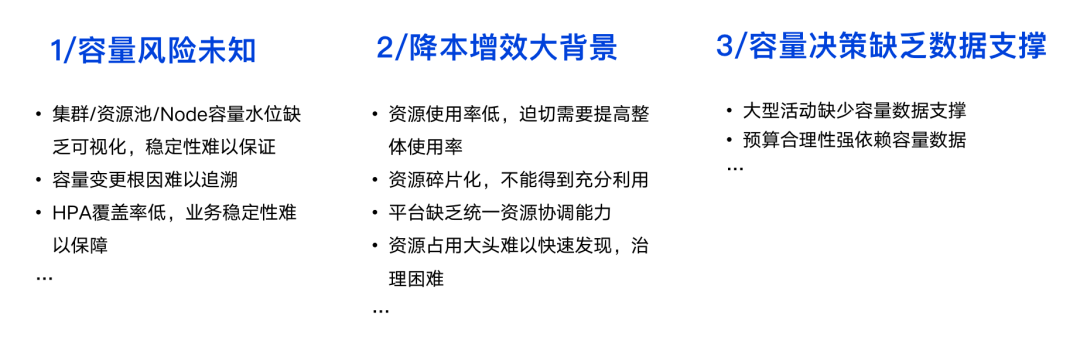 In addition to solving unknown capacity risks, it is also very important to improve resource utilization and formulate reasonable and data-supported budget decisions under the background of advocating "cost reduction and efficiency increase".
Previously, the capacity decisions made by Station B in large-scale activities, such as S9, S10, etc., did not accumulate relevant data for S12 to refer to, such as whether the capacity of the system itself is sufficient, whether it needs to be expanded, how much it should be expanded, etc., there is little capacity data support. In addition, the annual budget formulation also urgently needs reference capacity data.
2. How is the capacity system of Station B designed?
2.1 Demands of different roles
Based on the above pain points, we plan to design the entire capacity system, in which different roles pay attention to different traffic indicators. for example:
R&D department: Focus on whether there are enough resources to expand and release. A relatively high-level R&D Leader may pay more attention to the resource utilization rate of the entire department and whether the cost of the department is reasonable, etc.;
Platform: pay more attention to the sales rate of the platform, resource buffer, resource utilization rate, and other work to reduce costs and increase efficiency;
SRE: The core focus is on stability, and it is also necessary to improve the utilization rate of overall resources to achieve the big goal of reducing costs and increasing efficiency;
Cost department: Pay more attention to bills, costs, budgets, resource usage, etc., that is, to save overall costs.
2.2 Overall Design of Capacity System
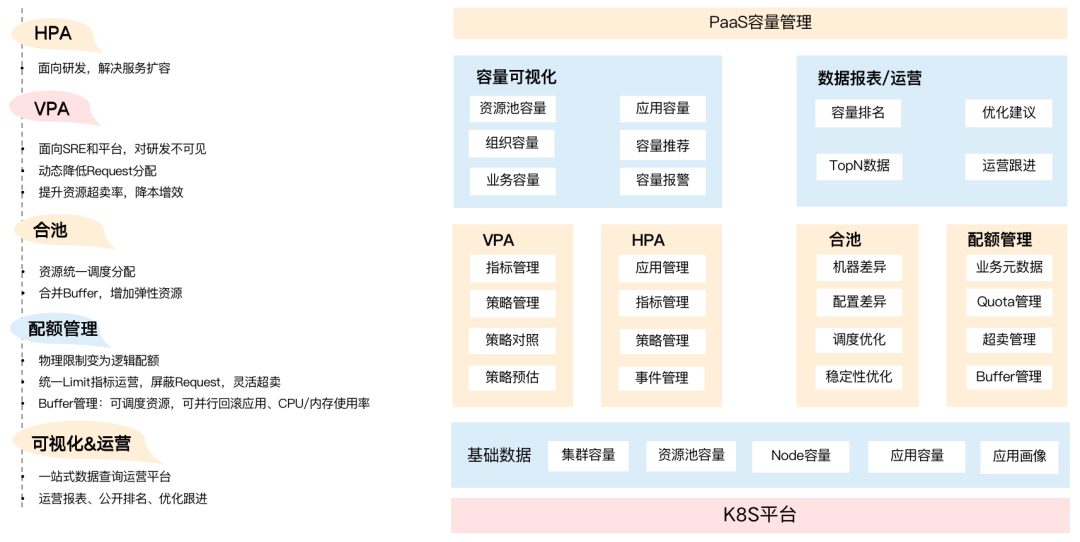 From bottom to top, the bottom layer is mainly basic data (basic capacity), such as machines, resource pools, etc., which are biased towards the bottom layer of the cloud. SREs and platforms need to be more aware of the capacity of the cluster and the capacity of the resource pool. No matter how the resource pool is oversold or regulated, the premise is that the overall underlying resource usage must be at a safe level.
Based on the basic capacity, we have built a set of VPA-based scaling strategies and HPA-based elastic scaling of instances. We have also merged with the resource pool of the business. After the pool is merged, we may face a problem, that is, how to control the resources used by each business party in a large pool? At this point, it is necessary to perform quota management based on the business, that is, to control how many resources each business can use.
At a higher level, we also provide a set of capacity visualization and operational data to support the business and improve the efficiency of the business team, including organizational capacity and capacity events based on business departments, such as the capacity operation weekly report, which will be different The usage rate of the department is publicly ranked, and optimization suggestions are provided based on the data. I will introduce this part in detail later.
3. How can capacity operation and visualization help businesses solve problems?
3.1 Basic capacity
The basic capacity is the basis of the entire capacity system. As mentioned above, we pay more attention to the capacity reports of clusters, resource pools, nodes, and some application dimensions, as shown in the figure below.
Cluster: pay attention to the cluster capacity water level and oversold rate;
Resource pool: pay attention to the resource pool capacity water level, overselling rate, and resource redundancy. Resource usage determines whether we need to purchase machines in time and judge whether they can carry more business;
Node: pay attention to Node resource water level and Node oversold rate, because oversold will bring pressure from hotspots, so reports related to Node usage are made;
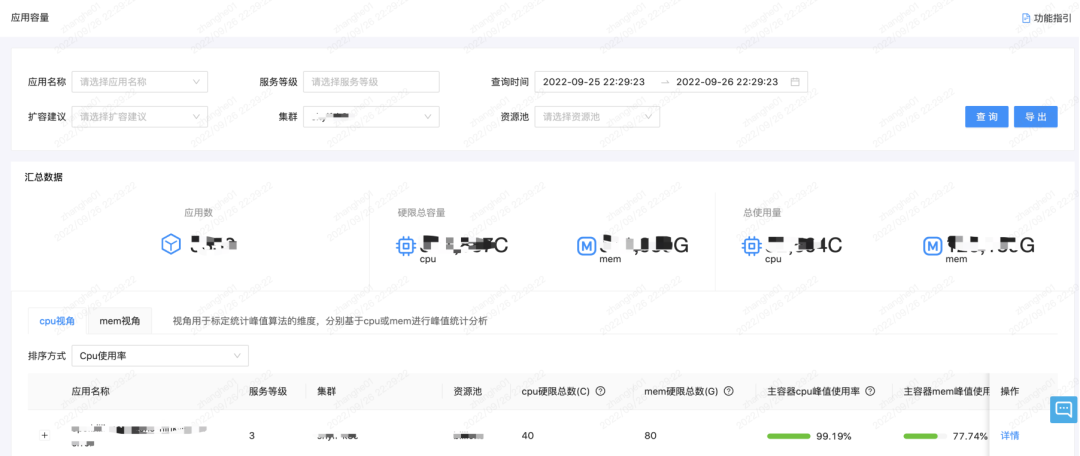
Application: Focus on usage, usage rate, number of instances, number of single-instance containers, etc. The business pays more attention to the data at the application level. For example, whether the service is a single point, because a single point means that if a physical machine hangs up and the service happens to be on this physical machine, the service will be temporarily unavailable at this time. For the core business Said it was not acceptable.
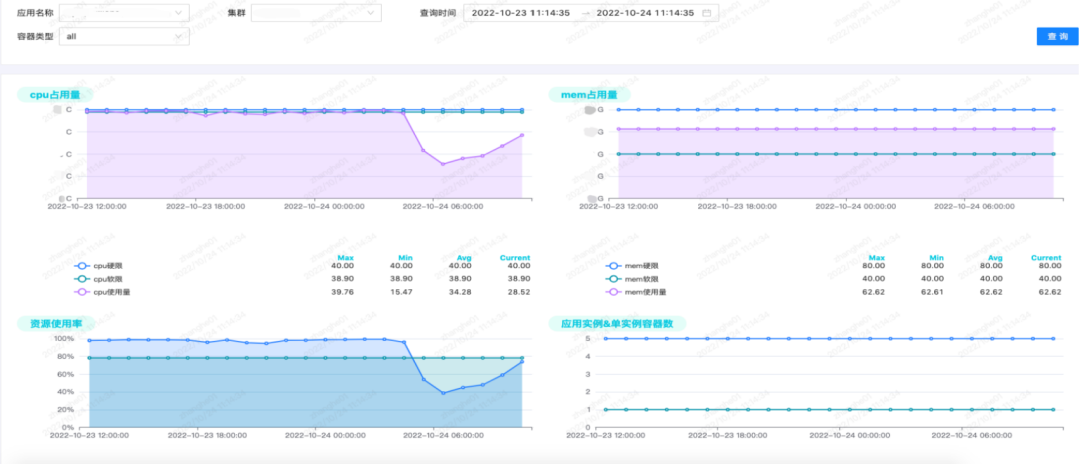
Based on these indicators, we have made some visual interfaces. Unlike the external monitoring system Grafana, which stores data for 2 weeks by default, the data of our entire capacity platform is stored persistently. Currently, it has stored data for nearly two years.
3.2 Business organization capacity
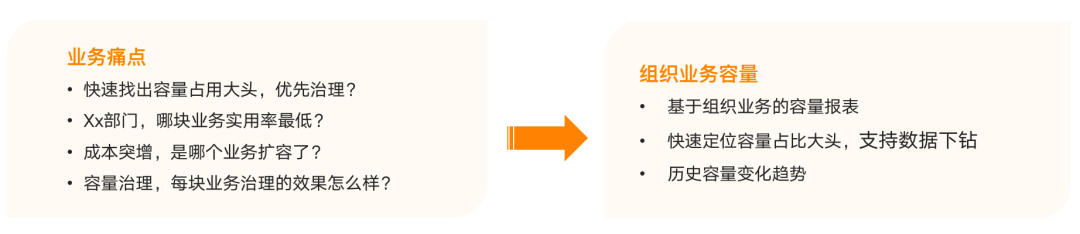
In the context of reducing costs and increasing efficiency, how to help businesses solve problems? The business side generally pays more attention to how to find out which services occupy more capacity, which business has a relatively low resource usage rate and can be scaled down, which business caused the sudden increase in cost or usage, and after business governance or architecture integration How effective the governance is, etc., requires a more intuitive interface that can help them understand the overall situation.
So based on the above points, we made a capacity report based on business organization, as shown in the figure below.
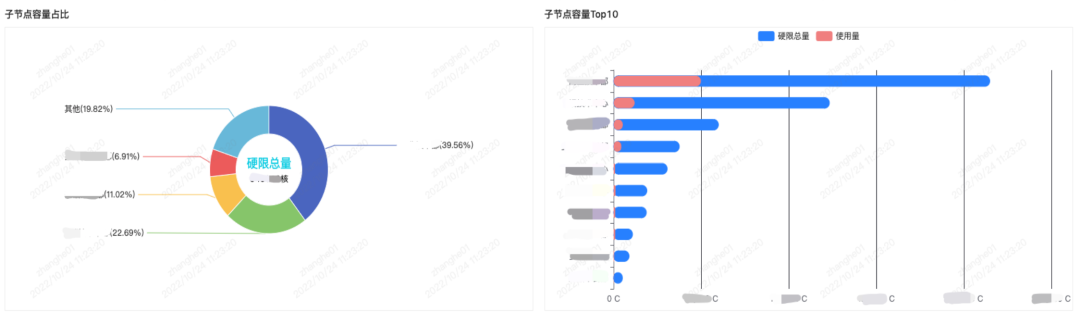
Take the live broadcast business of Station B as an example. As a large department, live broadcasting assumes that the overall capacity utilization rate is 40%. When services such as gift giving and lottery draws find that there are many resources and low usage rates, the business team can manage them in advance based on the information in the visual report to obtain more benefits.
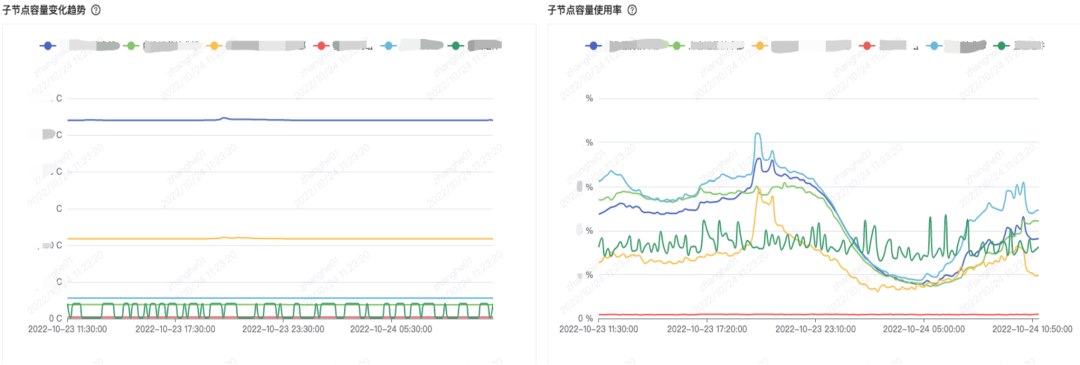
At the same time, based on the trend graph, you can see which businesses under the live broadcast business suddenly occupy a large capacity, such as new business scenarios, research and development, or sudden business expansion, etc., and support data drill-down, you can drill down to the revenue business to find out. Is it a sweepstakes or a change caused by the gift giving business.
3.3 Capacity Events
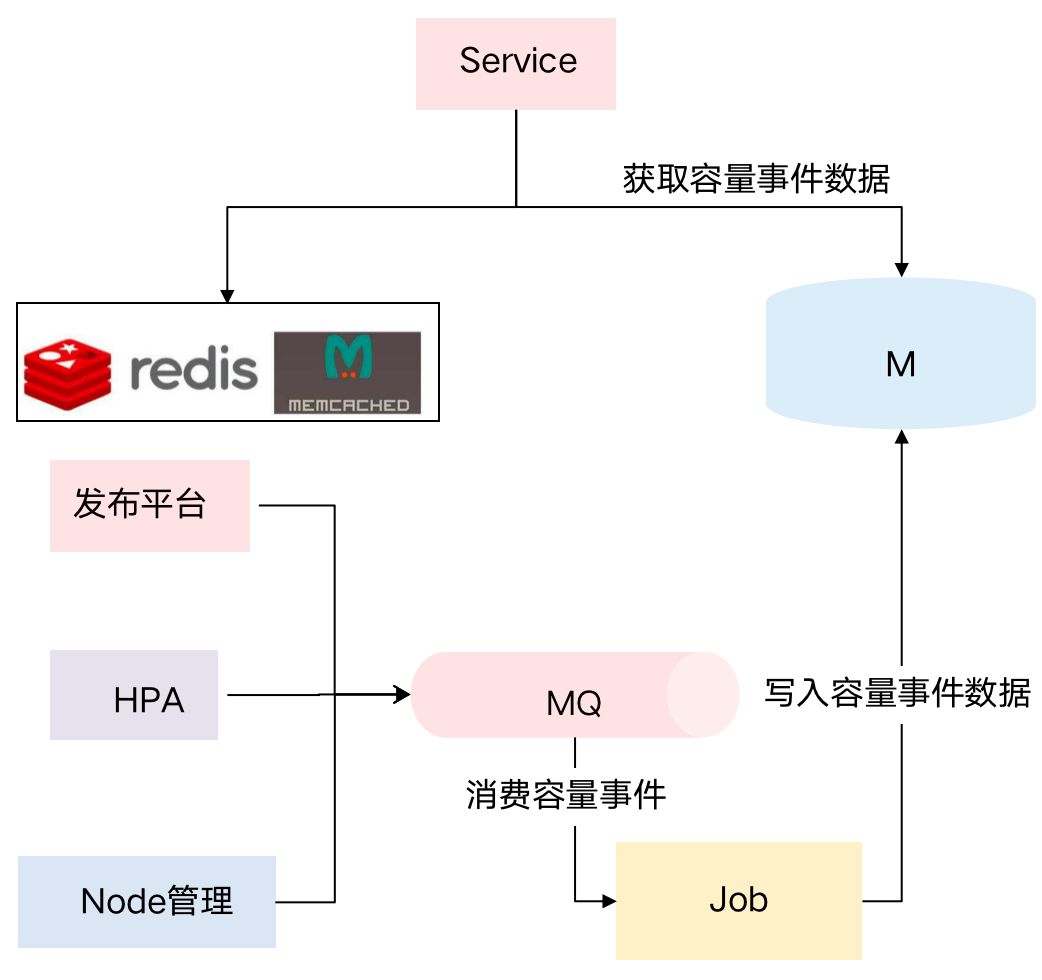
From the perspective of event sources, there are many events that can cause capacity changes, including release platform/HPA change platform/Node management. In the release platform, R&D can expand capacity or add new services, and modify capacity configuration. lead to a change in capacity. In addition, expansion and contraction of HPA, addition or deletion of Node physical machines, etc. will also lead to changes in capacity.
Therefore, we internally connected various capacity change platforms and built capacity event-related capabilities. When a business finds that the overall resource usage has changed a lot, it can quickly locate the source of the event through capacity events, perceive capacity risks in a timely manner, and trace capacity changes. root cause.
3.4 Capacity Weekly Report
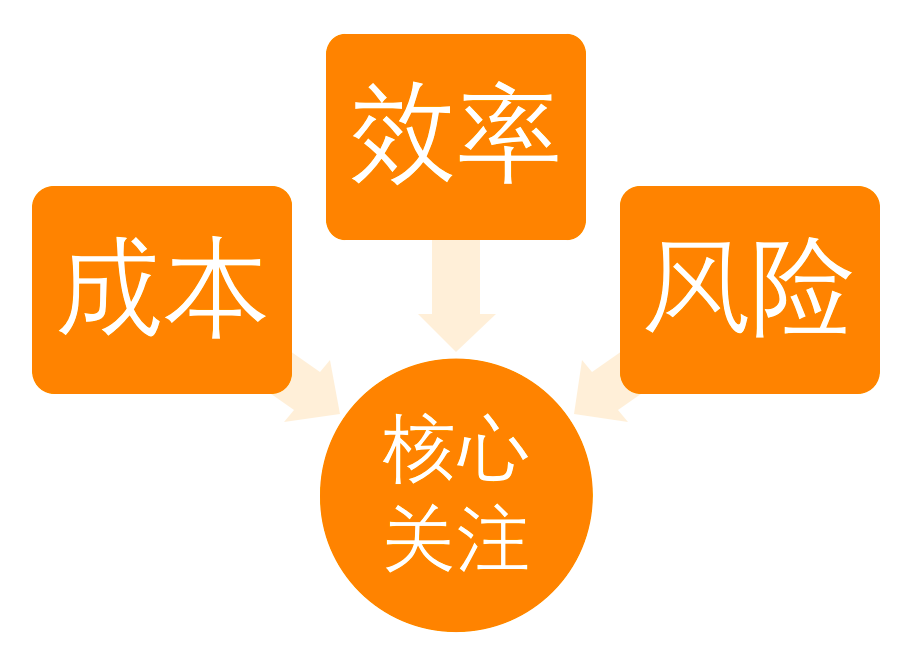
The capacity changes every week, so our platform analyzes the weekly report. Starting from the three cores of cost, efficiency, and risk, the focus of the weekly report of the business department and the platform side is quite different.
3.4.1 Department Capacity Weekly Report (Business Side)
The business-side weekly report focuses on the following four points——
** The overall resource capacity and resource usage rate have changed from last week. **That is, compared with last week, how much the resource usage has increased or decreased.
Application capacity Top . That is, which applications occupy more resources, so that the business can quickly perceive the bulk resources and improve the efficiency of cost reduction and optimization.
**Top risk applications (L0/L1 applications are displayed first). **Whether there are applications with high risks in this department, if there are core services with high utilization rate, the capacity can be expanded in advance.
**One week volume change application Top. **That is, which services have been added, which services have been expanded and contracted, and which services have been offline, etc., so that it is clear at a glance.
 (External weekly report display--the overall resource utilization rate of the department's main)
3.4.2 Internal weekly report (platform side)
The platform-side weekly report focuses on the following two points——
Department resource utilization and ranking, department capacity Top; department resource idle rate Top (more than 5000 core departments).
Through the public ranking, understand which businesses have weak capacity governance and prioritize governance. At the same time, due to its large resource usage, it should be given priority in governance, and the platform will also get greater governance benefits.  (Internal weekly report display--overall resource utilization)
3.5 Capacity Inspection
Whether it is in the promotion of activities or in the daily business stability guarantee, we need to pay close attention to whether the overall capacity is at risk, so we have a capacity inspection system.
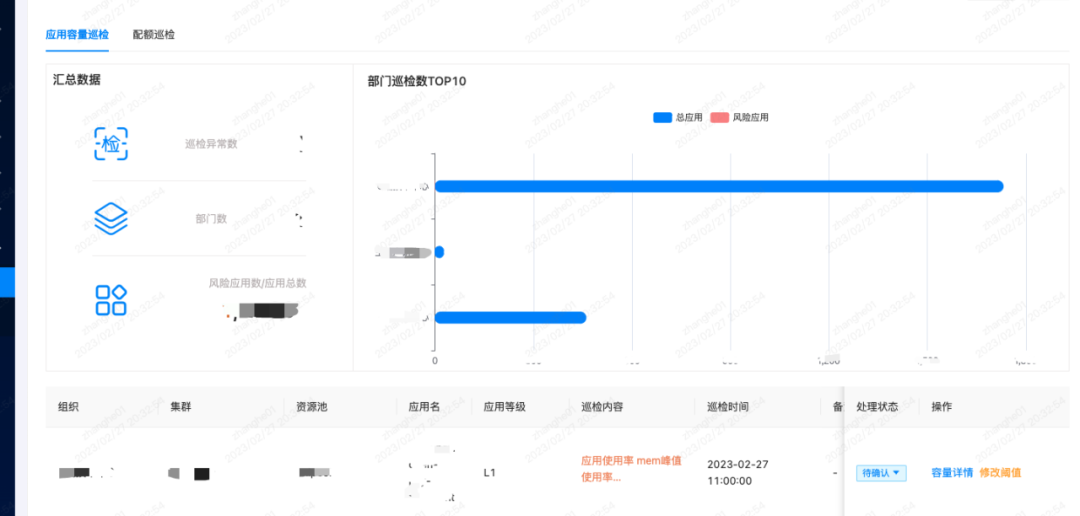
3.5.1 Business inspection
According to the two aspects that the business side pays attention to - application capacity inspection and quota inspection, we have made a visual display.
An application with a high peak usage rate will have stability risks, and emergency expansion needs to be considered; while an application with a low usage rate should consider whether it can be scaled down to save resources.
As mentioned earlier, we have merged pools, so we need to pay attention to the situation that the quota usage rate is too high after the pool is merged, so as to avoid subsequent expansion or unsatisfactory new business, and to discover risks in advance and manage them.
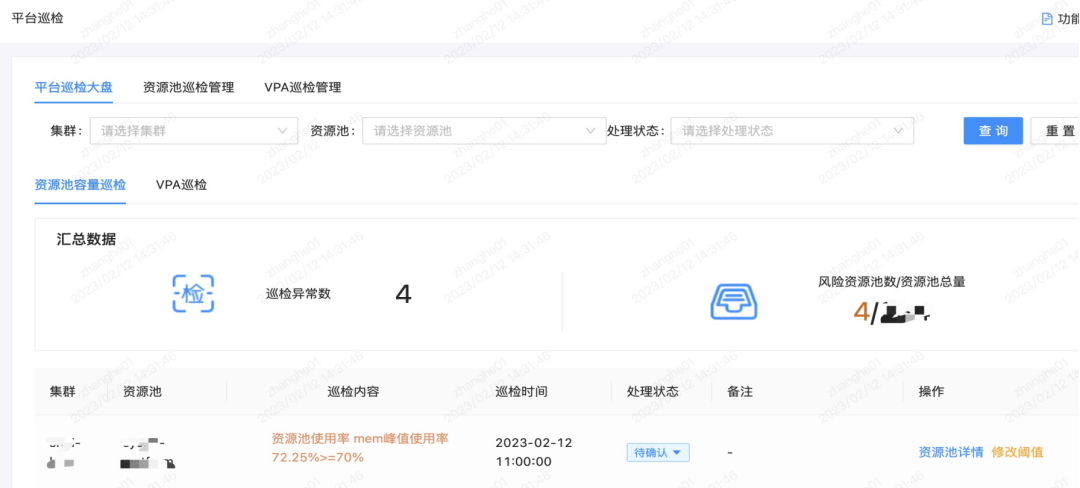
3.5.2 Platform inspection
The platform pays more attention to the underlying utilization rate, whether the number of schedulable instances meets subsequent business needs, and whether the resource pool is a single node, etc. At the same time, because the platform covers VPA, the failure rate after VPA adjustment is also more concerned by the platform.
Based on this, we have done platform inspections, resource pool inspection management, VPA inspection management, etc. In the inspection panel, the top risk resource pools/idle resource pools, top risk applications, and top risk quotas are displayed accordingly.
3.6 Business Value of Capacity Management
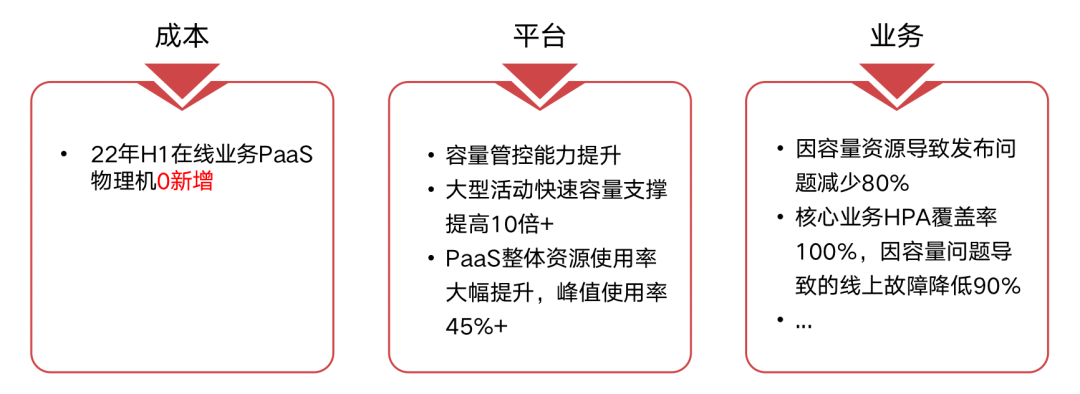
After the implementation of capacity management, we can intuitively see the help brought by the overall work to the business. For example, the release problems caused by capacity resources are reduced by 80%, and the online faults caused by capacity problems are reduced by 90%. From this point of view, the business department is not cooperating with the platform in capacity management, but everyone is working together for the ultimate business goal, which can ensure that after the capacity management is implemented, business demands can be responded to faster and stability can be achieved. Greater improvement.
4. How does capacity management support the S12 event?
Earlier we talked about the capabilities of the platform side and the needs of the business side. Next, I will take the past large-scale event S12 at Station B as an example to elaborate on the application of the capacity management platform in specific business scenarios.
4.1 S12 Activity Rhythm
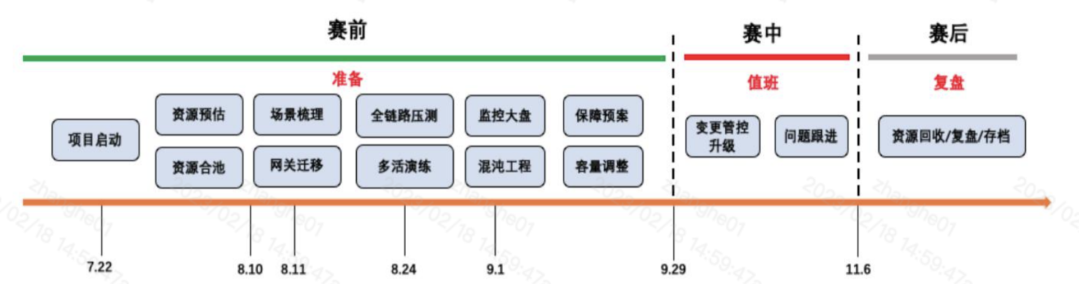
4.2 Pre-match capacity estimation of S12
The capacity estimation before the S12 game is mainly divided into three steps.
The first step is to refer to the historical basic capacity data to calculate the capacity delta
Regardless of the S event or the New Year's Eve party, the large-scale activities of Station B over the years have accumulated some historical data for reference, and the increment can be calculated based on historical data.
For example, S11 held a summary match in November, and the activity guarantee started in August. Compare the usage a in August with the peak usage b of S11, and calculate S11 based on delta = 1 + (ba) / a The incremental coefficient of the year, such as 1.3, 1.5, etc.
The second step, S12 new scene, estimated increment
Considering that S12 will have some new scenarios based on the original basis, at this time, after the business goals are clarified, they need to be transformed into technical goals, and then the technical goals are transformed into capacity requirements to obtain an estimated increment d.
The third step is to estimate the capacity of S12 and get the resource gap
In resource preparation, the extra buffer is usually 10% to 20%. The estimated total capacity can be calculated based on the current usage e and buffer of S12 in August. The formula is as follows:
Capacity estimate = (e * delta + d ) * (1 + buffer )
This part of the estimated capacity, minus the current total resource stock, can get the overall resource gap, and adjust the capacity based on this.
4.3 S12's PaaS Pool
4.3.1 Comparison before and after pooling
Before pooling, each physical resource pool is relatively independent. As shown in the figure below, the overall resource utilization rate of the comic business is the lowest, and the live broadcast may be close to saturation. At this time, since the live broadcast is a completely independent physical resource pool, comics and e-commerce The idle resources of the business cannot be utilized. In previous years, such as the S11 period, it was necessary to purchase resources or temporarily add resources from the cloud to support the entire activity.
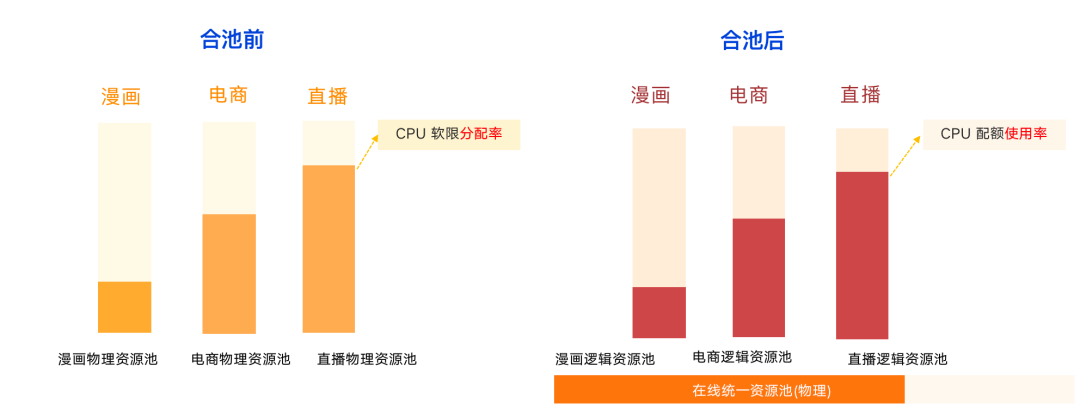
Before the S12 competition, after we pooled online microservices such as comics, e-commerce, and live broadcasting, the business no longer needs to care about the overall physical resource pool, that is, it only needs to care about the usage rate of its own business logic quota, not the underlying allocation or utilization rate. At the physical level, there is an online unified physical resource pool, and the underlying allocation rate and utilization rate are completely guaranteed by the SRE and the platform.
4.3.2 Potential risks of pool pooling
After pooling, there may be some unstable factors. For example, different resource pools or different businesses may have different kernel versions. Therefore, we have standardized the overall physical layer, unified the kernel, and de-CPUSET. Through the underlying VPA Policies dynamically adjust overall resource usage.
4.4 Quota Management of S12
Since each business after pooling shares a resource pool, the resource quota of each business needs to be subdivided and managed to avoid unlimited use of resources. Here we manage through the capacity management platform, and the logic of issuing capacity quotas is shown in the figure below.
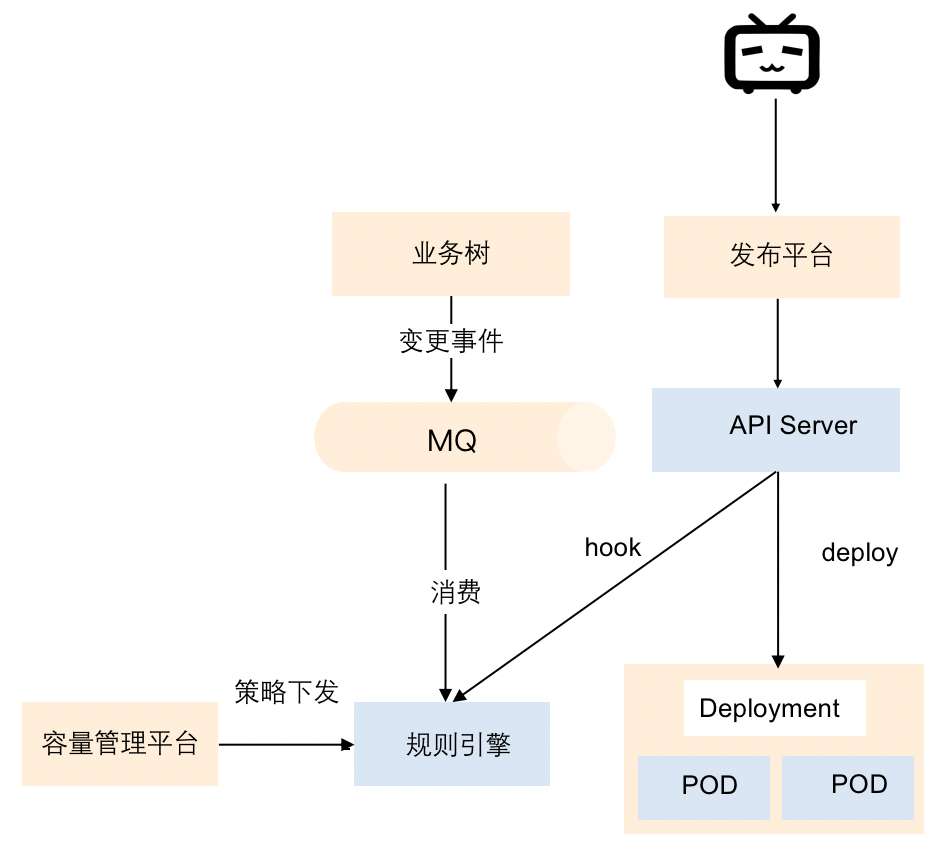
Quotas are issued based on the number of organizations. For example, how many quotas can be used by an organization. After the policy is issued, it will be applied to the rule engine. When the business changes, such as before the release, the corresponding business will be learned on the rule platform Check whether the quota is enough for release. If the resources are not enough, it will remind you that the quota is insufficient. In this case, you need to contact SRE to adjust the quota or perform quota management. In this way, we can achieve quota control and ensure that the entire resource pool will not be used indiscriminately.
4.5 Capacity support of S12
During the entire S12 event, capacity support can be roughly divided into four aspects - HPA, VPA, elastic cloud migration, and capacity inspection, as shown in the figure below.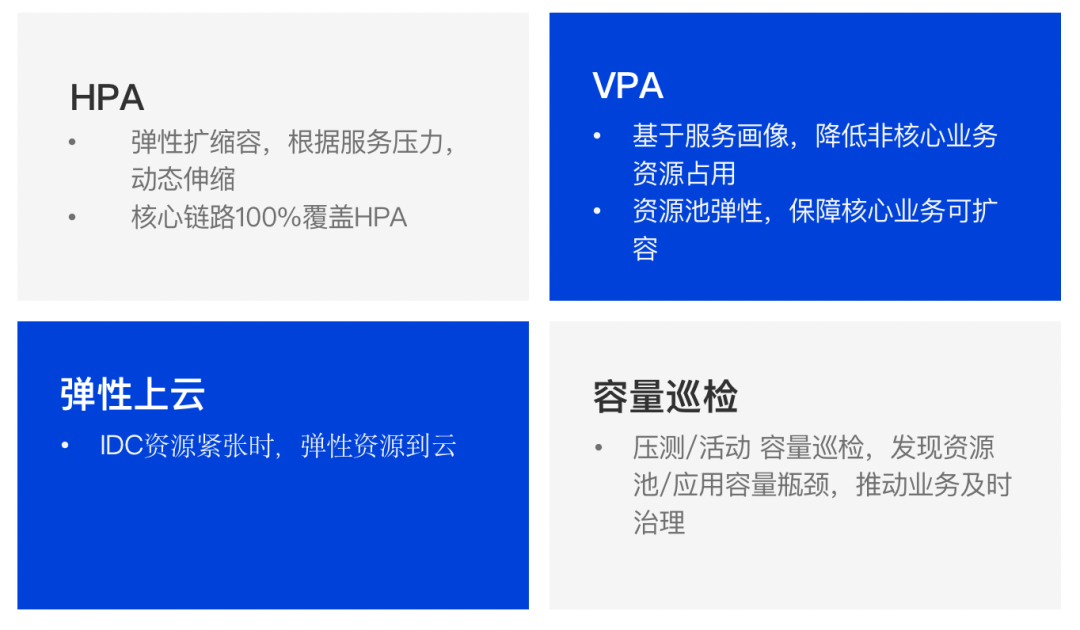
4.6 S12 capacity monitoring panel
For the S12 event guarantee, the core indicators of overall concern include business indicators, SLO, and resource saturation. The capacity monitoring panel can help locate potential risk points faster and make decisions quickly based on core indicators.
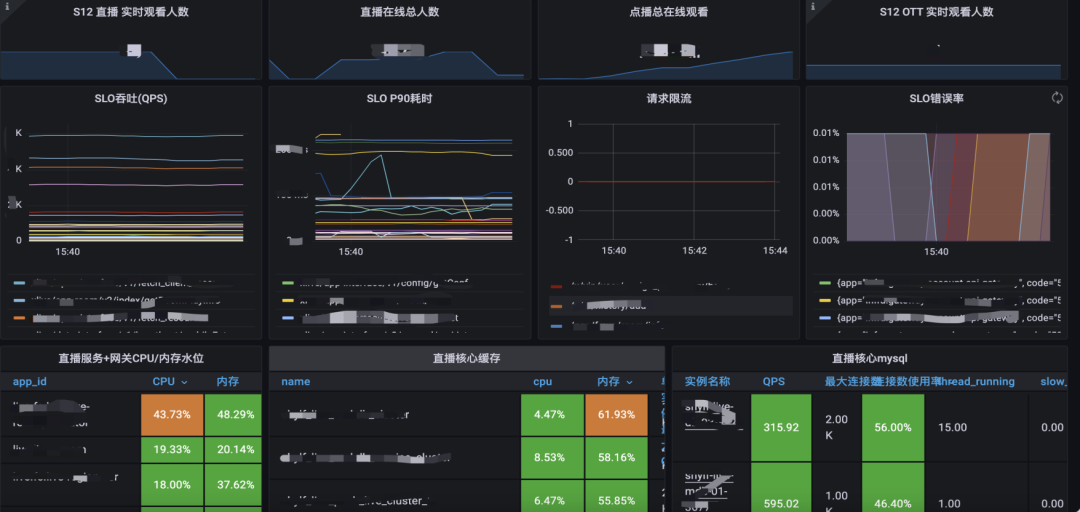
The first is business indicators. In S12, we pay more attention to the number of people online in the live broadcast room, such as more than 10 million, 20 million and so on. When the overall traffic during the event increases, the on-demand business will also be affected, so the number of online on-demand is also one of the business indicators we pay attention to.
Followed by SLO, the SRE team will pay more attention to the QPS of the core interface, as well as throughput, delay, error rate, etc.
The last is resource saturation, including core service saturation, core middleware saturation, etc.
5. Future planning
5.1 Capacity Risk Control
We found that there is no basis for the capacity change operation of some services, such as shrinking capacity taken for granted, without indicators to prompt or verify, which may lead to service failure. Therefore, we will do capacity risk control-related interception strategies, based on capacity portraits and application group packages, to achieve capacity change risk control.
5.2 Elastic scaling
The first block is time-sharing scheduling. There are some small activities in station B, such as the comic business, which basically has a peak traffic of about 1 hour at night, and normal traffic at other time points. After adding time-sharing scheduling, such as activities at 0-1 o'clock at night, we can expand capacity in advance before 23 o'clock, and complete capacity reduction after the event ends. The second block is elastic forecasting. On the one hand, it can predict the regular flow pressure and expand capacity in advance. On the other hand, if the monitoring system is down, the elastic forecast data can also be used as the bottom line of the monitoring data.
5.3 Breaking up hotspots
We are scheduling based on the soft limit, and the soft limit is also adjusted based on VPA, but it is still inevitable that some services will have hot spots on the physical machine, so we will do secondary scheduling based on the physical machine. (full text)

Add the assistant lady (shulie888), and get all the above information for free with the screenshot
And join the "TakinTalks Readers Exchange Group" for free
Disclaimer: This article was originally written by the public account "TakinTalks Stability Community" and community experts. If you need to reprint, please reply "Reprint" in the background to obtain authorization.
This article is published by OpenWrite, a multi-post platform for blogging !