
Committed to sharing quantitative strategies, training videos, Python, algorithm research and other related content.
What is overfitting
Overfitting was originally a concept in the field of statistical data mining, and now it also has an important position in the field of machine learning and quantitative strategies. Overfitting refers to tuning a complex model (model with many variables) to perfectly fit a sample of historical events, resulting in the model lacking the ability to predict future events. The smaller the number of historical samples, the more complex the model and the easier it is to overfit.
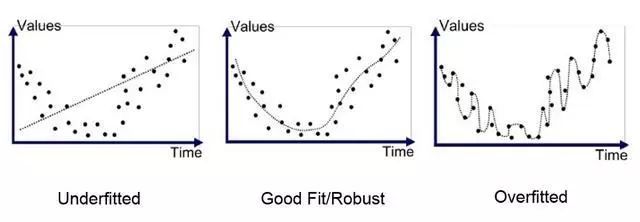
Plot of underfitting (high bias, low variance) versus overfitting (low bias, high variance)
Knowledge points:
Overfitting: Too much reliance on training data
Underfitting: Failure to learn the relationships in the training data
High variance: Model varies significantly based on training data
High bias: Insufficient assumptions about the model lead to ignoring overfitting and underfitting of the training data, resulting in poor generalization of the test set ;
A validation set model calibration can prevent overfitting; 1. The same data set should not be used for
parameter tuning and validation testing (as shown in the figure below);

The tuning set is the same data set as the validation set (overfitting)
2. The tuning and verification of parameters use different data sets respectively
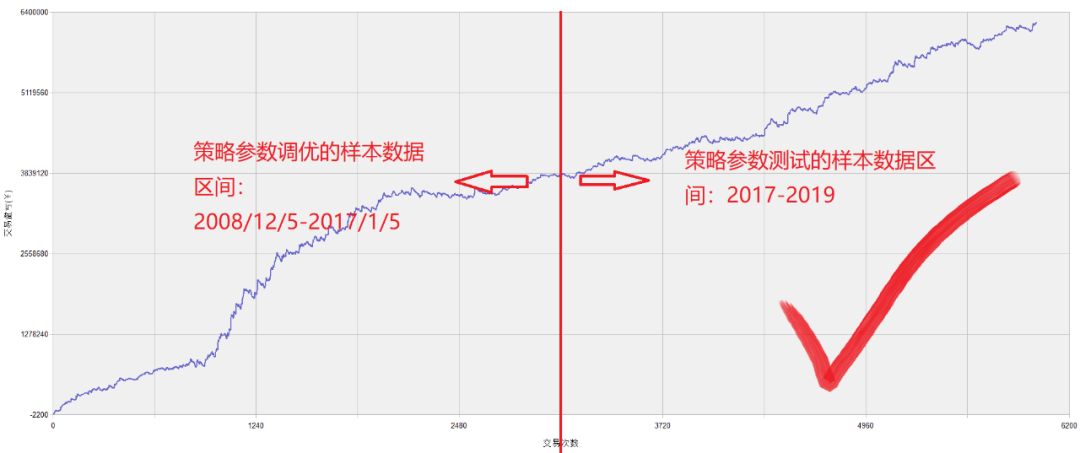
Use different data sets for the tuning set and validation set (correct tuning)
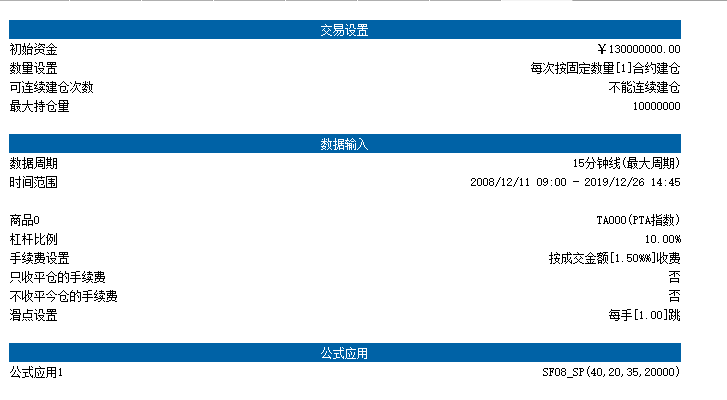
The SF08 strategy optimization parameters are calculated using different data sets for the tuning set and the validation set, and finally obtain reasonable strategy parameters, reject over-optimization, and return to the real performance of the strategy!
PS: The parameter tuning uses the data from 17 years ago, and the verification test uses the data after 17 years;
The strategy provides source code for four platforms:
MC, Pyramid, TB, Mandarin 8
Strategic thinking:
1. Use variables to record the intersection of KD's fast and slow moving averages, and then obtain the number of cycles between the last cross and this cross.
2. Calculate the high and low points in this cycle, and enter the market when the price breaks through the high and low points after the cross; 3. Use the short-distance chandelier moving line to leave the market;
Policy version:
Dual versions of stock indices and commodities;
Application period:
15 minutes for commodities, 5 minutes for stock indices;
transaction cost:
1.5%%, 1 sliding jump (2 jumps) for each Kaiping;
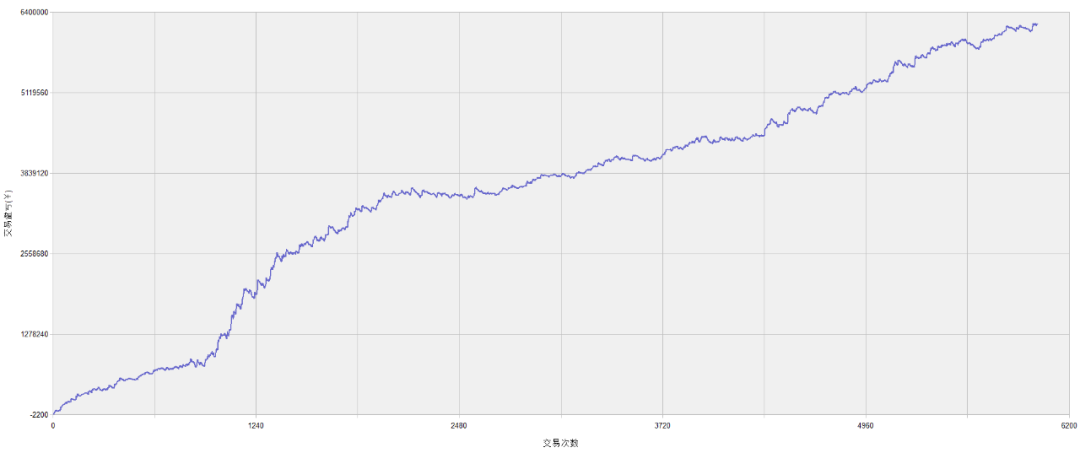
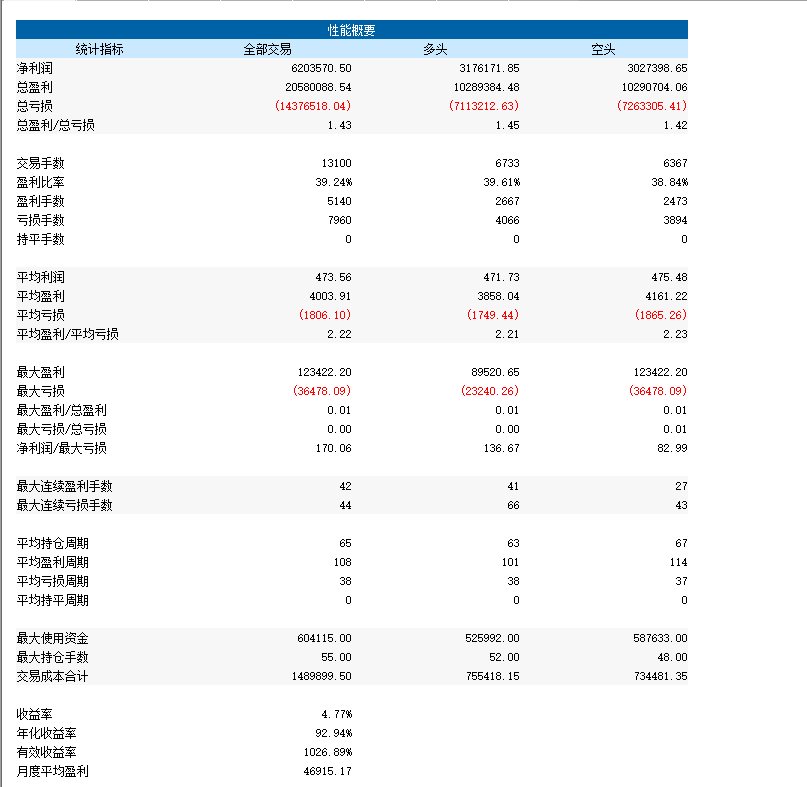
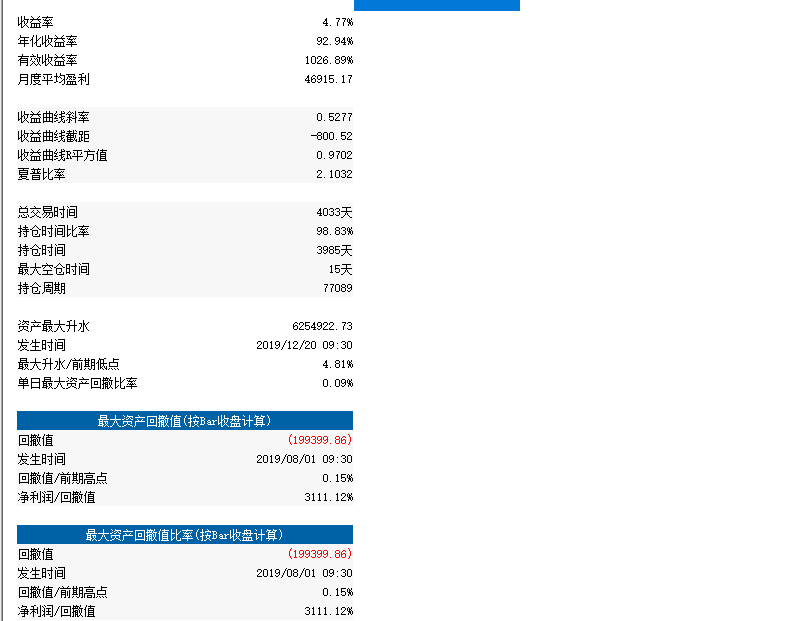
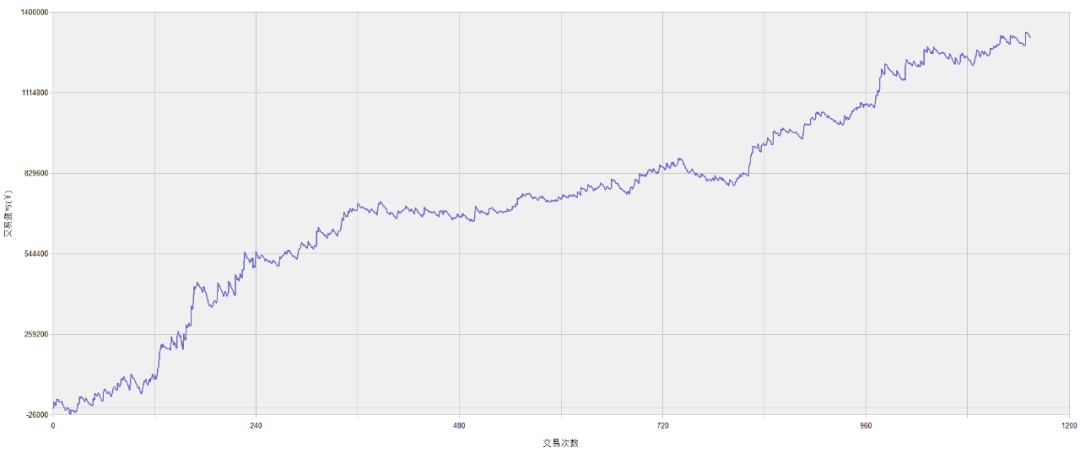
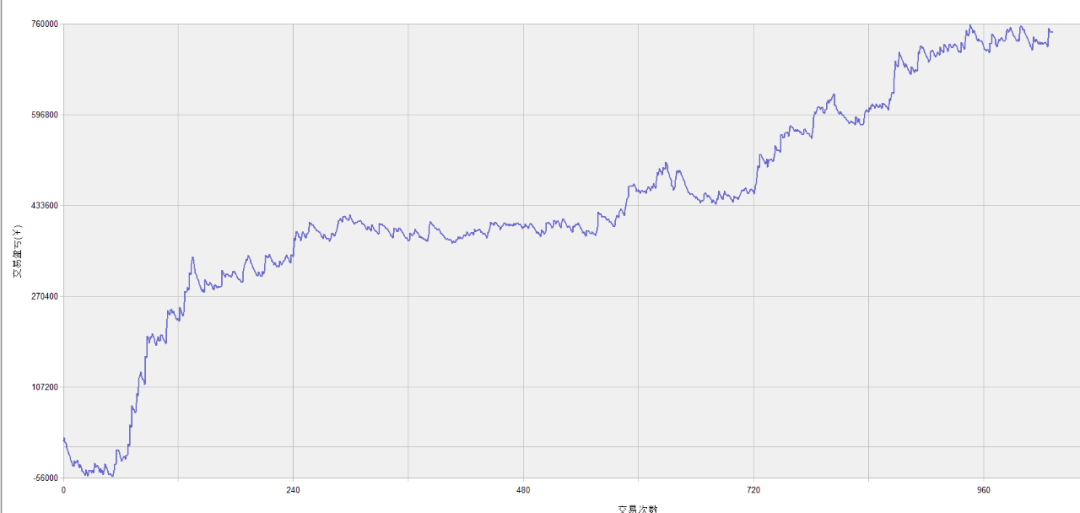
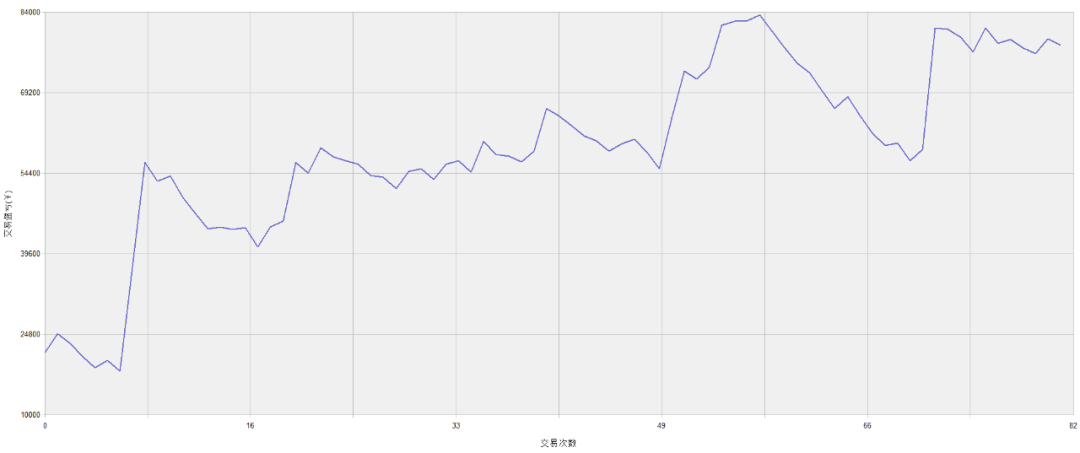
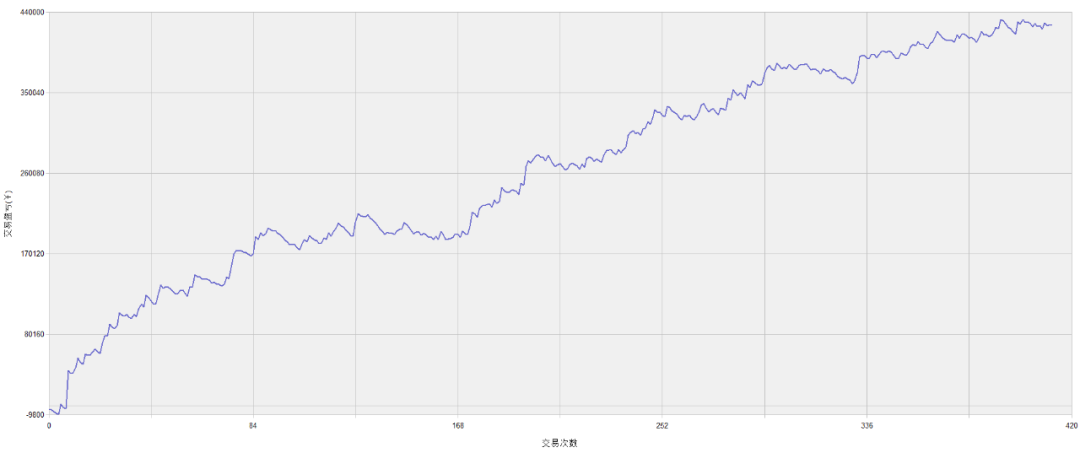
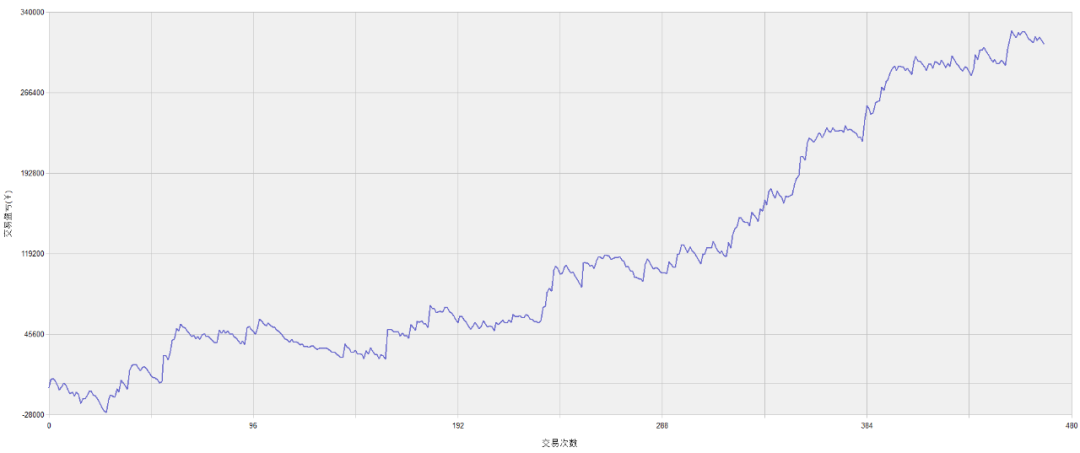
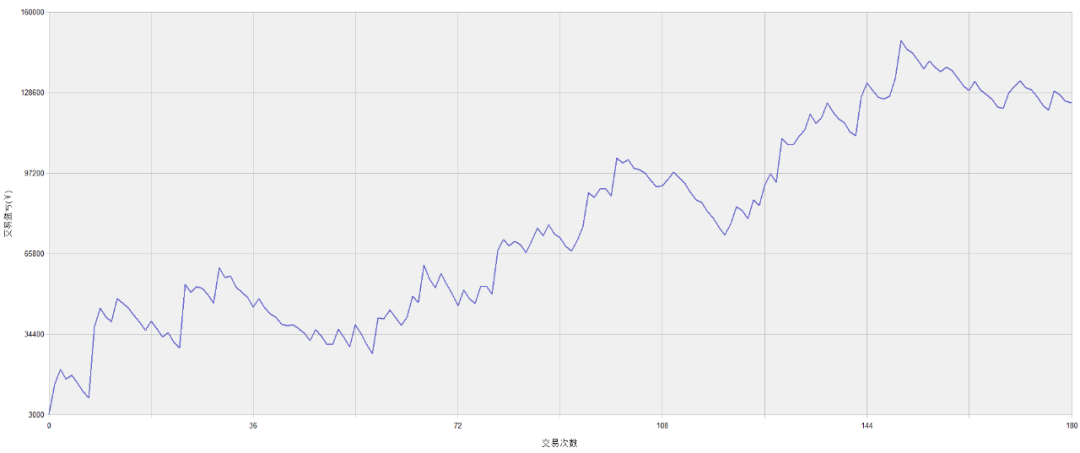
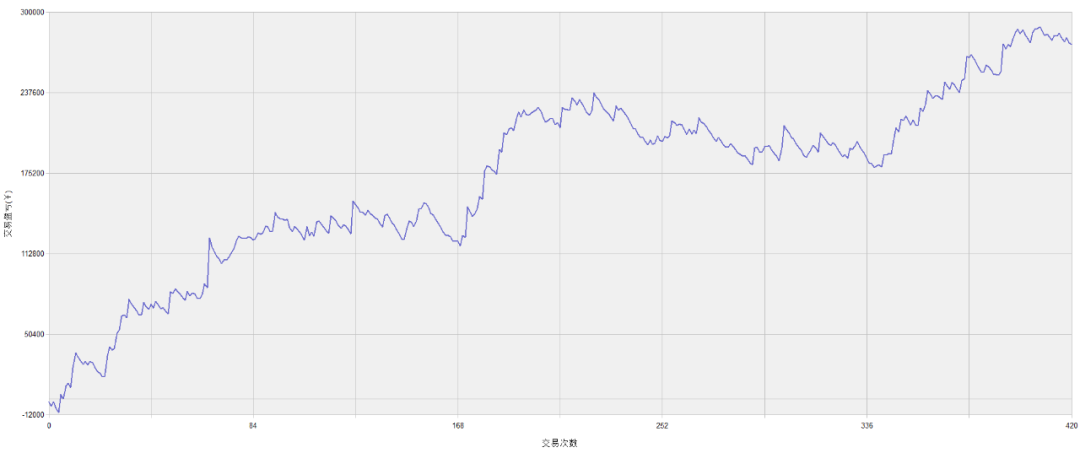
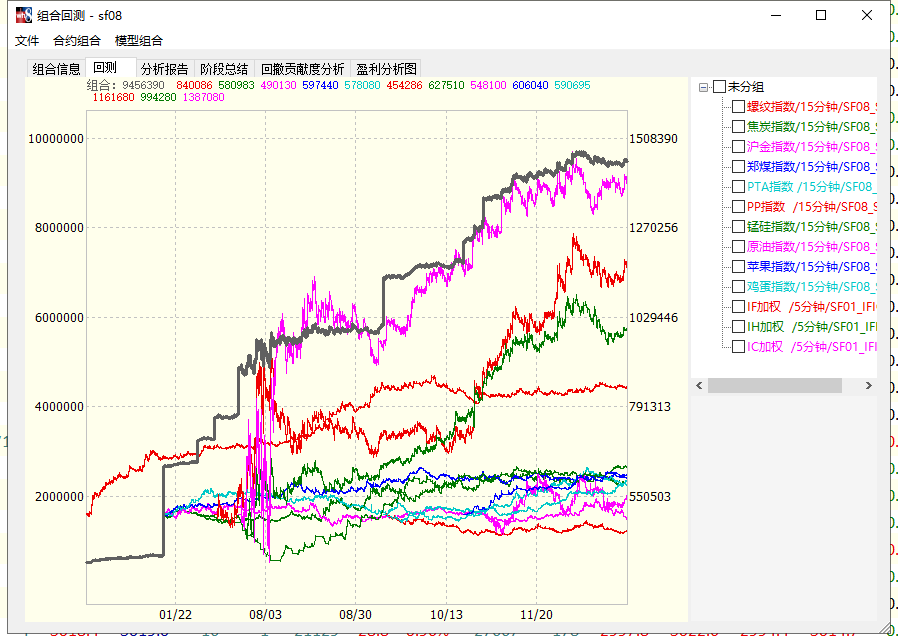
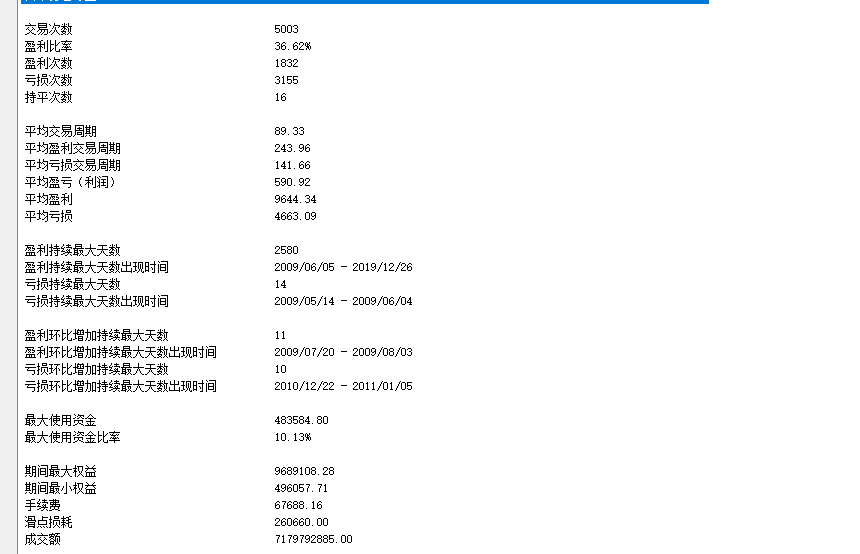
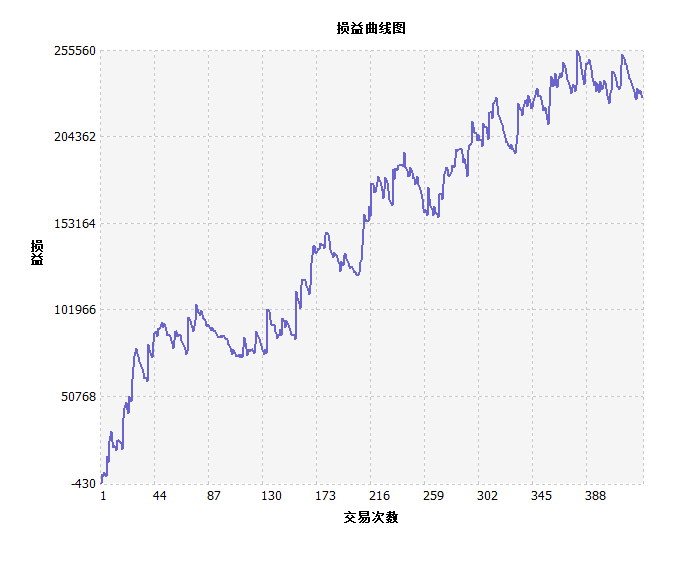
SF08 strategy performance is as follows:
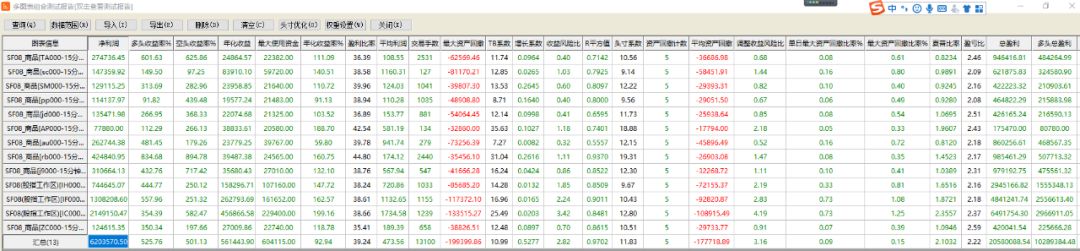
IC
IF
IH
apple
thread
coke
thermal coal
PTA
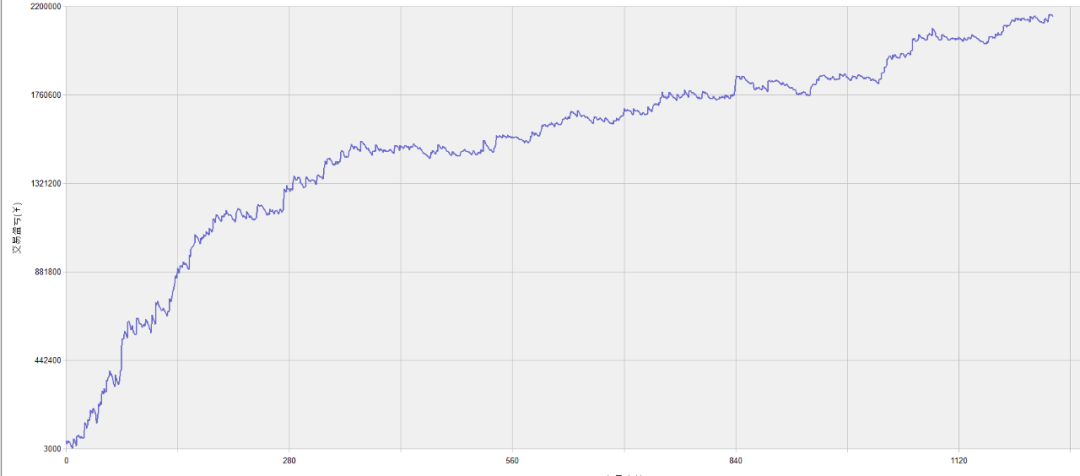
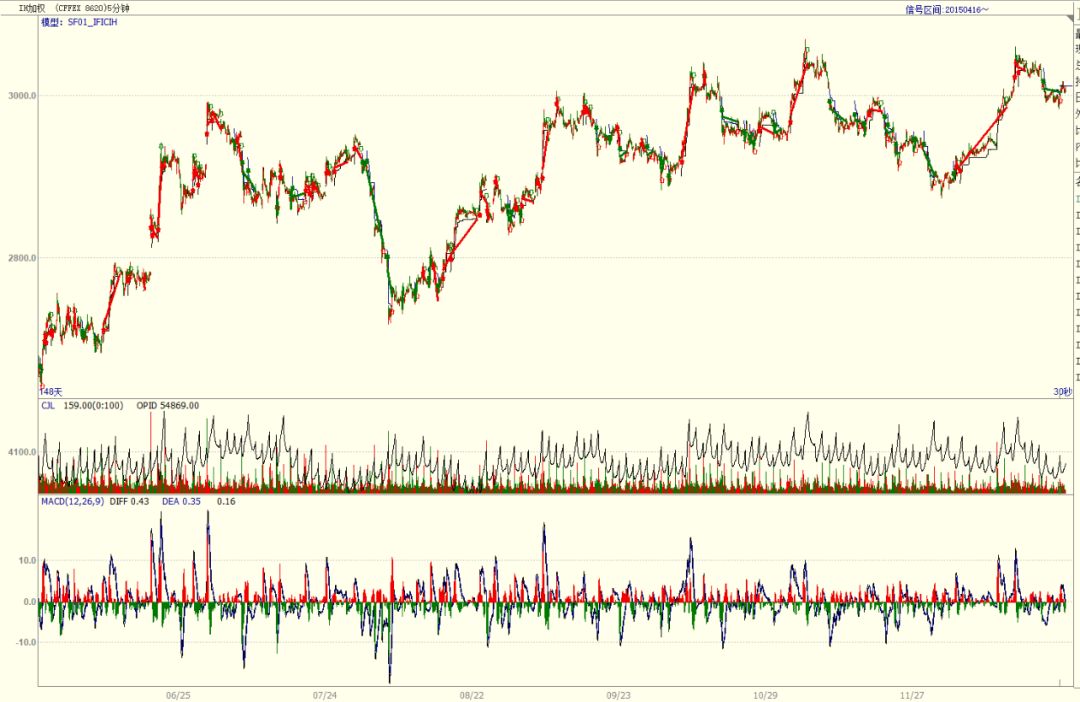
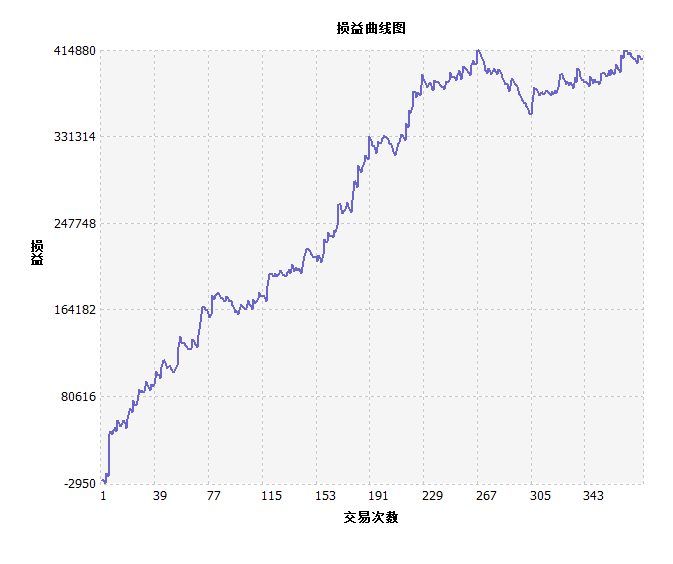
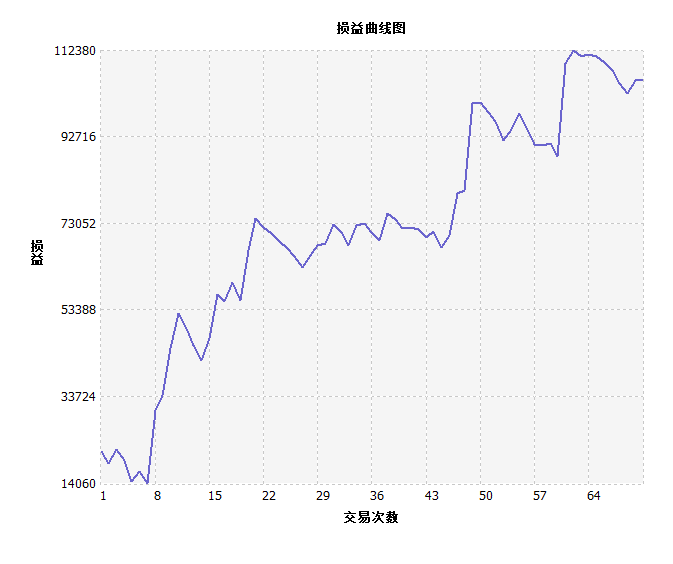
Signal diagram:

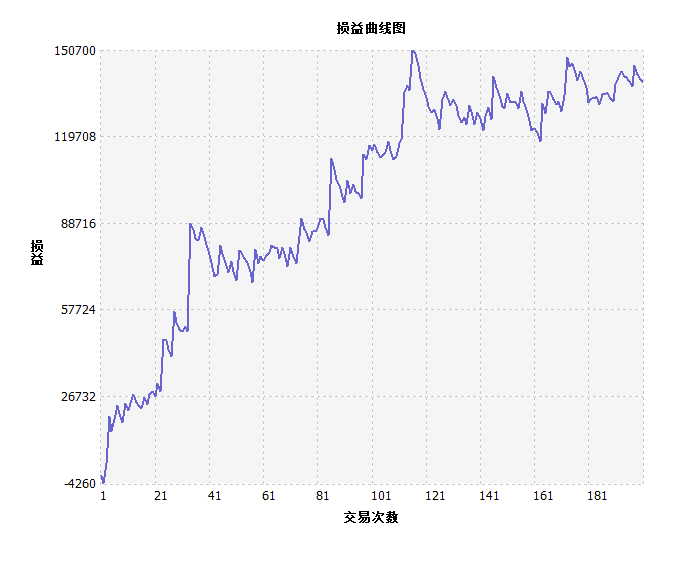
Mandarin 8 test performance:

thread
apple
coke
thermal coal
This strategy is only used for learning and communication, and investors are personally responsible for the profit and loss of real trading.