https://www.cnblogs.com/by-dream/p/5611555.html
◆ Copyright statement: This article is from Fat Meow~'s blog, and the source must be indicated when reprinting.
Please indicate the source for reprint: http://www.cnblogs.com/by-dream/p/5611555.html
I knew that sooner or later I had to embark on the road of backtesting, but I didn't expect it to happen so suddenly. I have taken over a new project. After the first version is released, the product needs to do operational activities, because I am worried that the sudden influx of traffic will cause pressure on the background? So I decided to do a stress test:
The following is a step-by-step introduction to my stress measurement process from 0 to 1.
I downloaded apache-jmeter-2.13, because this package is downloaded for general linux and windows, so we open it under windows now.
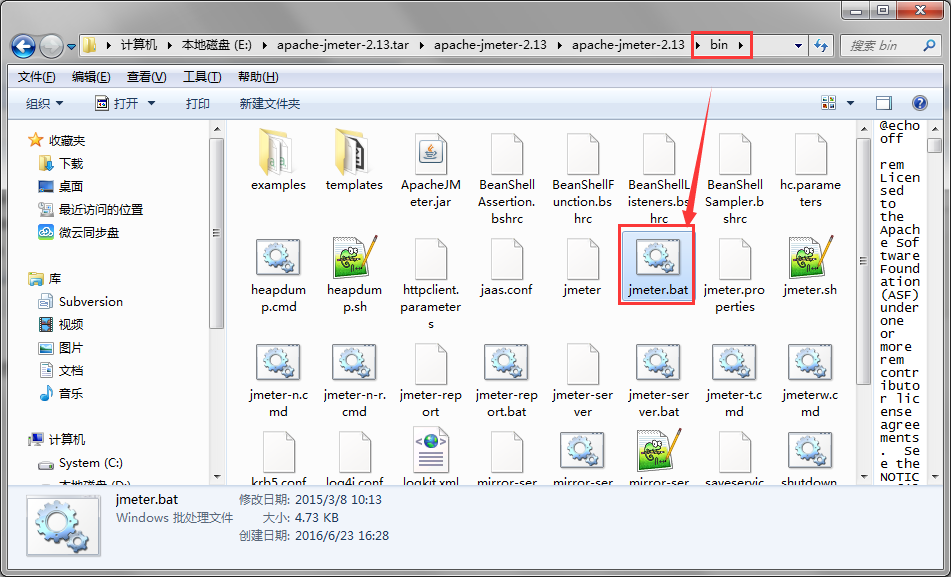
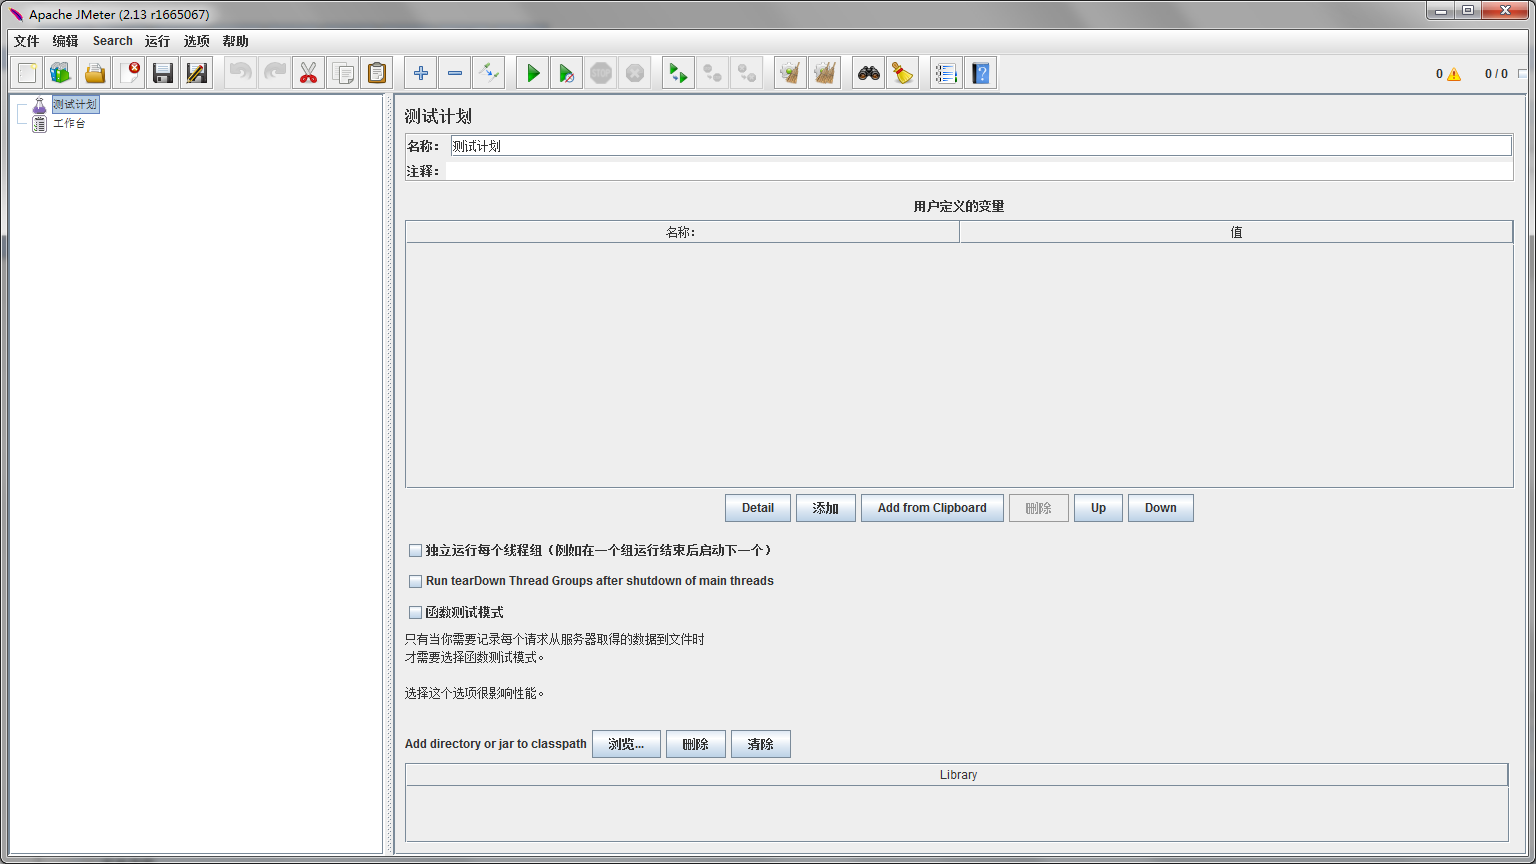
Click bat directly to open jmeter:
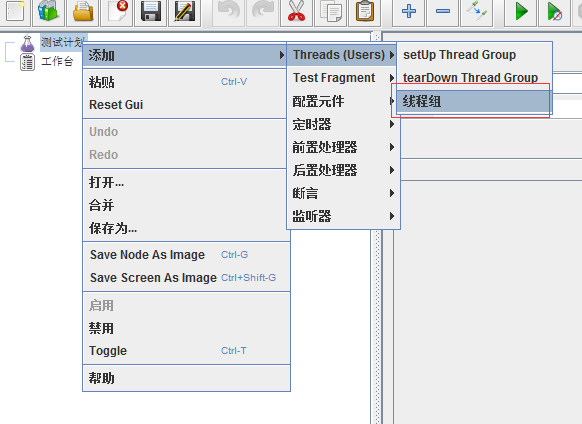
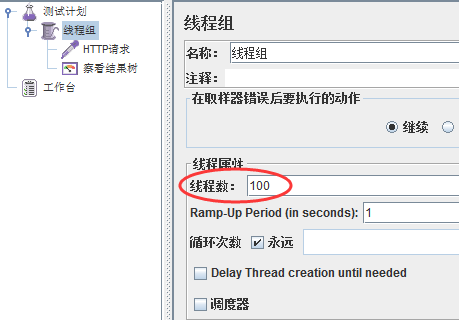
Add a thread group:
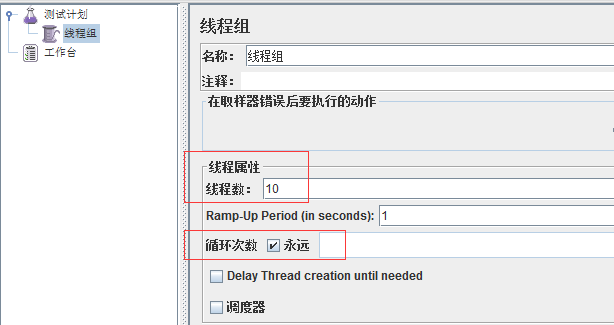
After the addition is complete, first set these two items:
Then right click on the thread group on the left and add an http request
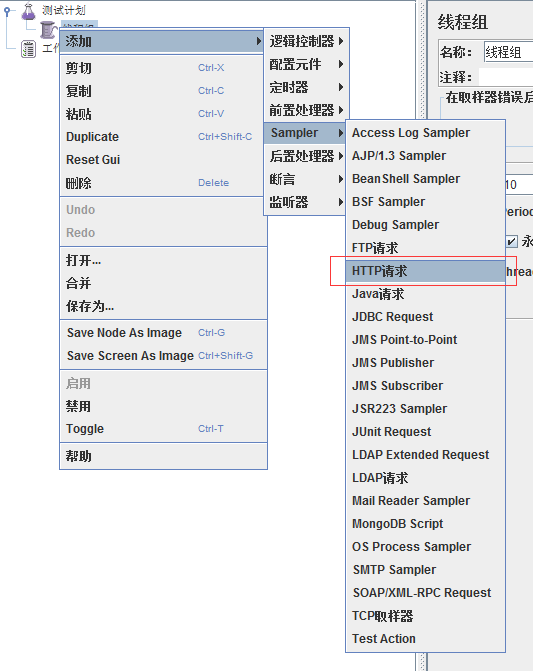
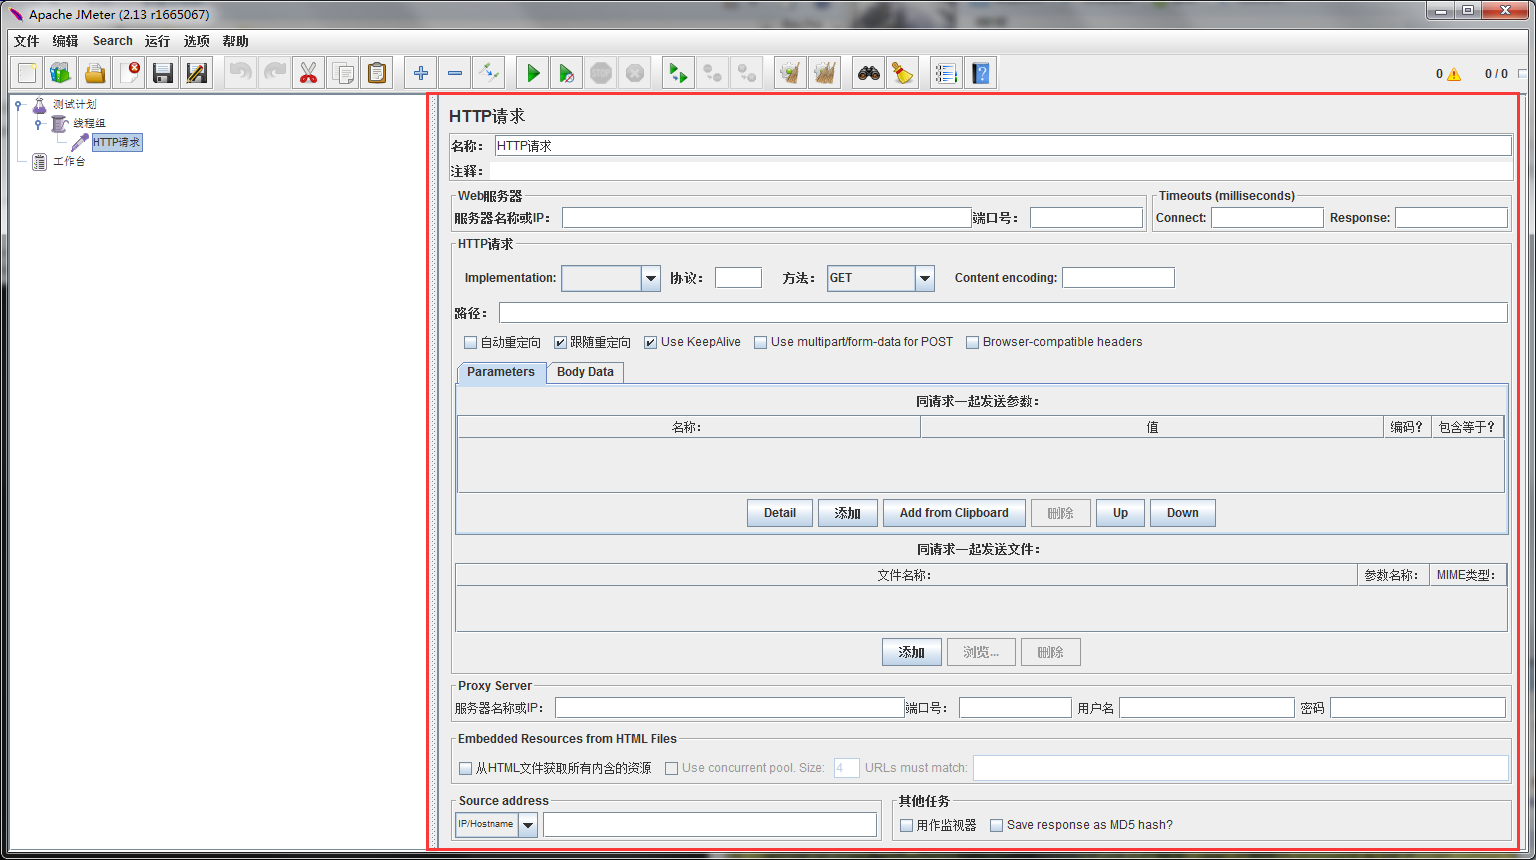
After the addition is complete, we can see that there is an editable place on the right:
Here we plan to stress test such a url, the url request is http://cm.browser.qq.com/test_xianwu/api/buy
That is to pull the information of the home page of the App
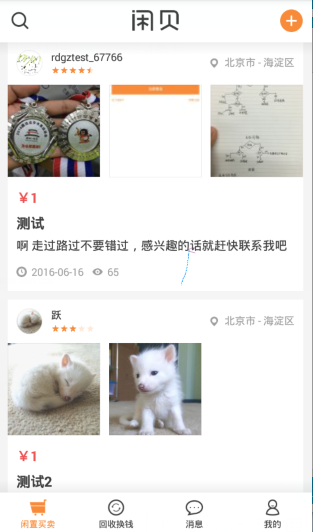
We open it directly with the browser like this:

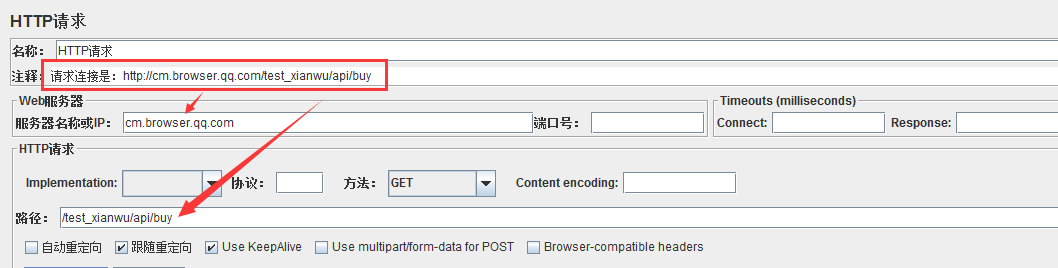
See the figure below, we need to divide the url into two parts to fill in
At this time, click Save, and the saved file path is specified by yourself. I saved it to the bin directory. After saving, it is a jmx file.
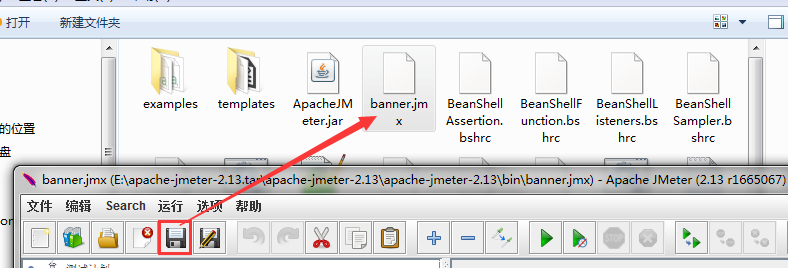
After saving, we need to check the result of the request during the stress test, so we need to add a "view result tree"

After adding it looks like:

At this time, let's click Start and see the effect:

At this time, we increase the number of threads, first to 100
After adding it, I went to the App to take a look, and found that the homepage was tragic, with a white screen:
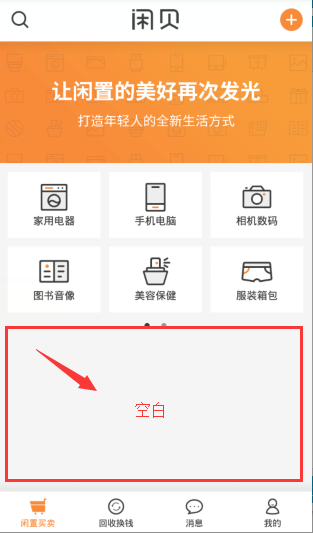
At this time, we took a look on the website and found that sure enough, among the returned substrings, the content of the list is empty, and this list is the item to be displayed on our home page:

Now that we know that the feature of the request returning failure is that the list is empty, then add an assertion to let him directly help us filter out the samples of the request failure.
Also right-click, "Add" - "Assert" - "Response Assertion", after the addition is complete, we add a substring:
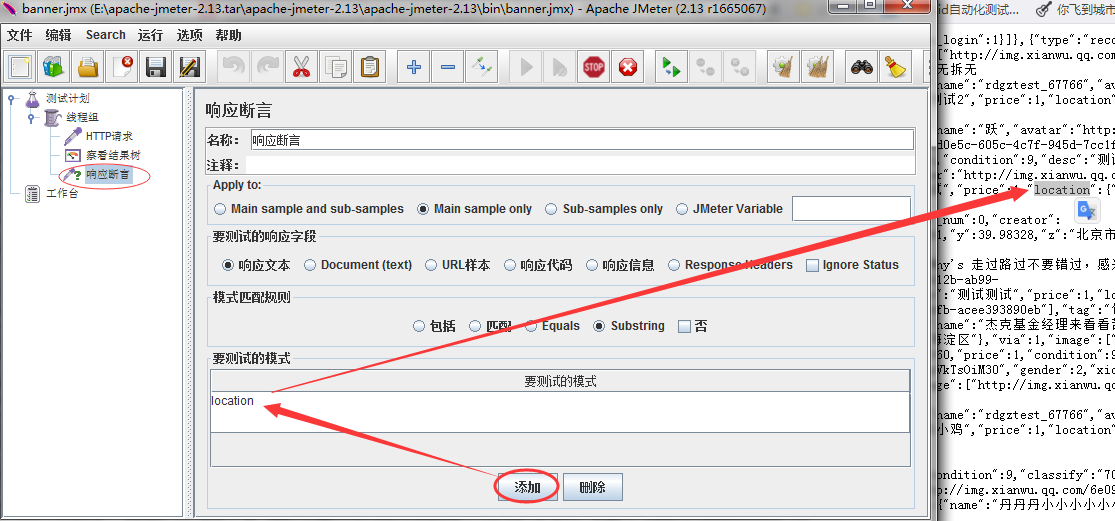
Let's talk about what the hell is location. Because the information in the returned list contains location when the request is successful, we can simply think that when the location field exists, the request is successful.
At this time, let's run it again to see if the result tree will help us identify it:

We can see that red is the number of failures. The number is a bit large, so we need to use Aggregate Graph
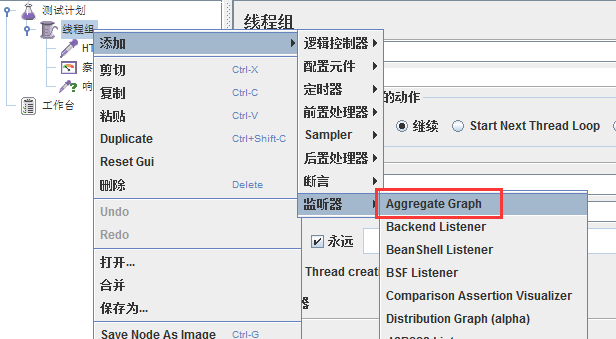
After the addition is complete, we start our service, and at this time we can see an approximate data here:
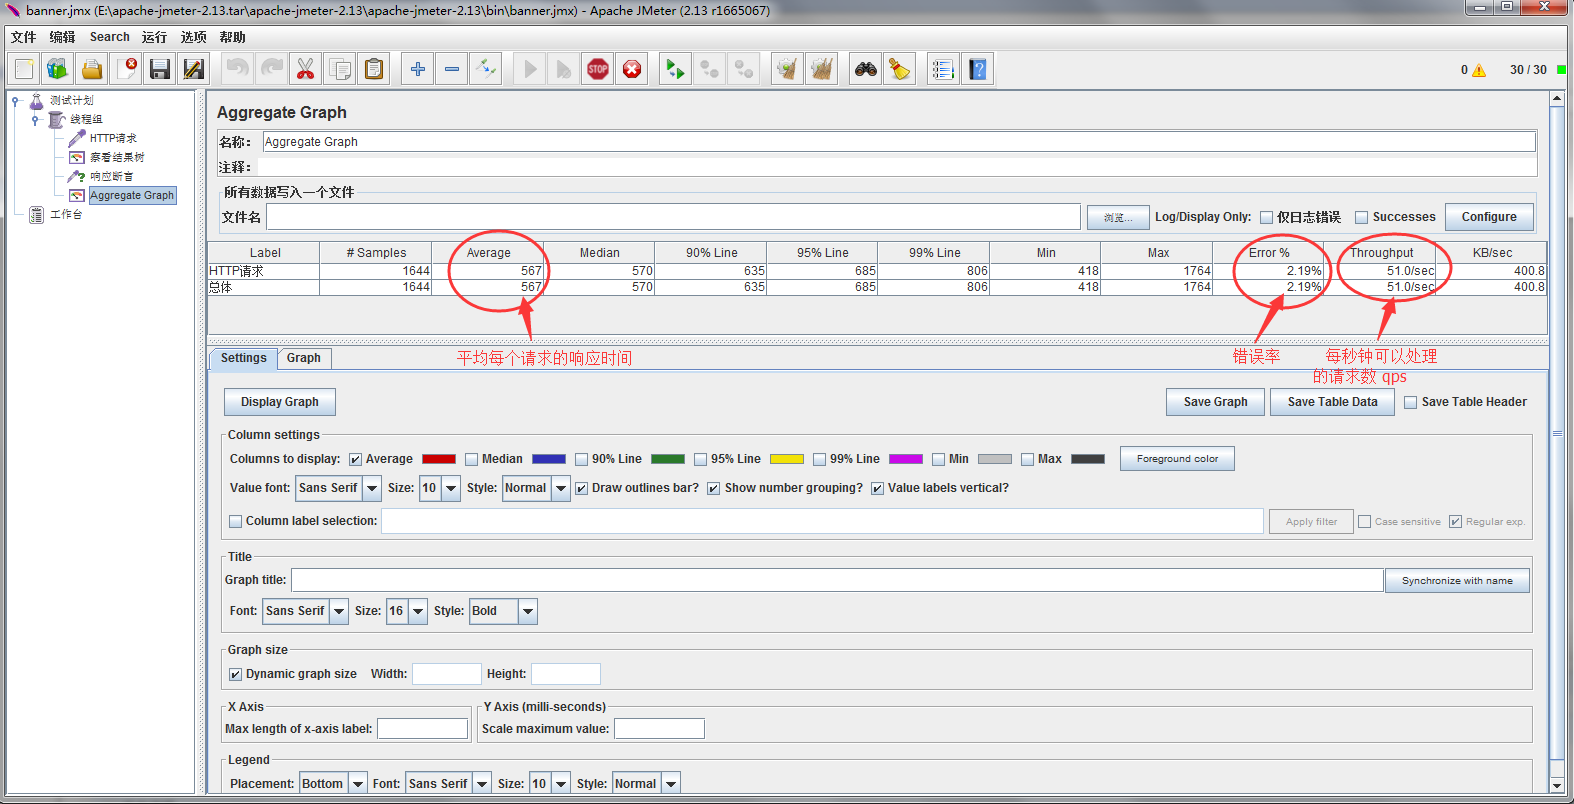
In this way, we can constantly change the number of threads, and then observe the failure rate and throughput, and get an optimal corresponding number for a current request.
In the process of testing, I found that if I force the stop manually, the last few requests will throw exceptions because of the manual stop, so we decided to let him request 2w times, and automatically stop after 2w times. Then we need to set the number of acquisitions at the beginning:

It should be noted here that the product of the number of threads and the number of loops is equal to a fixed value. Then you can change the two multipliers. In the end, I chose the number of threads to be 10, 20, 50, 80, 100, and 200. The result is :
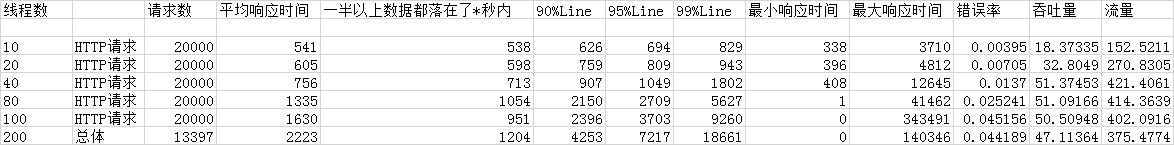
Finally, the chart is generated, and the bottleneck of performance can be seen. The following are the results:

From the figure, it is not difficult to see that the response time delay is very large, and the error rate is very high, and the maximum qps can only hit the early 50s, so we initially suspected that this was a performance problem, and finally fed back to the development, and the development added a caching mechanism, And added the machine, after optimization, let's look at the data comparison:

It is obvious that the effect of optimization is significant and the expected effect is achieved.
This is my first simple stress test. After reading it, you can do it too.