Practice the answers of 7, 8, 9, 10, and 11 on the computer
-
- 7. Refer to Example 13.7. Use the Canvas component to create a program for drawing strings and graphics, and draw the function y=cos(x). The program running results are shown in Figure 13-20.
- 8. Refer to example 13.8 and example 13.9 programming, use turtle drawing to draw a red triangle, green square, and blue regular pentagon on the same horizontal line and write explanatory text. Among them, the red triangle is drawn from the origin, and the 3 figures are separated by 100 points. Finally, print the words "Drawing completed!" 200 points away from the triangle, in Arial font, 20 font size. The screenshot of the program running is shown in Figure 13-21.
- 9. Refer to Example 13.13, use the plot() function to draw a graph, draw a straight line graph with the X-axis coordinate values of 0, 1, 2, 3, 4, and the corresponding Y-axis coordinate value y = 6x + 5. The program running effect is shown in Figure 13-22.
- 10. Refer to Example 13.14, use the Matplotlib module to draw the function curve of y = cos(x). The running effect of the program is shown in Figure 13.23.
- 11. Refer to Example 13.15, using the NumPy module and Matplotlib.pyplot toolkit to draw..···············································································································································································································································································
I wanted to find the answer online, but found that there were all the previous ones, but there were no questions at the end of this chapter, so I made a note of it myself, and it was a complete answer. Of course, the answer is for reference only.
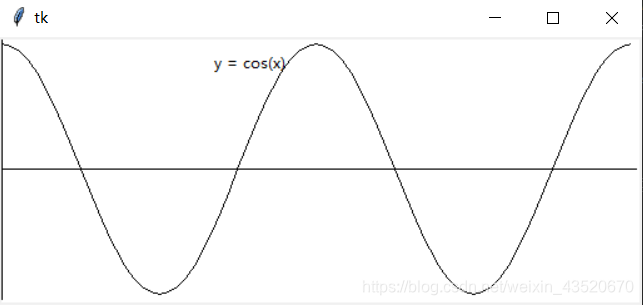
7. Refer to Example 13.7. Use the Canvas component to create a program for drawing strings and graphics, and draw the function y=cos(x). The program running results are shown in Figure 13-20.
Reference Code:
from tkinter import *
import math

WIDTH, HEIGHT = 510, 210
ORIGIN_X, ORIGIN_Y = 2, HEIGHT/2 #原点

SCALE_X, SCALE_Y = 40, 100 #x轴、y轴缩放倍数
ox, oy = 0, 0
x, y = 0, 0
arc = 0 #弧度
END_ARC = 360 * 2 #函数图形画两个周期

root = Tk()
c = Canvas(root, bg = 'white', width = WIDTH, height = HEIGHT)
c.pack()

c.create_text(200, 20, text = 'y = cos(x)')
c.create_line(0, ORIGIN_Y, WIDTH, ORIGIN_Y)
c.create_line(ORIGIN_X, 0, ORIGIN_X, HEIGHT)
for i in range(0, END_ARC+1, 10):
    arc = math.pi * i / 180
    x = ORIGIN_X + arc * SCALE_X
    y = ORIGIN_Y - math.cos(arc) * SCALE_Y
    c.create_line(ox, oy, x, y)
    ox, oy = x, y

root.mainloop()
Run screenshot:
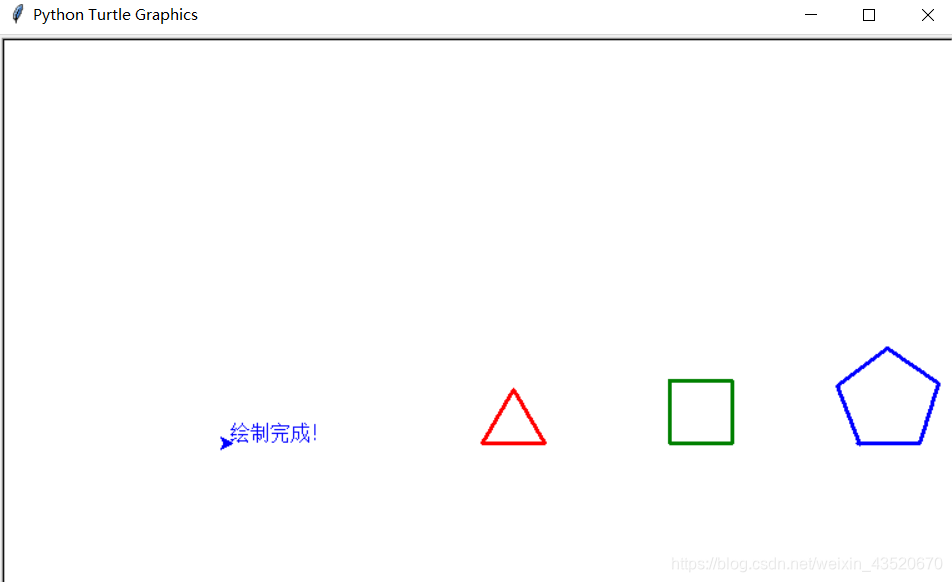
8. Refer to example 13.8 and example 13.9 programming, use turtle drawing to draw a red triangle, green square, and blue regular pentagon on the same horizontal line and write explanatory text. Among them, the red triangle is drawn from the origin, and the 3 figures are separated by 100 points. Finally, print the words "Drawing completed!" 200 points away from the triangle, in Arial font, 20 font size. The screenshot of the program running is shown in Figure 13-21.
Reference Code:
#导入模块和创建对象
import turtle
p = turtle.Turtle()
p.pensize(3)
p.speed(1)

#红色三角形
p.goto(0,0)
p.color("red")
for i in range(3):
    p.forward(50)
    p.left(120)
p.up()


#绿色正方形
p.goto(150,0)
p.down()
p.color("green")
for i in range(4):
    p.forward(50)
    p.left(90)
p.up()

#蓝色五边形
p.goto(300,0)
p.down()
p.color("blue")
for i in range(5):
    p.forward(50)
    p.left(72.5)
p.up()

p.goto(-200,0)
p.down()
p.write("绘制完成!",font={

    "Arial",20})
Run screenshot:
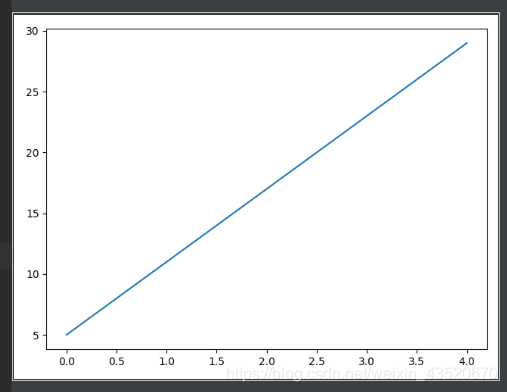
9. Refer to Example 13.13, use the plot() function to draw a graph, draw a straight line graph with the X-axis coordinate values of 0, 1, 2, 3, 4, and the corresponding Y-axis coordinate value y = 6x + 5. The program running effect is shown in Figure 13-22.
Reference Code:
Note: matplotlib needs to be downloaded and imported separately
# 导入 matplotlib 模块中的子模块 pyplot 并起别名 plt
import matplotlib.pyplot as plt
# 导入 math 模块
import math
# 给定横坐标的值
x = [ i for i in range(5)]
# 给定纵坐标的值
y = [6*i + 5 for  i in x]
#绘制
plt.plot(x,y)
#显示
plt.show()
Run screenshot:
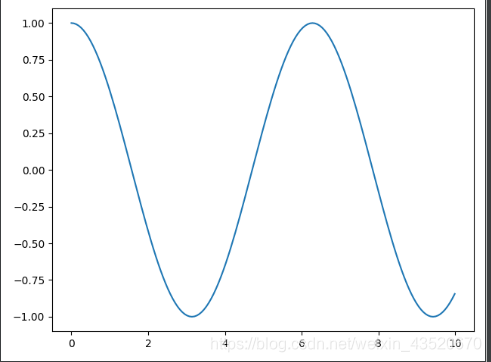
10. Refer to Example 13.14, use the Matplotlib module to draw the function curve of y = cos(x). The running effect of the program is shown in Figure 13.23.
Reference Code:
# 导入 matplotlib 模块中的子模块 pyplot 并起别名 plt
import matplotlib.pyplot as plt
# 导入 math 模块
import math
# 给定横坐标的值
x = [ 2*math.pi*i/100 for i in range(160)]
# 给定纵坐标的值
y = [math.cos(i) for  i in x]
#绘制
plt.plot(x,y)
#显示
plt.show()
Run screenshot:
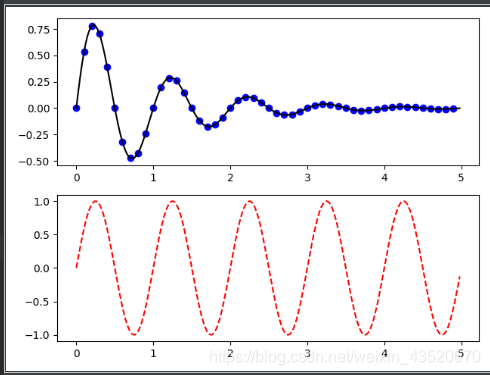
11. Refer to Example 13.15, using the NumPy module and Matplotlib.pyplot toolkit to draw..···············································································································································································································································································
Reference Code:
# 导入Numpy模块
import numpy as np
# 导入 matplotlib 模块中的子模块 pyplot 并起别名 plt
import matplotlib.pyplot as plt
def fun(t):
    return np.exp(-t) * np.sin(2 * np.pi * t)
t1 = np.arange(0.0,5.0,0.1)
t2 = np.arange(0.0,5.0,0.02)
plt.figure(1)
plt.subplot(211)
plt.plot(t1,fun(t1),'bo',t2,fun(t2),'k')
plt.subplot(212)
plt.plot(t2,np.sin(2 * np.pi * t2),'r--')
plt.show()
Run screenshot: