forward from:
Maximum likelihood estimation (understand by example)
Likelihood and maximum likelihood estimation
Likelihood and probability
In statistics, the likelihood function (usually abbreviated as likelihood) is a very important content. In informal situations, likelihood and probability (Probability) are almost synonymous, but in statistics, likelihood However, probability and probability are two different concepts. Probability is the possibility of something happening in a specific environment, that is, before the result is produced, the possibility of something happening is predicted based on the parameters corresponding to the environment, such as tossing a coin , we don’t know which side it is before. Up, but according to the nature of the coin, we can infer that the probability of any side up is 50%. This probability is meaningful only before the coin toss, and the result after the coin toss is certain; However, it is just the opposite. Is it possible to speculate on the possible environment (parameters) that produced the result after a certain result, or the example of a coin toss. Suppose we toss a coin 1,000 times at random. The result is 500 heads up and 500 numbers up ( The actual situation is generally not so ideal, here is just an example), we can easily judge that this is a standard coin, the probability of both sides is 50%, this process is that we judge the matter itself based on the result Properties (parameters), that is, likelihood.
When the result and the parameter correspond to each other, the likelihood and probability are equal in value. If θ is used to represent the parameter corresponding to the environment and x is the result, then the probability can be expressed as:
P(x|θ)
P(x|θ)
is the expression method of conditional probability. θ is the precondition, which is understood as the probability of occurrence of event x under the premise of θ. The corresponding likelihood can be expressed as:

It is understood that the known result is x and the parameter is the probability corresponding to θ (theta in the likelihood function is a variable, where the parameter ## title## is relative to the probability), namely:
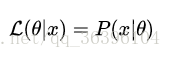
It should be noted that the two are equal in value, but have different meanings. It
for example
Take Bernoulli distribution (Bernoulli distribution, also known as two-point distribution or 0-1 distribution) as an example:
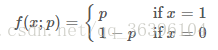
It can also be written in the following form:
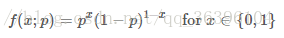
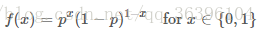
Here pay attention to distinguish the difference between f(x;p) and the previous conditional probability. The p after the quotation marks only means that f depends on the value of p, and p is not a precondition of f, but only a parameter of this probability distribution. You can omit the content after the quotation marks:
For any parameter pp, we can draw a probability diagram of Bernoulli distribution, when p=0.5p=0.5:
f(x)=0.5
- 1
- 2
We can get the following probability density plot:
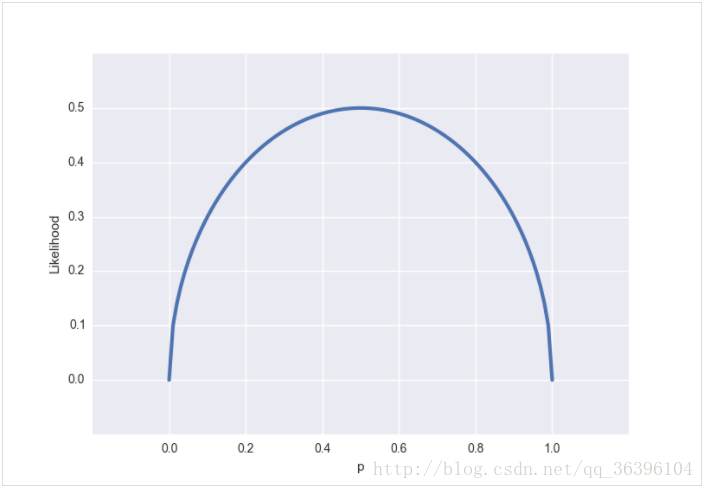
From the perspective of likelihood, suppose that the result we observe is x=0.5x=0.5 (that is, the probability that a certain side is up is 50%. This result may be obtained through thousands of tens of thousands of trials. In short We now know this conclusion), we can get the following likelihood function:
The corresponding figure is this:

Unlike the probability distribution graph, the likelihood function is a continuous function within (0, 1), so the resulting graph is also continuous. It is easy to see that the extreme value (also the maximum value) of the likelihood function is at p= It is obtained at 0.5p=0.5. Usually, it is not necessary to make a graph to observe the extreme value. The extreme value condition can be obtained by setting the partial derivative of the likelihood function to zero.
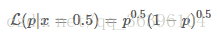
ps. The pp in the likelihood function describes the nature of the coin rather than the probability of the event (for example, p=0.5p=0.5 describes a coin with even two sides). To avoid confusion, other letters can be used to express this property. If we use ππ to express, then the likelihood function can be written as:
Maximum likelihood function
What does the maximum value of the likelihood function mean? Let us return to the definition of probability and likelihood. Probability describes the possibility of an event under certain conditions. The greater the probability, the more likely this event will occur; while likelihood describes the situation where the result is known. Below, the probability of the event occurring under different conditions, the greater the value of the likelihood function, the greater the probability of the event occurring under the corresponding conditions.
Now let’s take a look at the coin toss example mentioned earlier:
The above pp (the nature of the coin) is the condition for the occurrence of the event we are talking about. LL describes coins of different nature. How likely is the probability that any one side is up to 50%? Isn't it a bit roundabout? Let us define A:
A=The result of the event=50% probability of any aspect being upward
So LL describes coins of different natures. How likely is the event A? Isn't that clearer?
In many practical problems, such as in the field of machine learning, we are more concerned about the maximum likelihood function. We need to find the most likely conditions for producing such results based on known events. The goal is of course to be based on this most likely Conditions to infer the probability of unknown events. In this coin toss event, pp can take all the values in [0, 1], which is determined by the nature of the coin. It is obvious that p=0.5p=0.5. This kind of coin is most likely to produce what we observe the result of.
Logarithmic likelihood function
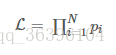
The actual problem is often much more complicated than a coin flip, involving multiple independent events, and multiplication usually appears in the expression of the likelihood function:
The derivation of the multinomial product is often very complicated, but the derivation of the multinomial summation is much simpler. The logarithmic function does not change the monotonicity and extreme position of the original function, and according to the nature of the logarithmic function, it can be The product is converted into addition and subtraction, which can greatly simplify the process of derivation:
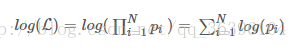
In the formula derivation of machine learning, similar transformations can often be seen.
Seeing this should not be so confused anymore~ Finally, let's take another example:
Take an example from a personal blog. If there is a jar with balls in black and white colors, the number is unknown, and the ratio of the two colors is also unknown. We want to know the ratio of the white balls to the black balls in the tank, but we cannot count all the balls in the tank. Now we can take a ball out of the shaken tank at will every time, record the color of the ball, and then put the ball out back into the tank. This process can be repeated, and we can use the recorded color of the ball to estimate the proportion of black and white balls in the tank. If in the previous 100 repetitions, 70 times are white balls, what is the most likely proportion of white balls in the tank? Many people have the answer right away: 70%. And what is the theoretical support afterwards?
我们假设罐中白球的比例是p,那么黑球的比例就是1-p。因为每抽一个球出来,在记录颜色之后,我们把抽出的球放回了罐中并摇匀,所以每次抽出来的球的颜 色服从同一独立分布。这里我们把一次抽出来球的颜色称为一次抽样。题目中在一百次抽样中,七十次是白球的概率是P(Data | M),这里Data是所有的数据,M是所给出的模型,表示每次抽出来的球是白色的概率为p。如果第一抽样的结果记为x1,第二抽样的结果记为x2... 那么Data = (x1,x2,…,x100)。这样,
- 1
- 2
P(Data | M)
= P(x1,x2,…,x100|M)
= P(x1|M)P(x2|M)…P(x100|M)
= p^70(1-p)^30.
So when p takes what value, the value of P(Data |M) is the largest? Take the derivative of p^70(1-p)^30 with respect to p and make it equal to zero.
70p^69(1-p)^30-p^70*30(1-p)^29=0。
Solving the equation can get p=0.7.
At the boundary point p=0,1, P(Data|M)=0. So when p=0.7, the value of P(Data|M) is the largest. This is the same as the result calculated according to the proportion in the sampling in our common sense.
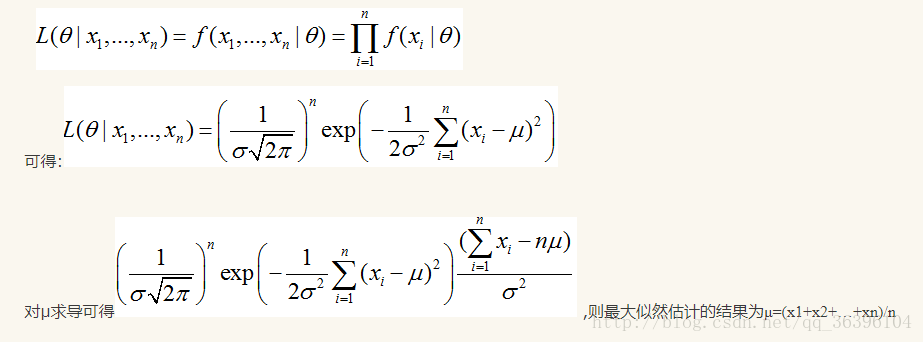
If we have a set of sampling values of continuous variables (x1, x2,..., xn), we know that this set of data obeys a normal distribution and the standard deviation is known. When is the expected value of this normal distribution, the probability of generating this existing data is the greatest?
P(Data | M) = ?
According to the formula
From the above, we can see the general solution process of maximum likelihood estimation:
(1) Write the likelihood function;
(2) Take the logarithm of the likelihood function and organize it;
(3) Find the derivative;
(4) Solving the likelihood equation