1. Installation
glances is developed in python, so python environment is required to run, and python needs to be installed first
1. Use pip to install glances
pip install glances
2. Use epel public network yum source
yum install epel * -y
yum -y install glances
3. Temperature monitoring tool
yum -y install lm_sensors
lm_sensors can monitor data such as motherboard, CPU operating voltage, fan speed, temperature, etc. The monitored data can be called and displayed by glances . It can prevent the CPU from overheating and being burned during the performance test.
4. Web page monitoring
pip install bottle
Two, glances function
glances can grasp the usage of system resources in real time, by default it is updated every two seconds and displayed on the terminal.
glances dynamic monitoring does not consume a lot of system resources, such as CPU, which usually consumes less than 2%.
glances can capture the same data to a file for later analysis and graph drawing of reports. The supported file formats are .csv spreadsheet format and html format.
The data that glances can monitor are:
· CPU usage
· Memory usage
· Disk I/O speed, transfer and read/write ratio
· Kernel statistics and run queue information
· File system free space
· Disk Adapter
· Network I/O speed, transmission and read/write ratio
· Web space and page speed
· Processes that consume the most resources
· Computer information and system resources
Three, glances use
1. Glances is a command line tool, you can directly use the glances command to view server resource usage
-b: display network connection speed Byte/sec
-B @IP|host: bind the server-side IP address or host name
-c @IP|host: connect to the glances server
-C file: The default configuration file is /etc/glances/glances.conf
-d: Turn off the disk I/O module
-e: display sensor temperature
-f file: set the output file (format is HTML or CSV)
-m: close the mounted disk module
-n: close the network module
-p PORT: Set the running port to 61209 by default
-P password: set the client/server password
-s: Set glances operating mode to server
-t sec: Set the time interval for screen refresh, the unit is second, the default value is 2 seconds, the value range is 1~32767
-v: display version information
2. Glances monitoring indicators
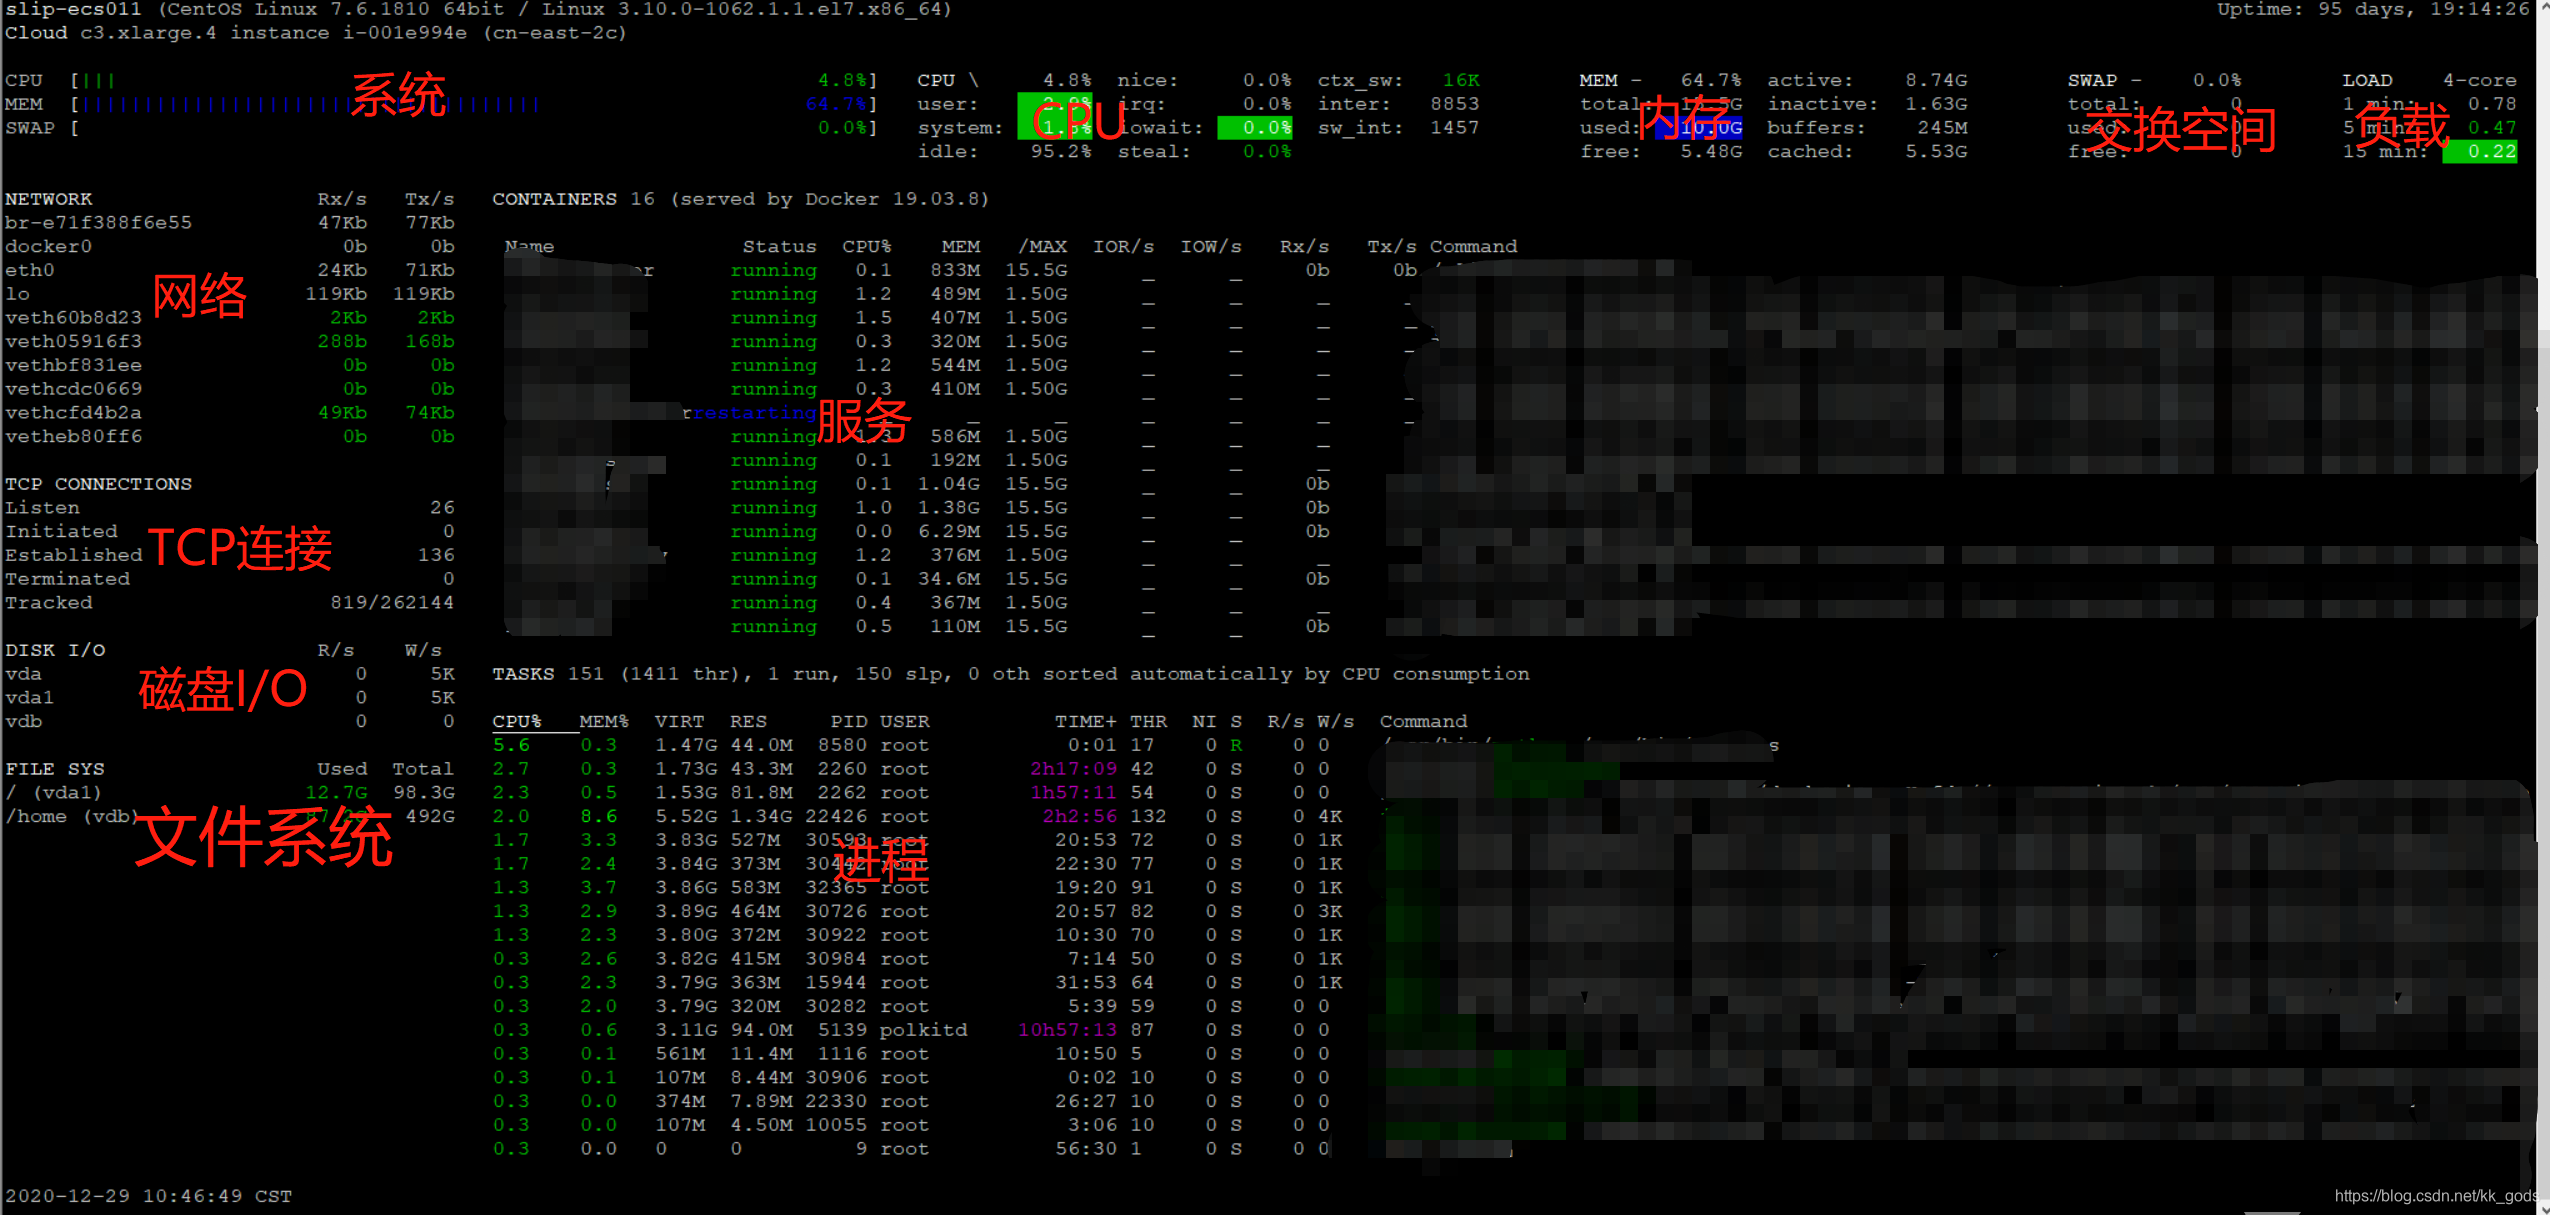
Green: CPU usage, disk space usage, and memory usage are below 50%, system load is below 0.7, system resources are sufficient, and performance is good.
Blue: CPU usage, disk space usage, and memory usage are between 50%-70%, system load is between 0.7-1, and system resources are relatively sufficient.
Pink: CPU usage, disk space usage, and memory usage are between 70%-90%, and the system load is between 1-5, and system resource usage is high. You need to find reasons to optimize performance.
Red: CPU usage, disk space usage and memory usage are greater than 90%, system load is greater than 5, system resources are severely insufficient, and crashes or downtime may occur.
Tasks displays process information, details:
%CPU:该进程占用的 CPU 使用率
%MEM:该进程占用的物理内存和总内存的百分比
VIRT: 虚拟内存大小
RES: 进程占用的物理内存值
PID: 进程 ID 号
USER: 进程所有者的用户名
TIME+: 该进程启动后占用的总的 CPU 时间
THR;线程数
NI: 进程优先级
S: 进程状态,其中 S 表示休眠,R 表示正在运行,Z 表示僵死状态。
R/s或IOR: 进程的读 I/O 速率
W/s或IOW: 进程的写 I/O 速率
IO_R 和 IO_W: 进程的读写 I/O 速率
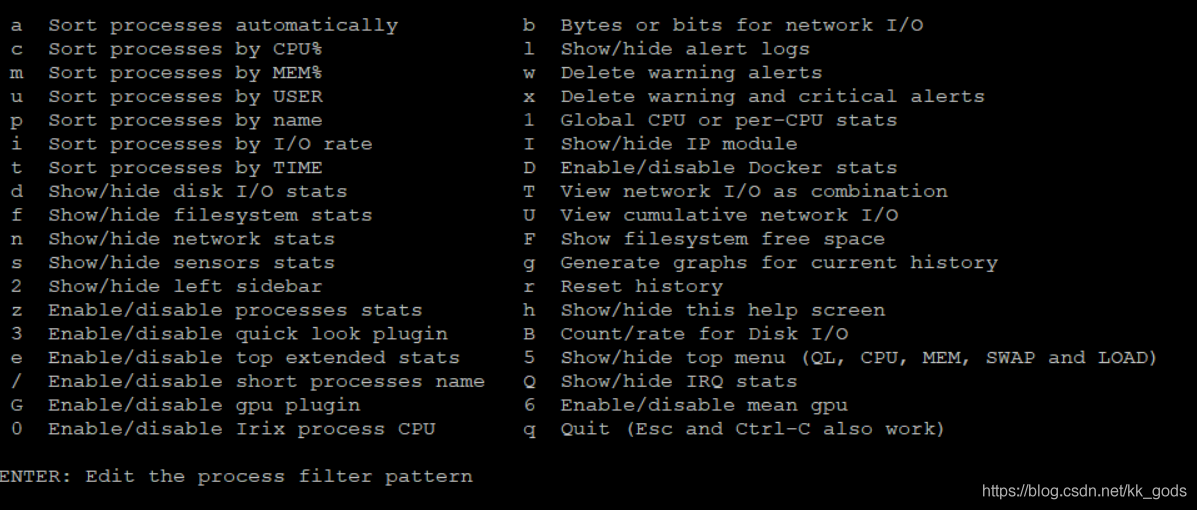
Command: 进程名称In addition, glances supports interactive operation, commonly used shortcut keys are
c: Sort processes by CPU usage
m: Sort processes by memory usage
p: Sort processes by process name
i: Sort processes by I/O frequency
d: show/hide disk I/O statistics
f: show/hide file system statistics
n: show/hide network statistics
s: show/hide sensor statistics
w: delete warning record
x: delete warning and critical logs
h: show/hide help interface
q: exit
3. C\S monitoring mode
glances supports remote monitoring
(1) Install glances on the client and server respectively
(2) Server-side startup: glances -s -B XXXX
(3) The server opens the firewall: the default port number is 61209
(4) The client connects to the server to view resource monitoring: glances-c XXXX
4. View raw stats data
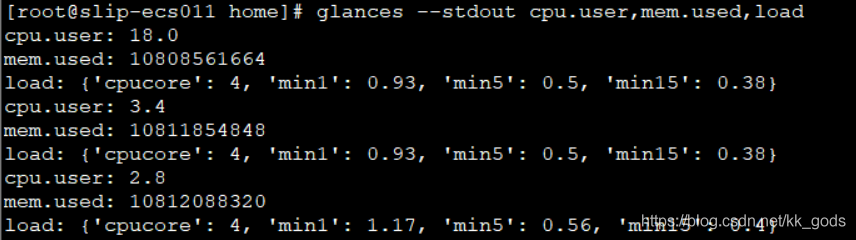
Output in csv format

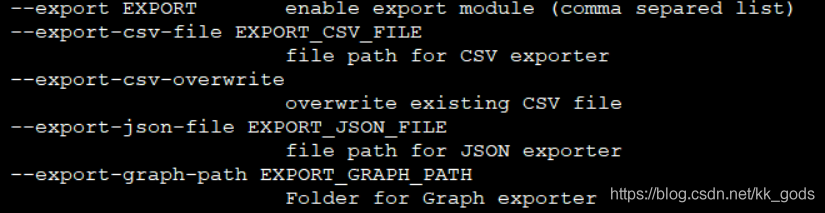
3. Save glances results
1. The output is in csv\json and other formats
2. The output is in html format
pip install Jinja2 or yum -y install python-jinja2
glances -o HTML -f /home/test/html