Do you really understand stress testing? Actual combat describes the design and implementation of performance test scenarios
Following the two articles "Performance Test Environment Construction" and "Pressure Mode Selection", today let me take you through actual combat to understand the common ideas and methods of performance test scenario design and implementation. The article is mainly divided into two parts: theory and practice. You can read selectively according to different needs. Before entering the topic, let's review the concept of performance testing.
Preface
Common categories of performance testing
Load test:
A confirmatory test whose purpose is to verify whether the performance under preset load conditions meets the performance goals (availability, concurrency/RPS, response time, etc.), and will not continue to increase the load after reaching the performance goals.
Stability testing:
A subset of load testing that focuses on discovering and verifying problems that can only be exposed after a long period of operation. Such as memory leaks, FGC, etc.
Stress testing:
A destructive test that attempts to detect the extreme capabilities of an application or infrastructure. Therefore, the load will be increased during the stress test until some performance indicators no longer meet the performance expectations. Stress testing can find synchronization problems, race conditions, memory leaks, etc. that only occur under high load conditions. Through stress testing, we can also determine the conditions under which application services will become unavailable, unavailable phenomena, and which monitoring indicators can be used to monitor impending unavailability. The stress test results can usually be provided for current limiting and other control systems. Data support.
Capacity testing: It is
often carried out together with capacity planning to maximize the utilization of limited resources (cost) while ensuring that the user experience is not affected (stability). It can also be used to estimate how many resources (such as processors, memory, disks, and network bandwidth) are needed to support future user growth to a certain level.
Design of application performance scenarios
After understanding the relevant background, we began to enter the topic. The design of performance scenarios mainly includes three key steps: business scenario modeling, test data preparation, and monitoring indicator confirmation. Below we use actual combat methods to illustrate the common practices of each step.
Business scenario modeling
Determine the scope of stress testing scenarios:
Humans are unpredictable, and it is basically impossible to simulate the possible operation scenarios of each user in performance testing. In general, the performance scenarios that we must pay attention to include but are not limited to:
- High-frequency usage scenarios
- Key business scenarios
- The most performance-consuming scene
- Scenes where there have been problems
- ……
When testing a business with a large number of new functions, it is often necessary to confirm with the business side which functions are expected to be used frequently, and it is necessary to confirm with the R&D personnel which functions are not used frequently, but there are performance risks and easy to cause Avalanche effect: When testing the functions that have been launched, you can also analyze the behavior patterns of existing users through business monitoring and system logs to obtain business scenarios that are closer to real user behavior.
Operation path of the
business scenario : The operation path of the business scenario can be described with the help of some visual tools. This part of the work is relatively simple and will not be detailed. We elaborate on the more common delay strategies.
Thinking time
Thinking time simulates a scenario where users are waiting for a response, reading page content, filling in forms, and other delayed operations. Everyone's reading speed and input speed are very different, which determines that everyone's thinking time is also different. There are four common delay models in the performance test configuration to cover most of the delay scenarios:
- Fixed time: As the name suggests, set a fixed thinking time.
- Uniform distribution: random numbers uniformly distributed between the upper and lower limits of the range.
- Normal distribution: According to the central limit theorem, if a thing is affected by multiple factors, no matter what the distribution of each factor itself, after they are added up, the average of the result is a normal distribution.
- Negative exponential distribution: This model strongly biases the frequency of the delay time to one end of the range.
- Bactrian camel normal distribution: Bactrian camel normal distribution can simulate the first time you visit the page description and read the entire page carefully, but the next time you visit, you will directly scan the page and click the operation link deep in the page.
We can usually model thinking time in the following ways:
- If it is an online system, the average and standard deviation can be obtained from online log statistics
- There is no online log, and response data can be collected from the usage patterns of internal personnel
- You can calculate the time spent on different pages when you and your colleagues visit
- If there is no better source, you can also obtain delayed data from third-party statistics
Assembling point
Assembling point simulates a large number of users doing the same operation (additional purchase, payment, etc.) together at the same time. The method of aggregation usually includes collection by time and collection by amount. Generally, only services with spike features will be used. Although setting a huge starting level directly in the pressure test tool seems to be able to simulate the behavior of a spike, but the pressure test tool generally has an unstable warm-up process, so it is not recommended to simulate a spike with a super high starting level .
Determine the pressure parameters of the scene
Pressure mode:
There are two common pressure modes. Concurrent mode and RPS mode have no advantages or disadvantages, and each has its own applicable scenarios.
1. Concurrency mode (virtual user mode)
Concurrency refers to the number of virtual concurrent users. From a business perspective, it can also be understood as the number of users online at the same time. If you need to find out the number of online users that each node of the business system can simultaneously carry from the perspective of the client, you can use this mode to set the target concurrency.
2. RPS mode (throughput mode)
RPS (Requests Per Second) refers to the number of requests per second. The RPS mode is the "throughput mode". By setting the number of requests per second, from the point of view of the server, the throughput capacity of the system is directly measured, eliminating the cumbersome conversion of concurrent to RPS, and achieving one step.
Target magnitude: The
target magnitude often comes from the quantification of project plans, goals, business requirements, or technical documents.
The load ratio of the scenario: the
application has been launched , try to use online logs and buried data combined with the expected target of business operations to ensure that the allocation ratio is as close as possible to the actual situation; newly launched applications generally rely on the expected allocation of virtual users in advance, and in testing It can be adjusted step by step during the implementation process.
Test data preparation
High-quality test data should truly reflect the user's usage scenarios. We generally choose real online data as the data source, after sampling, filtering, and desensitization, as the test data for performance testing. Low-quality test data may be able to test some problems, but the greater possibility is invalid test results. The pressure test data includes at least two basic data and runtime data.
- Basic data is mainly metadata stored in the application system, such as user information, product information, commodity information, etc.; the data volume and data distribution of the basic data should be equivalent to the amount of data running online, otherwise it is easy to cause invalid tests.
- Runtime data is mainly the form data that needs to be used during the operation of virtual users, such as the user name, password, and search keywords of the virtual user; the fidelity of the running data is also crucial.
Confirm monitoring indicators
During the execution of the performance test, it is often necessary to observe whether various indicators are normal in real time, including client indicators, application servers, databases, middleware, network portals, and other indicators. More importantly, the monitoring process is the process of discovering system bottlenecks. Monitoring data is an important foundation for performance baseline management, capacity planning, and even high-availability architecture. The monitoring indicators we usually need to pay attention to include:
- Business interface indicators, response time, RPS, success rate, etc.;
- Network indicators, data throughput, data error rate, etc.;
- Server indicators, number of connections, CPU, memory, I/O, disk, etc.;
- ……
The most ideal state is that these monitoring indicators can be integrated with performance testing tools, display monitoring data of various dimensions on an operation interface, and can intelligently and automatically identify indicator abnormalities based on strategies. This is essential to quickly and accurately locate various problems that may occur during pressure testing.
Application scenario design practice
JPetStore is an open source and simple online pet store developed in Java. The source code can be obtained from GitHub. To facilitate the demonstration, we deployed a set of JPetStore pet shopping website using Alibaba Cloud EDAS.
Business scenario modeling
In this actual combat demonstration, we obtain all business scenarios, operation paths, and thinking time through actual operation experience. We first use text to describe the scene and operation path.
- User login, visit the home page -> enter the login page -> login operation
- Purchasing process 1. Visit homepage -> select product category -> enter product list -> enter model list -> view model details -> add shopping cart -> think (3s-5s) -> submit order -> confirm order
- Purchase process 2, visit homepage -> search product -> enter product list -> enter model list -> view model details> add shopping cart -> think (3s-5s) -> submit order -> confirm order
- Purchase process 3, visit the homepage -> search for products -> enter the product list -> enter the model list -> add shopping cart -> think (3s-5s) -> submit an order -> confirm the order
Our purpose is to do a stress test. We choose RPS mode, gradient increasing, funnel model;
- Compared with the concurrent mode, the RPS mode can achieve more precise flow control; common flow limiting facilities are based on the TPS setting threshold; therefore, we prefer the RPS mode.
- We use manual incremental approach to gradually approach the system limit.
- In a real business, users will abandon the purchase due to various reasons (network, inventory, dislike, payment failure, etc.). Here we construct a funnel model. We assume that after 100 people view the details, 30 people join the shopping cart , 15 people submit the order, and finally 10 people confirm the order and the purchase is successful; in a real scenario, we can collect this information from online user behavior.
Assuming that the user login capacity is sufficient, it is not the key business of this stress test. We draw the following conclusions based on online logs and product operation analysis:
- 10% of users using purchase process 1
- 60% of users who use purchase process 2
- The proportion of users who use the purchase process 3 is 30%
In the end, the business model we got is as shown in the figure below: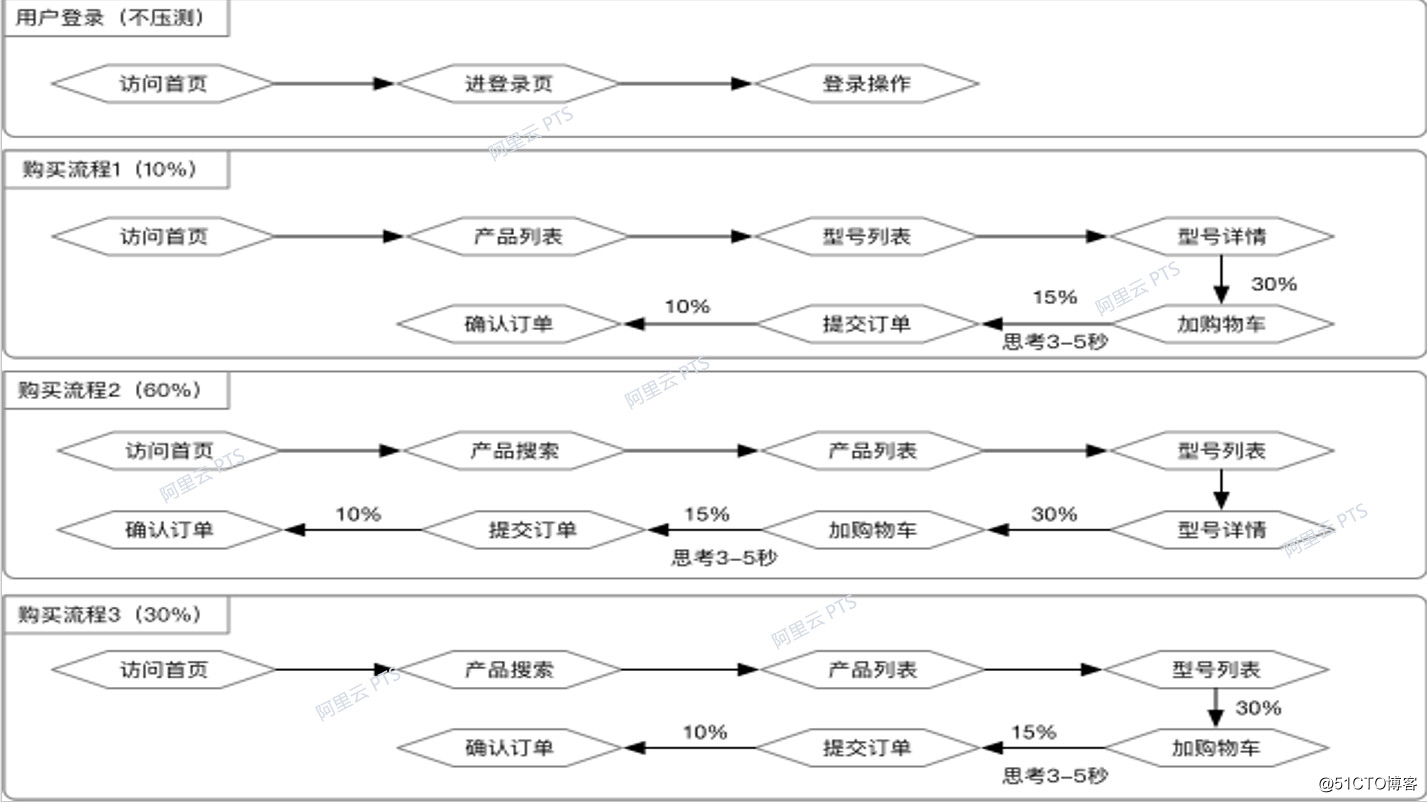
Test data preparation
Because this application is designed for testing, we don’t need to consider data pollution. We dispense with sampling, filtering, and desensitization steps, and directly use online basic data as the basic data for stress testing. The structure of the basic data is shown in the following figure. Of course, the basic data of the real system is much more complicated than this: 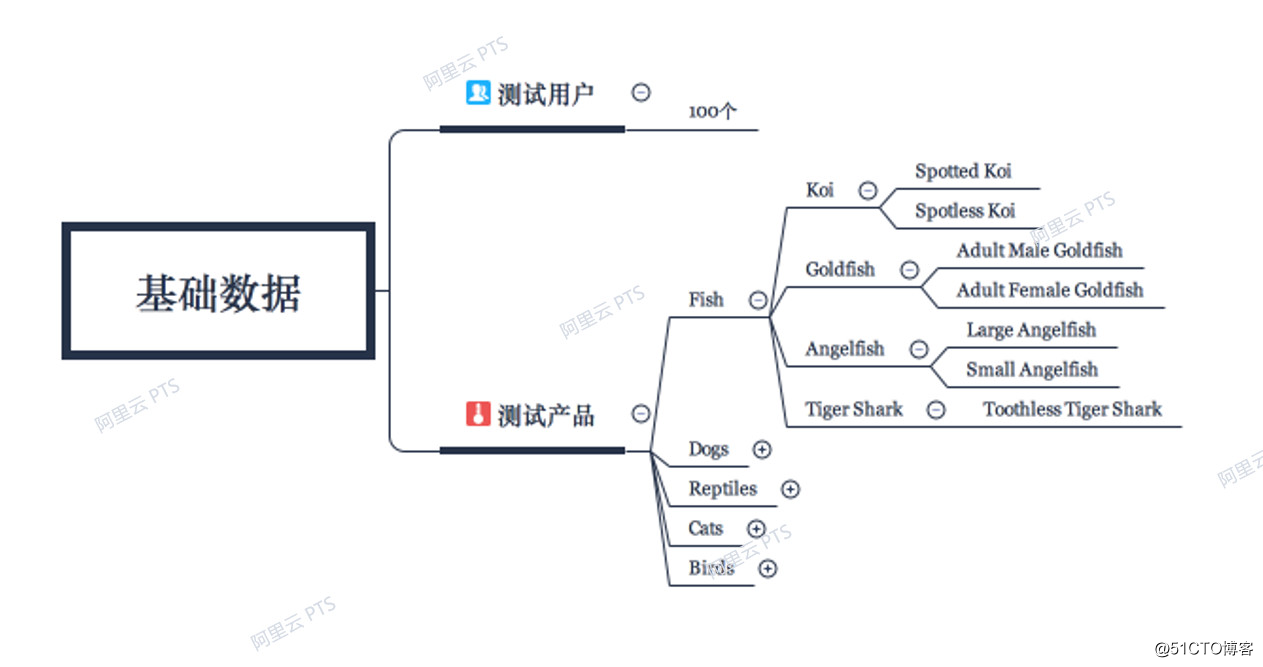
common pressure measurement tools support data sources in the CSV format (which can be simply understood as comma-separated values, but actually more complex). The runtime data format of user login we constructed is shown in the following figure: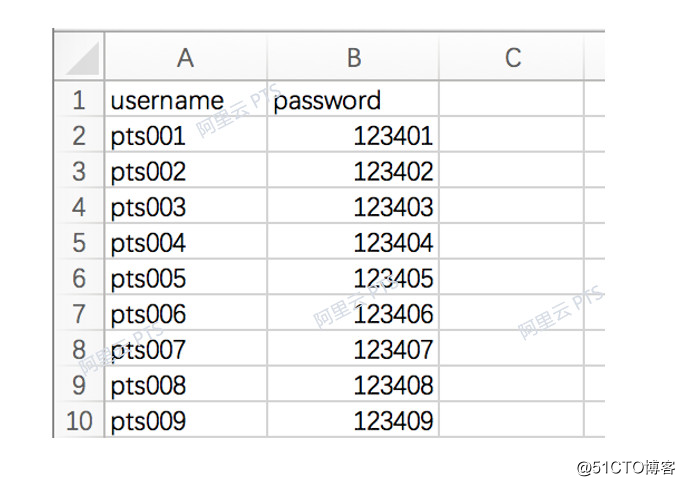
Confirm monitoring indicators
According to our application deployment architecture diagram, we need to pay attention to the basic indicators of SLB, ECS, RDS (cloud monitoring) and the interface indicators such as RPS, RT, and success rate provided by the stress testing engine during this stress test. All monitoring indicators are supported by the platform, so I won’t repeat them here.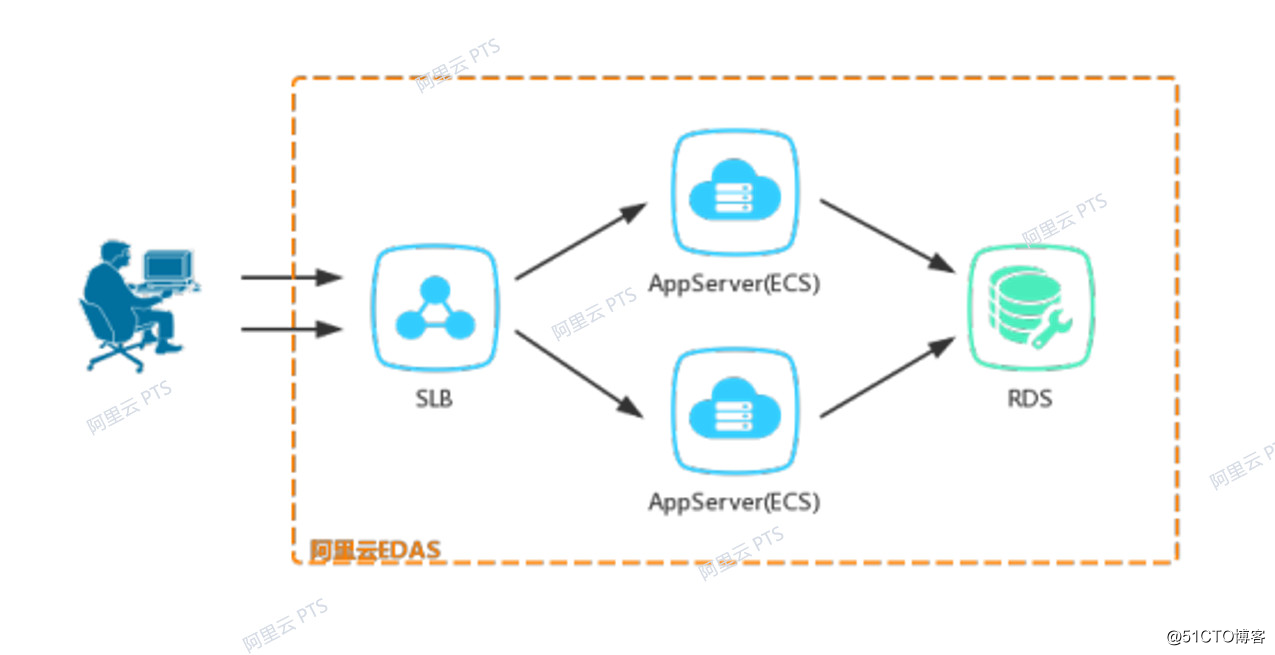
Implementation of application performance scenarios
The implementation of performance scenarios mainly includes three key steps: selection of pressure measurement tools, configuration of performance scenarios, and configuration of pressure parameters. Some pressure measurement tools also provide functions such as monitoring integration and SLA, which we will introduce later.
Pressure measurement tool selection
If you want to do well, you must first sharpen your tools. Choosing an efficient pressure measurement tool can often achieve a multiplier effect with half the effort. However, the selection of pressure measurement tools is already a common topic. Today, we will change the angle and compare it from the perspective of scene realization. I hope that it will be helpful for everyone to choose the type. If there are any areas that are not perfect, please visit Leave a comment at the end of the article. For comparison details, click here.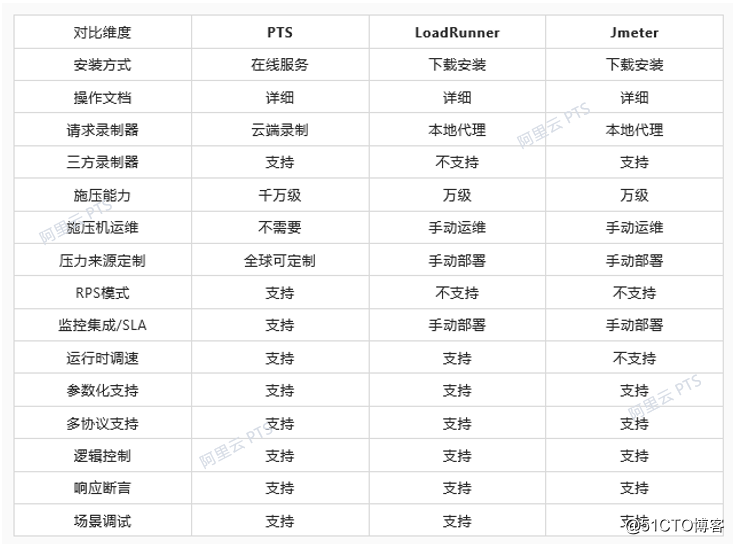
Below we demonstrate how to configure the stress test scenario we designed on Alibaba Cloud PTS. Since the operation is relatively simple, only the key configuration is intercepted for demonstration. If you don’t understand anything, you can leave a message for discussion or enter our DingTalk group to discuss .
Below we demonstrate how to configure the stress test scenario we designed on Alibaba Cloud PTS. Since the operation is relatively simple, only the key configuration is intercepted for demonstration. If you don’t understand anything, you can leave a message for discussion or enter our DingTalk group to discuss .
Pressure test scenario configuration
- 1. High simulation scene arrangement, perfect reproduction of user behavior
Pressure measurement interface entry:
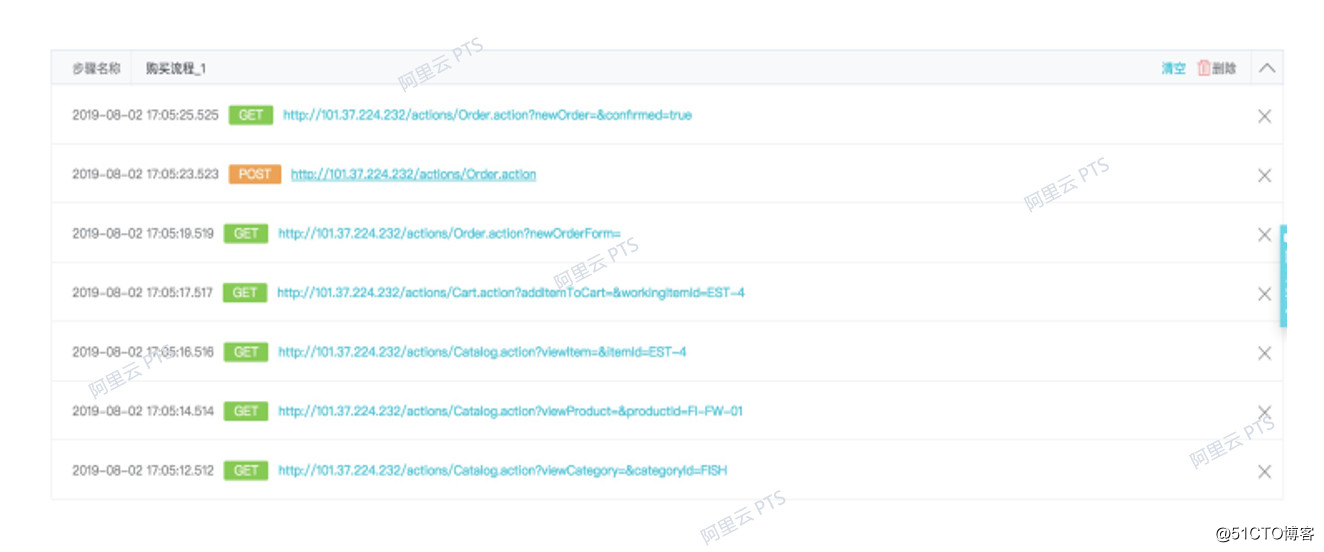
Entering interface information is a very tedious task. There are many interfaces and many parameters are often error-prone. Today we use the cloud recorder provided by PTS to demonstrate how to quickly sort out and enter all the interfaces involved. The principle of the cloud recorder is to configure a network proxy on the local computer or mobile device, and the cloud recorder can obtain all the information requested by the network. The specific recording steps are as follows:
- Configure the network proxy. Please refer to the PTS recorder operating document, so I won’t repeat it here.
- Perform business operations in the browser or App. It is strongly recommended to use the domain name filtering function to avoid recording interfering requests; create a step and note the business name before performing each business operation, instead of sorting out the classification after all operations are recorded (imagine from hundreds of requests Find out which are the login-related requests).
- Select the recorded interface information and import a new scene. Please refer to the PTS recorder operation document, so I won’t repeat it here.
Parameterized processing of form data
This step is actually to separate the scene and the pressure test data. PTS supports common CSV format files and ZIP files containing a CSV file as the data source of the scene. Here is a demonstration of how to log in a virtual user with a user name and password. The settings of other parameters are similar to this, so I will not repeat them.
The first step is to upload the test data we prepared to PTS, and set variable names for each column.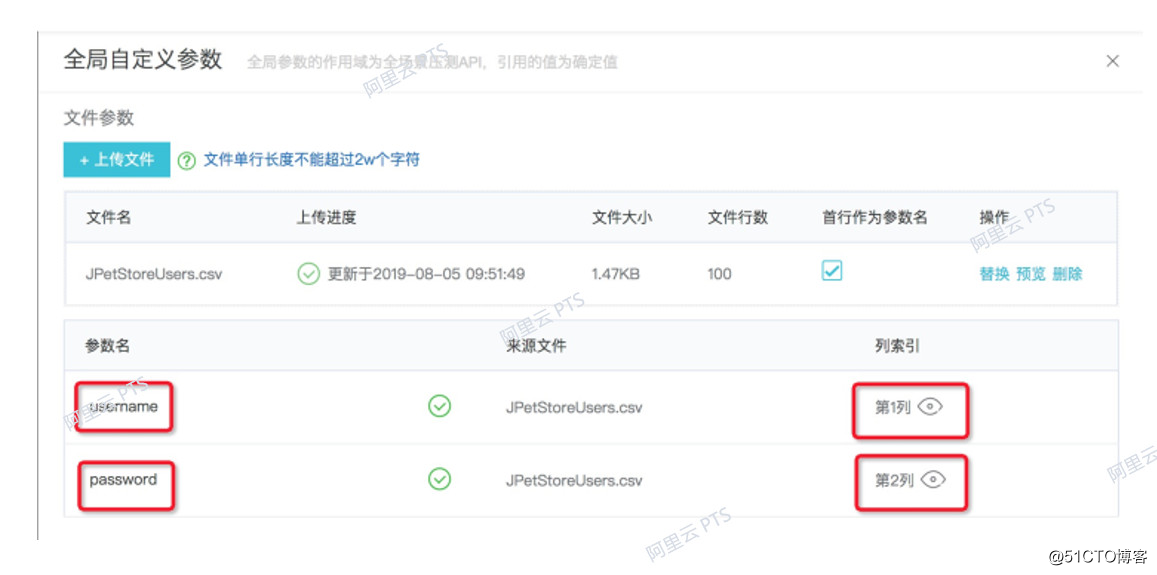
The second step is to edit the login interface and set the value of the username variable and the value of the password variable to the variable name in the file parameter list.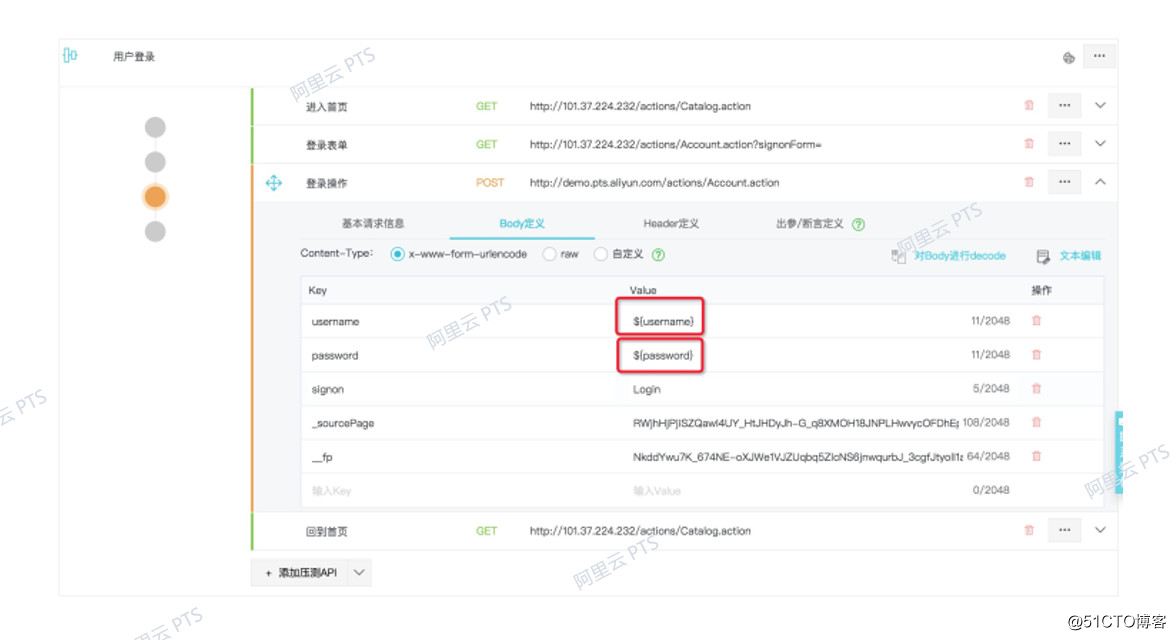
Parameter correlation processing between interfaces
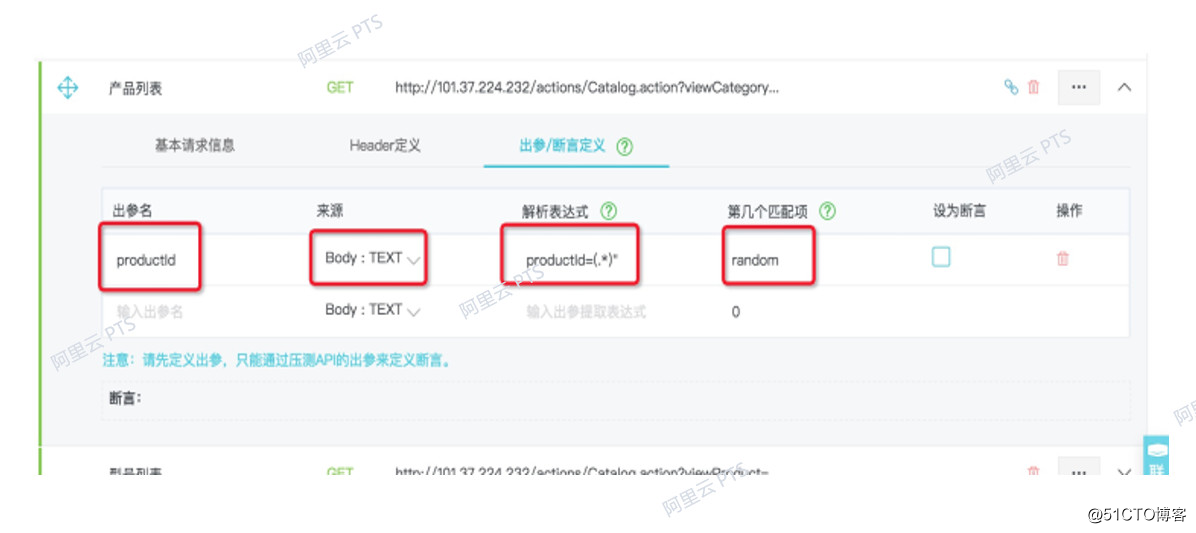
The main function of this step is to extract the variables needed by the subsequent interface from the return content of the preceding interface and pass it to the subsequent interface for use. In the process of scene arrangement, we often encounter very complicated association methods, such as encryption and string interception. You can use system functions and data commands for processing. For details, please refer to the PTS operation document. We demonstrate how to select a product randomly from the product list for purchase.
The first step is to use regular expressions to randomly extract a product ID from the response of the product list interface as the output parameter of the interface.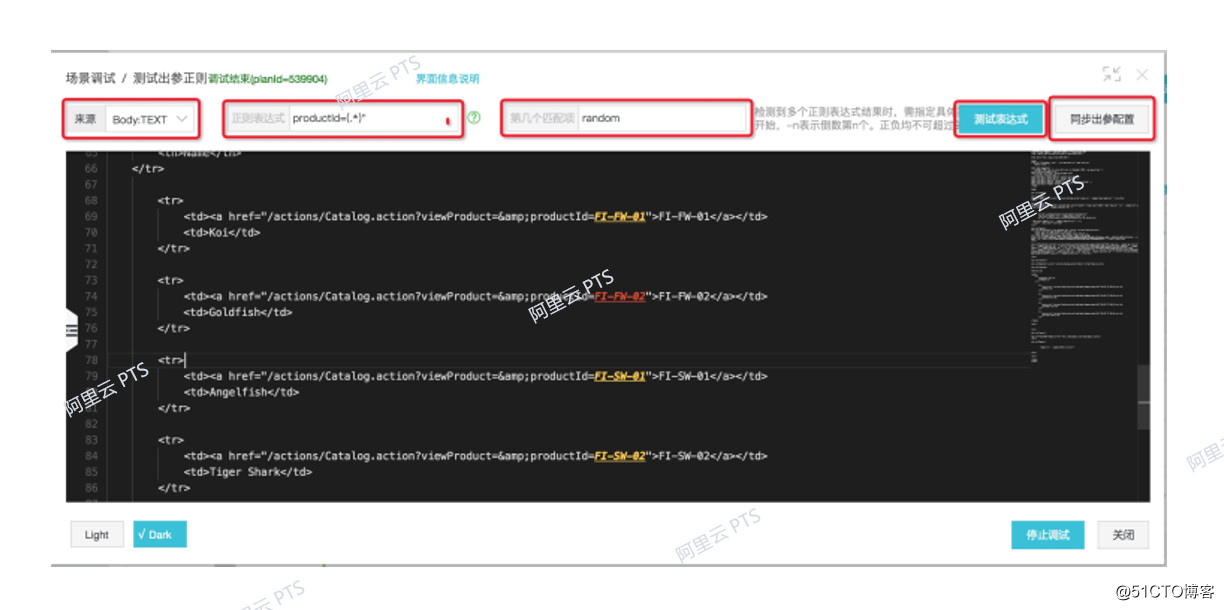
In the second step, in the model list interface, modify the value of the parameter productId to the variable exported in the previous step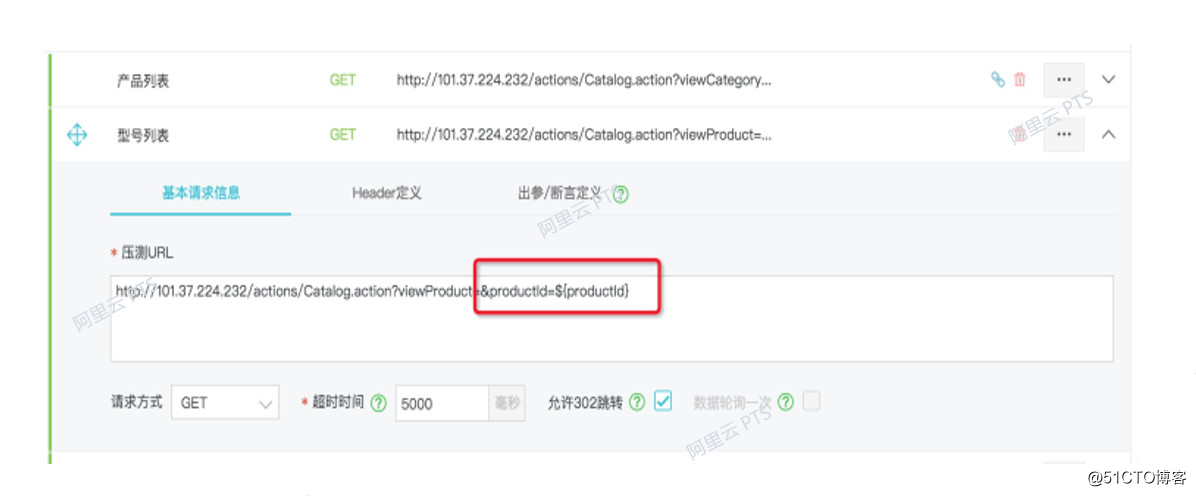
In the third step, the itemId is also configured in a similar manner to configure the parameter association, which realizes the demand of virtual users to purchase goods randomly. The operation process is similar, so I won't repeat it.
Check whether the interface call is successful
. The function of the checkpoint is to ensure that the interface call is successful. The interface configured with the checkpoint has monitoring indicators of the business success rate, which is one of the important channels for discovering server-side problems. PTS supports a variety of complex checkpoints, please refer to the PTS operating document for specific configuration. The following demonstrates how to add a checkpoint to the product list interface to check whether the returned product ID exists.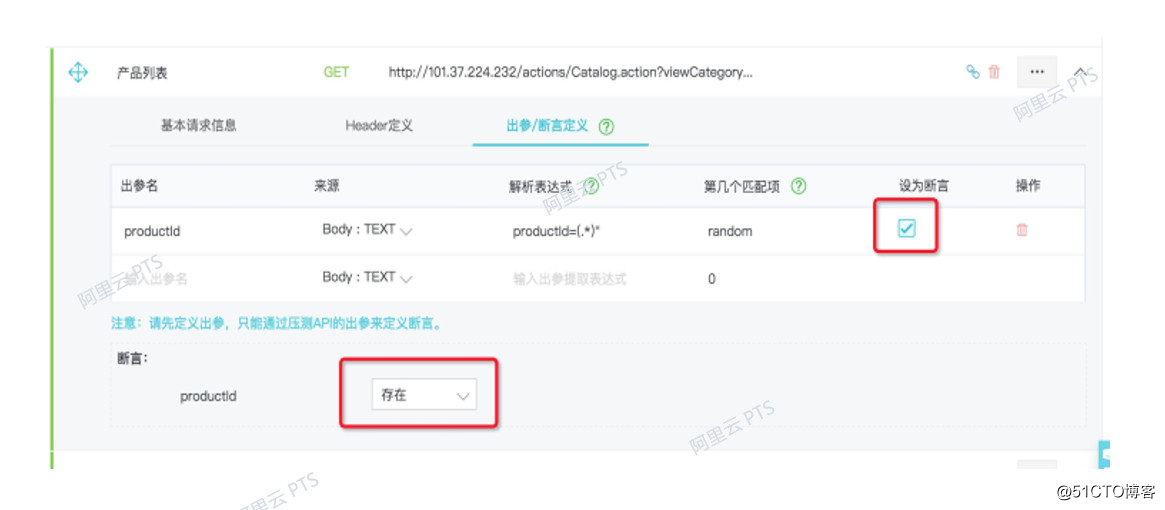
2. Flexible pressure configuration, pressure whatever you want
Pressure parameter configuration
Pressure parameters mainly include pressure source, pressure measurement mode, pressure method, virtual user allocation, etc. According to the previously designed scene model, we can directly configure it.
The first step is to configure information such as target magnitude, pressure source, pressure test duration, IP extension, etc.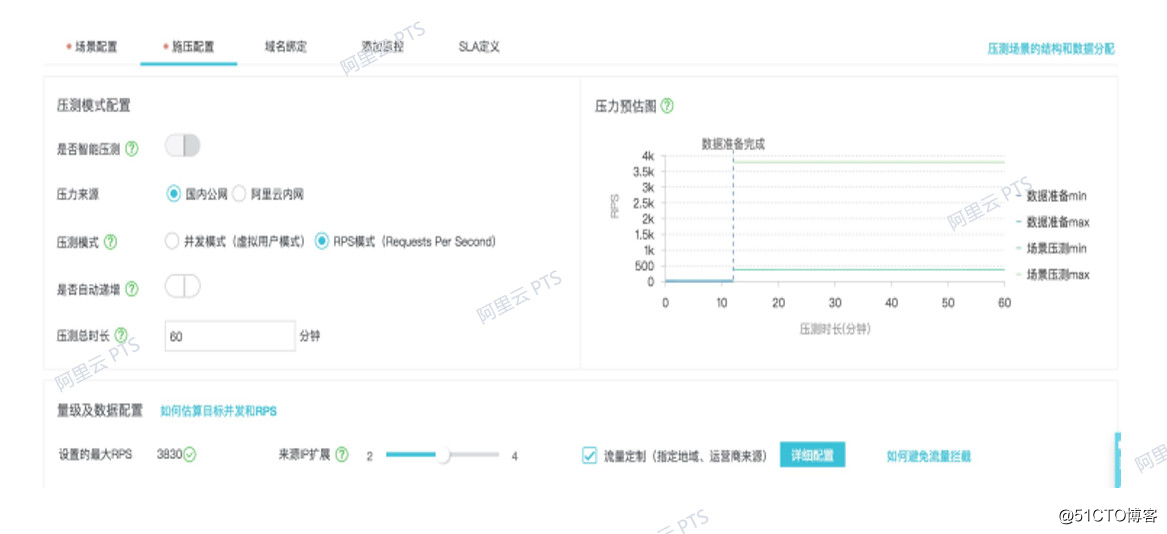
The second step is to configure the distribution ratio of each business target magnitude, which is also the key to the funnel model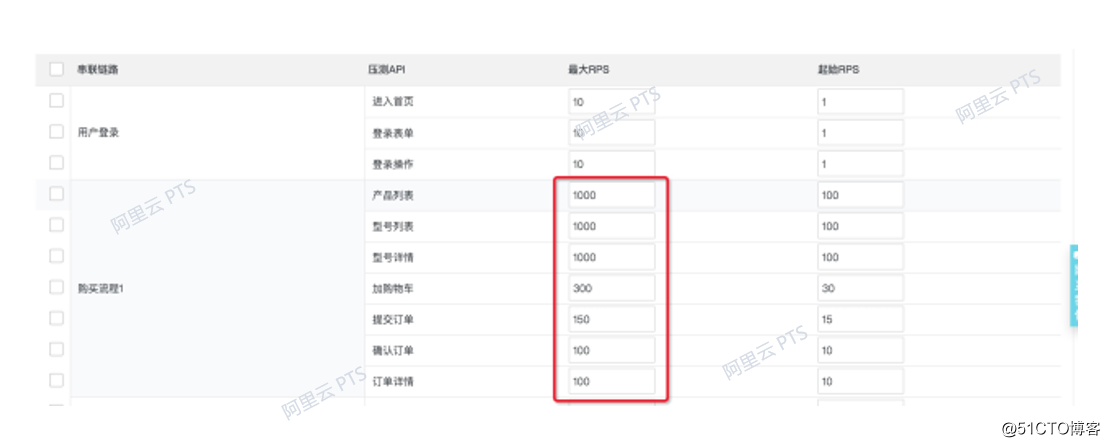
Traffic source customization
PTS supports the customization of IP numbers, domestic public network traffic operators and regions. If you have more complex traffic customization requirements, you can also apply for an exclusive resource pool. Global traffic customization is not a problem.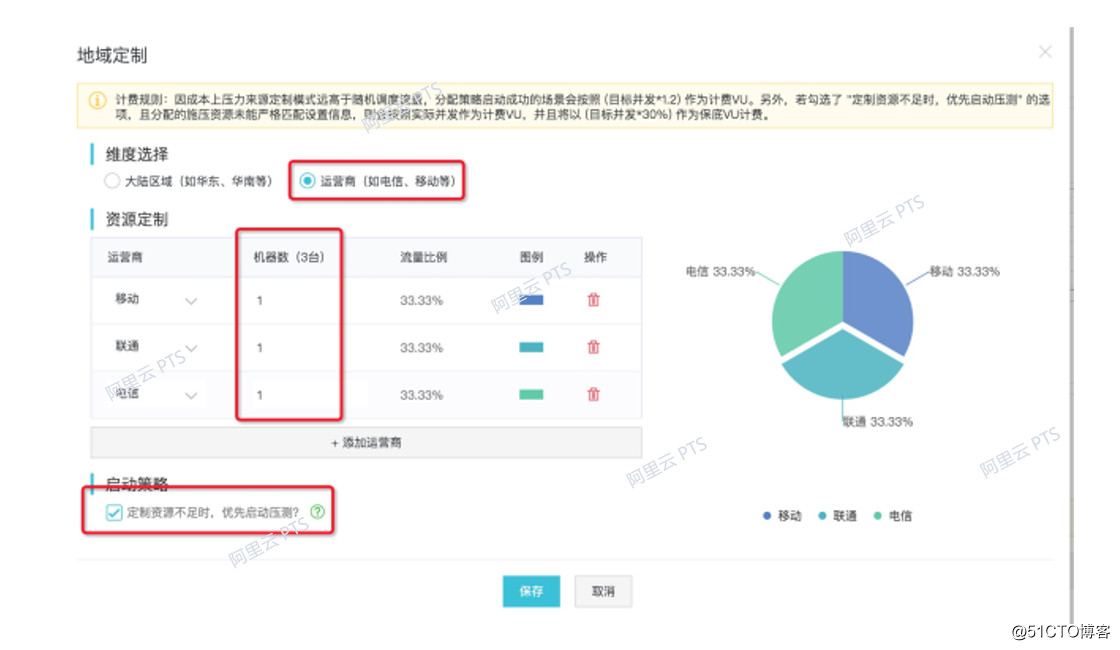
3. Complete real-time monitoring, no bottlenecks can be seen
Monitoring integration & SLA monitoring
PTS supports the addition of cloud monitoring to view various indicators, better guarantee the test premise, record relevant data, and output the final result. If you use Alibaba Cloud basic services (ECS, RDS, SLB), you can easily view the corresponding monitoring data in the stress test and report by adding monitoring methods. If you are not using Alibaba Cloud's basic services, you can also use PTS for pressure.
Combined with our previous architecture diagram, we configure cloud monitoring integration for ECS, SLB, and RDS, and use the PTS monitoring market to conveniently monitor all monitoring indicators.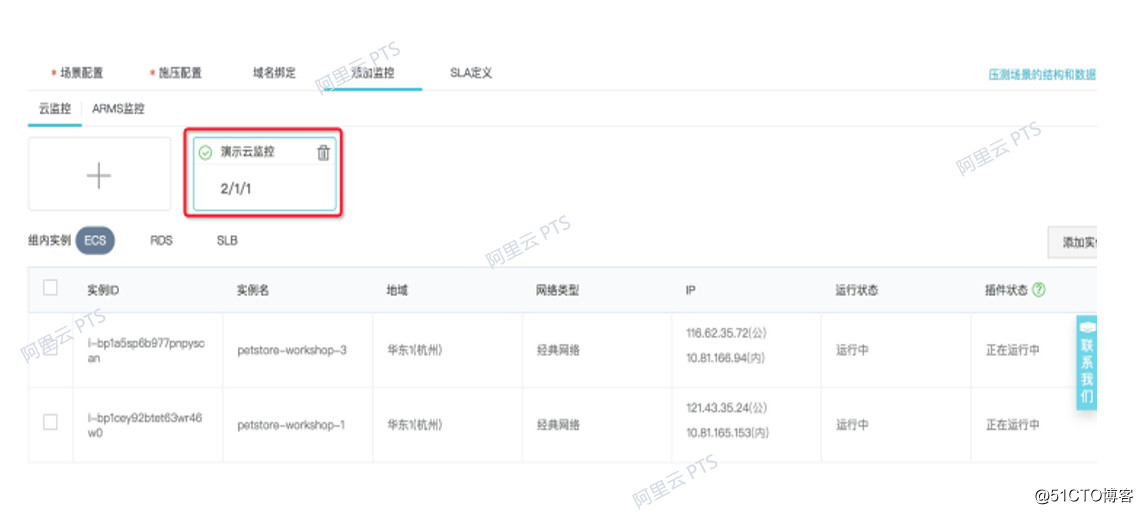
Service level definition SLA (Service Level Agreement) is an important basis for determining whether the service is abnormal. During the stress testing process, by monitoring the SLA indicator data of the core service status, you can more intuitively understand the status of the service under stress testing. PTS supports the definition of common and key SLAs:
service quality related indicators, RT, RPS, success rate;
ECS basic monitoring indicators, CPU utilization, memory utilization, load5;
RDS basic monitoring indicators, CPU utilization, connection utilization ;
SLB basic monitoring indicators, the number of discarded connections, the number of abnormal ECS backends;
We configure SLA monitoring for submitting orders, confirming orders, product details, and shopping cart interfaces, and discover problems in time.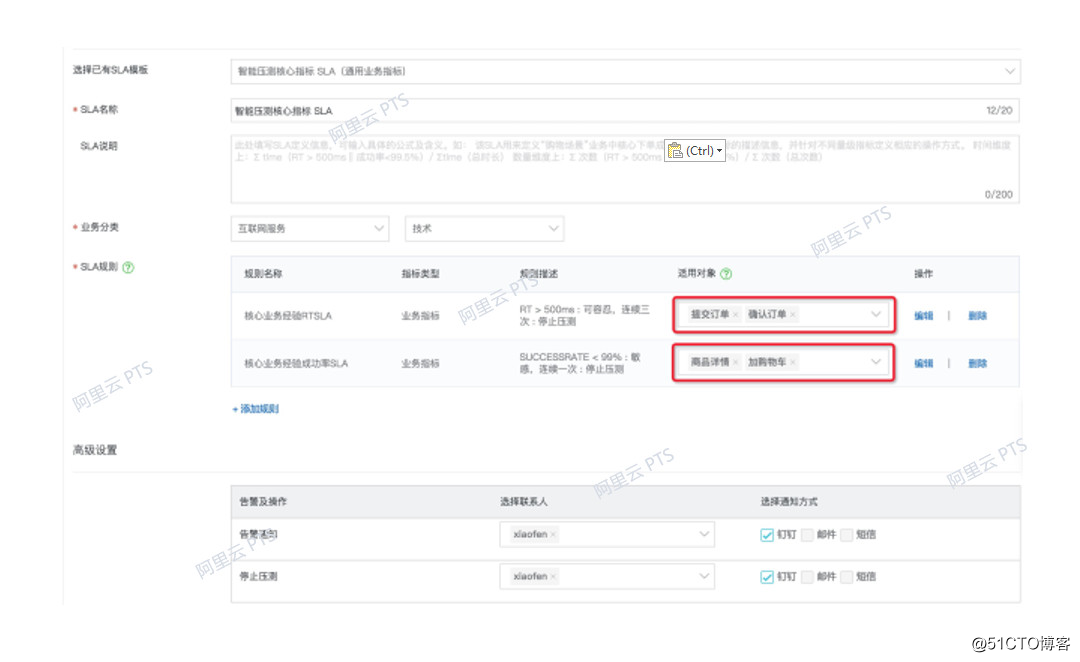
to sum up
This article introduces the common methods and processes for the design and implementation of performance stress testing scenarios, and provides a comparison of scenarios related to the performance of several performance stress testing tools with relatively large audiences. The best practices are the methods and tools that match the actual needs. You can choose the most suitable performance stress testing tool for different needs to implement performance testing.
<EOF>
By the way, I would like to introduce a technical event. For students who are interested in Dubbo, please pay attention. The Dubbo Community Developer Day will be held in Shanghai next week. Students who are interested can sign up for it.