This article address:
https://goodgoodstudy.blog.csdn.net/article/details/108693838
In data analysis, it is often necessary to locate the source of the problem with regard to indicator changes. The first reaction is of course to split. If there is a problem in general, check which sub-module is in addition to the problem.
If the indicator represents an additive total amount, such as the total number of people, total sales, and total clicks, then there is no problem splitting it into each submodule, because the total indicator is equal to the sum of the indicators of each submodule.
But when the indicator is an average value or ratio, the change of the sub-module's indicator may be inconsistent with the overall change, for example, the indicator of the sub-module has risen, but the overall indicator has fallen!
This is Simpson's Paradox .
For example, the number of posts per person per day for an APP = the total number of posts per day / the total number of people . Now that this indicator has fallen , we split it according to the user's mobile phone type: Android client and Apple client, but found that: The average number of posts per person on both clients has increased ? ? ? ?
Why is this? Is the statistics wrong? Or is the calculation formula wrong?

To make it easier for everyone to understand, let me give a more everyday example.
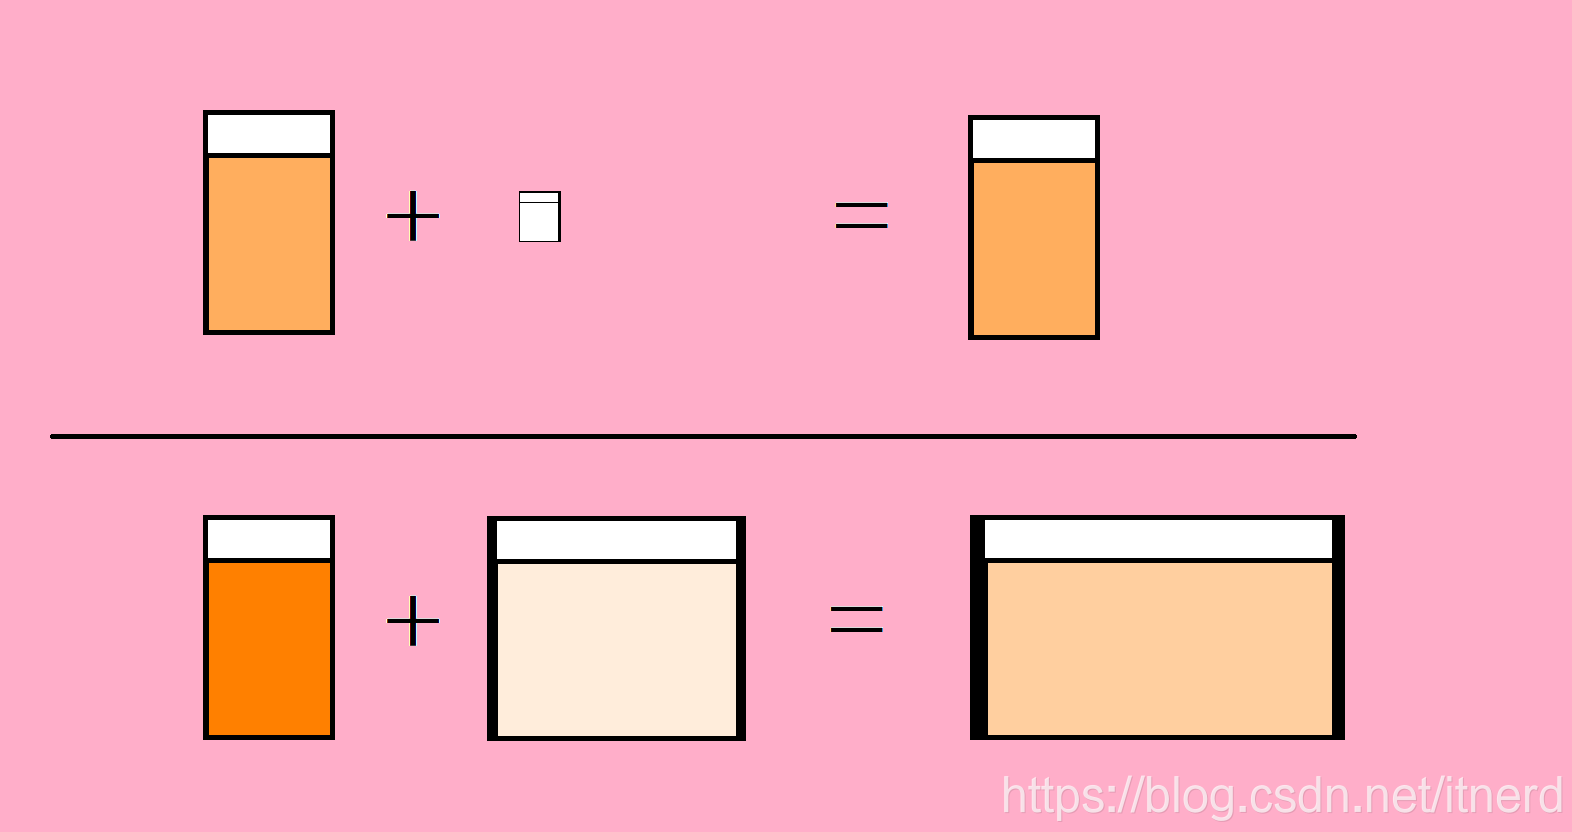
I have a very strong orange juice and a very light orange juice. I mix them together to form a pot of C 1 C1.C 1 orange juice
I have a glass of very strong orange juice, a jug of very light orange juice, mix them together, and turn them into a cylinder with a concentration of C 2 C2C 2 orange juice
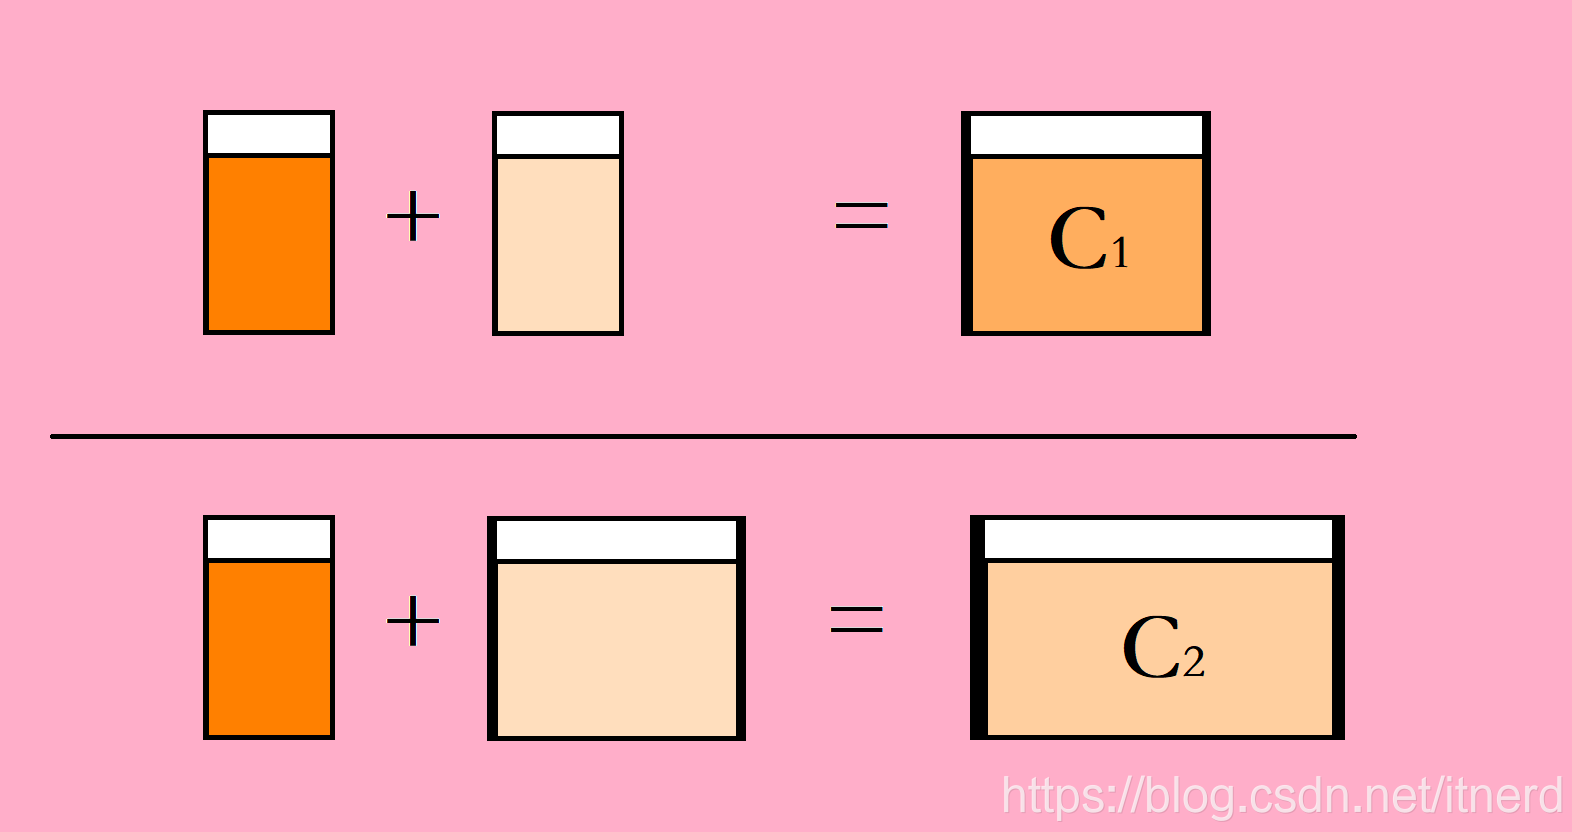
Think about it, everyone, C 1 C_1C1And C 2 C_2C2What about that concentration?
Have you discovered the mystery? The concentration of thick orange juice and light orange juice has not changed, but after mixing together, the total concentration has changed
Corresponding to the scenario of data analysis, the indicators of each sub-module have not changed, but the total indicators have declined. Why? Because the proportion of modules with lower indicators in the sub-modules has become larger, the total indicators have been pulled down .
The following is a more rigorous mathematical formula to illustrate:
Suppose the calculation formula of the total index is:
c ∗ = m ∗ V ∗ c^* = \frac{m^*}{V^*}c∗=V∗m∗
No. iiThe index calculation formula for i sub-modules is:
ci = mi V i c_i = \frac{m_i}{V_i}ci=Vimi
且满足:
m ∗ = ∑ i m i , V ∗ = ∑ i V i m^* = \sum_i m_i, \quad V^* = \sum_i V_i m∗=i∑mi,V∗=i∑Vi
Then the relationship between the total index and the index of each sub-module is:
c ∗ = m ∗ V ∗ = ∑ imi V ∗ = ∑ ici V i V ∗ = ∑ ici ω ic^* = \frac{m^*}{V^* } = \frac{\sum_i m_i}{V^*} = \frac{\sum_i c_i V_i}{V^*} = \sum_i c_i \omega_ic∗=V∗m∗=V∗∑imi=V∗∑iciVi=i∑ciωi
Among them, ω i = V i / V ∗ \ omega_i = V_i / V ^ *ωi=Vi/ V∗ indicates the proportion of the denominator of each sub-module.
It is easy to understand, even if the indicators of each sub-module ci c_iciNo change, the scale of each module accounts for ω i \omega_iωi Changes will also change the total indicators!

So how to understand that the indicators of each sub-module have risen, but the total indicators have fallen?
As an extreme example, take orange juice as an example:
There is a cup of strong juice and a drop of light juice, mixed together, the concentration of this cup of strong juice is almost unchanged
Now the concentration of the thick juice has been slightly increased, and the concentration of the light juice has been slightly increased, but the volume of the light juice has been changed from a drop to a jug. This is good, the juice is all diluted, and the concentration of a jug is obtained. It is lower than the original cup of strong juice.