Hystrix断路器的状态监控
Spring Boot Actuator提供了很多监控端点。在Spring boot应用中,要实现可监控的功能,依赖的是
spring-boot-starter-actuator这个组件。它提供了很多监控和管理你的spring boot应用的HTTP或者JMX端点,并且你可以有选择地开启和关闭部分功能。当你的spring boot应用中引入下面的依赖之后,将自动的拥有审计、健康检查、Metrics监控功能。
具体的使用方法:首先在pom.xml中加入依赖
<dependency>
    <groupId>org.springframework.boot</groupId>
    <artifactId>spring-boot-starter-actuator</artifactId>
</dependency>
Spring Boot2.x之后配置方式和之前有所改变。以前是通过 http://{ip}:{port}/hystrix.stream进行访问 SpringBoot2.x之后可使用http://{ip}:{port}/base-path/{endpoint}的形式访问这些端点,从而了解应用程序的运行状况。这里的base-path默认是/actuator。我们可以从源码中看到。
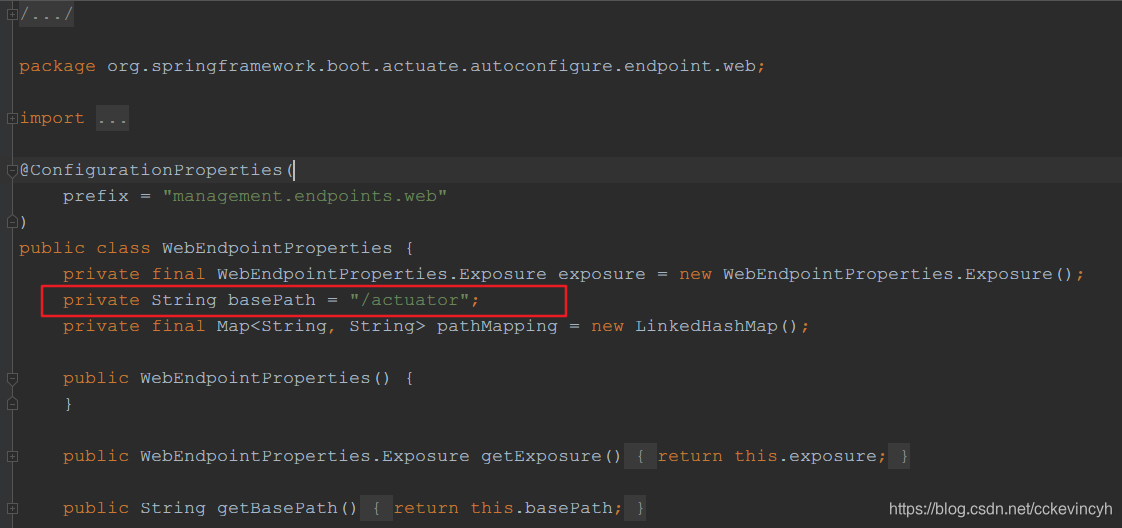
当然我们也可以通过如下的配置修改 base-path
management:
  endpoints:
    web:
      base-path: "/monitor"
Endpoints
actuator 的核心部分,它用来监视应用程序及交互,spring-boot-actuator中已经内置了非常多的 Endpoints(health、info、beans、httptrace、shutdown等等),同时也允许我们自己扩展自己的端点
Spring Boot 2.0 中的端点和之前的版本有较大不同,使用时需注意。另外端点的监控机制也有很大不同,启用了不代表可以直接访问,还需要将其暴露出来,传统的management.security管理已被标记为不推荐。
我们需要加入配置将端点暴露出来。通过下面的配置启用所有的监控端点,默认情况下,这些端点是禁用的;
management:
  endpoints:
    web:
      exposure:
        include: "*"
"*"号代表启用所有的监控端点,可以单独启用,例如,health,info,metrics等。
现在通过actuator/+端点名就可以获取相应的信息。
如果我们不加上上面暴露全部的监控端点,我们启动项目之后访问http://localhost:8762/actuator(项目地址+/actuator),只能看到如下暴露的端点:
{
    "_links": {
        "self": {
            "href": "http://localhost:8762/actuator",
            "templated": false
        },
        "health": {
            "href": "http://localhost:8762/actuator/health",
            "templated": false
        },
        "health-component-instance": {
            "href": "http://localhost:8762/actuator/health/{component}/{instance}",
            "templated": true
        },
        "health-component": {
            "href": "http://localhost:8762/actuator/health/{component}",
            "templated": true
        },
        "info": {
            "href": "http://localhost:8762/actuator/info",
            "templated": false
        }
    }
}
默认只开放了info、health两个端点,剩余的需要自己通过配置management.endpoints.web.exposure.include属性来加载。
当我们加上配置之后,访问http://localhost:8762/actuator(项目地址+/actuator),就可以看到暴露出来更多的端点:
{
    "_links": {
        "self": {
            "href": "http://localhost:8762/actuator",
            "templated": false
        },
        "archaius": {
            "href": "http://localhost:8762/actuator/archaius",
            "templated": false
        },
        "auditevents": {
            "href": "http://localhost:8762/actuator/auditevents",
            "templated": false
        },
        "beans": {
            "href": "http://localhost:8762/actuator/beans",
            "templated": false
        },
        "caches-cache": {
            "href": "http://localhost:8762/actuator/caches/{cache}",
            "templated": true
        },
        "caches": {
            "href": "http://localhost:8762/actuator/caches",
            "templated": false
        },
        "health": {
            "href": "http://localhost:8762/actuator/health",
            "templated": false
        },
        "health-component-instance": {
            "href": "http://localhost:8762/actuator/health/{component}/{instance}",
            "templated": true
        },
        "health-component": {
            "href": "http://localhost:8762/actuator/health/{component}",
            "templated": true
        },
        "conditions": {
            "href": "http://localhost:8762/actuator/conditions",
            "templated": false
        },
        "configprops": {
            "href": "http://localhost:8762/actuator/configprops",
            "templated": false
        },
        "env": {
            "href": "http://localhost:8762/actuator/env",
            "templated": false
        },
        "env-toMatch": {
            "href": "http://localhost:8762/actuator/env/{toMatch}",
            "templated": true
        },
        "info": {
            "href": "http://localhost:8762/actuator/info",
            "templated": false
        },
        "loggers": {
            "href": "http://localhost:8762/actuator/loggers",
            "templated": false
        },
        "loggers-name": {
            "href": "http://localhost:8762/actuator/loggers/{name}",
            "templated": true
        },
        "heapdump": {
            "href": "http://localhost:8762/actuator/heapdump",
            "templated": false
        },
        "threaddump": {
            "href": "http://localhost:8762/actuator/threaddump",
            "templated": false
        },
        "metrics": {
            "href": "http://localhost:8762/actuator/metrics",
            "templated": false
        },
        "metrics-requiredMetricName": {
            "href": "http://localhost:8762/actuator/metrics/{requiredMetricName}",
            "templated": true
        },
        "scheduledtasks": {
            "href": "http://localhost:8762/actuator/scheduledtasks",
            "templated": false
        },
        "httptrace": {
            "href": "http://localhost:8762/actuator/httptrace",
            "templated": false
        },
        "mappings": {
            "href": "http://localhost:8762/actuator/mappings",
            "templated": false
        },
        "refresh": {
            "href": "http://localhost:8762/actuator/refresh",
            "templated": false
        },
        "features": {
            "href": "http://localhost:8762/actuator/features",
            "templated": false
        },
        "service-registry": {
            "href": "http://localhost:8762/actuator/service-registry",
            "templated": false
        }
    }
}
内置Endpoints
我这里只是简单列了一些内置Endpoints,更详细的可以参考下:
Spring Boot 参考指南(端点)
| 端点 | 描述 | Http方法 |
|---|---|---|
| beans | 显示应用程序中所有Spring bean的完整列表 | GET |
| configprops | 显示所有@ConfigurationProperties的配置属性列表 | GET |
| httptrace | 显示HTTP跟踪信息(默认情况下,最后100个HTTP请求-响应交互) | GET |
| env | 从Spring的ConfigurableEnvironment中公开属性 | GET |
| health | 显示应用程序的健康指标 | GET |
| info | 显示应用的信息 | GET |
| mappings | 显示所有 @RequestMapping 路径集列表 | GET |
| metrics | 展示当前应用的 metrics 信息 | GET |
| shutdown | 关闭应用(默认情况下不启用,如需启用,需设置management.endpoint.shutdown.enabled=true) | POST |
| threaddump | 执行一个线程dump | GET |
健康检查
当我们开启health的健康端点时,我们能够查到应用健康信息是一个汇总的信息,访问http://localhost:8762/actuator/health 时,我们获取到的信息是{“status”:“UP”},status的值还有可能是 DOWN。
要想查看详细的应用健康信息需要配置management.endpoint.health.show-details 的值为always.
management.endpoint.health.show-details的值除了always之外还有when-authorized、never,默认值是never。
management:
  endpoints:
    web:
      exposure:
        include: "*"
  endpoint:
    health:
      show-details: always
配置之后我们再次访问http://localhost:8762/actuator/health,获取的信息如下:
{
    "status": "UP",
    "details": {
        "diskSpace": {
            "status": "UP",
            "details": {
                "total": 126712016896,
                "free": 35607068672,
                "threshold": 10485760
            }
        },
        "refreshScope": {
            "status": "UP"
        },
        "discoveryComposite": {
            "status": "UP",
            "details": {
                "discoveryClient": {
                    "status": "UP",
                    "details": {
                        "services": [
                            "cloud-service-member",
                            "cloud-service-order"
                        ]
                    }
                },
                "eureka": {
                    "description": "Remote status from Eureka server",
                    "status": "UP",
                    "details": {
                        "applications": {
                            "CLOUD-SERVICE-MEMBER": 1,
                            "CLOUD-SERVICE-ORDER": 1
                        }
                    }
                }
            }
        },
        "hystrix": {
            "status": "UP"
        }
    }
}
然后我们可以看到hystrix的status
"hystrix": {
    "status": "UP"
}
这里值得注意的是,如果我们发现我们的代码执行了fallback,但此时Hystrix的状态依然是UP,这是因为我们的失败率还没有达到阈值(默认是5秒内20次失败)。执行回退逻辑并不代表断路器已经打开。请求失败、超时、被拒绝以及断路器打开时等都会执行回退逻辑。
Hystrix的监控
当我们添加了spring-boot-starter-actuator依赖之后,就可使用/hystrix.stream端点获得Hystrix的监控信息了。
我们只需要在我们的启动类中加上@EnableCircuitBreaker或@EnableHystrix
并且添加如下依赖:
<dependency>
    <groupId>org.springframework.cloud</groupId>
    <artifactId>spring-cloud-starter-netflix-hystrix</artifactId>
</dependency>
然后我们启动项目,访问http://localhost:8765/actuator/hystrix.stream还有http://localhost:8762/actuator/hystrix.stream
然后我们发现内容都是ping
ping:

ping:

ping:

ping:

ping:

ping:

ping:

ping:

ping:

ping:
我们只需要访问一下我们的服务即可,访问http://localhost:8762/member/orders还有http://localhost:8765/order/members,然后我们继续访问http://localhost:8765/actuator/hystrix.stream还有http://localhost:8762/actuator/hystrix.stream,就可以看到不停重复如下内容:
ping:

data: {"type":"HystrixCommand","name":"OrderFeign#getAllOrderList()","group":"cloud-service-order","currentTime":1568819810783,"isCircuitBreakerOpen":false,"errorPercentage":0,"errorCount":0,"requestCount":0,"rollingCountBadRequests":0,"rollingCountCollapsedRequests":0,"rollingCountEmit":0,"rollingCountExceptionsThrown":0,"rollingCountFailure":0,"rollingCountFallbackEmit":0,"rollingCountFallbackFailure":0,"rollingCountFallbackMissing":0,"rollingCountFallbackRejection":0,"rollingCountFallbackSuccess":0,"rollingCountResponsesFromCache":0,"rollingCountSemaphoreRejected":0,"rollingCountShortCircuited":0,"rollingCountSuccess":0,"rollingCountThreadPoolRejected":0,"rollingCountTimeout":0,"currentConcurrentExecutionCount":0,"rollingMaxConcurrentExecutionCount":0,"latencyExecute_mean":0,"latencyExecute":{"0":0,"25":0,"50":0,"75":0,"90":0,"95":0,"99":0,"99.5":0,"100":0},"latencyTotal_mean":0,"latencyTotal":{"0":0,"25":0,"50":0,"75":0,"90":0,"95":0,"99":0,"99.5":0,"100":0},"propertyValue_circuitBreakerRequestVolumeThreshold":20,"propertyValue_circuitBreakerSleepWindowInMilliseconds":5000,"propertyValue_circuitBreakerErrorThresholdPercentage":50,"propertyValue_circuitBreakerForceOpen":false,"propertyValue_circuitBreakerForceClosed":false,"propertyValue_circuitBreakerEnabled":true,"propertyValue_executionIsolationStrategy":"THREAD","propertyValue_executionIsolationThreadTimeoutInMilliseconds":1000,"propertyValue_executionTimeoutInMilliseconds":1000,"propertyValue_executionIsolationThreadInterruptOnTimeout":true,"propertyValue_executionIsolationThreadPoolKeyOverride":null,"propertyValue_executionIsolationSemaphoreMaxConcurrentRequests":10,"propertyValue_fallbackIsolationSemaphoreMaxConcurrentRequests":10,"propertyValue_metricsRollingStatisticalWindowInMilliseconds":10000,"propertyValue_requestCacheEnabled":true,"propertyValue_requestLogEnabled":true,"reportingHosts":1,"threadPool":"cloud-service-order"}

data: {"type":"HystrixThreadPool","name":"cloud-service-order","currentTime":1568819810783,"currentActiveCount":0,"currentCompletedTaskCount":1,"currentCorePoolSize":10,"currentLargestPoolSize":1,"currentMaximumPoolSize":10,"currentPoolSize":1,"currentQueueSize":0,"currentTaskCount":1,"rollingCountThreadsExecuted":0,"rollingMaxActiveThreads":0,"rollingCountCommandRejections":0,"propertyValue_queueSizeRejectionThreshold":5,"propertyValue_metricsRollingStatisticalWindowInMilliseconds":10000,"reportingHosts":1}
data: {"type":"HystrixCommand","name":"MemberFeign#getAllMemberList()","group":"cloud-service-member","currentTime":1568819800314,"isCircuitBreakerOpen":false,"errorPercentage":0,"errorCount":0,"requestCount":0,"rollingCountBadRequests":0,"rollingCountCollapsedRequests":0,"rollingCountEmit":0,"rollingCountExceptionsThrown":0,"rollingCountFailure":0,"rollingCountFallbackEmit":0,"rollingCountFallbackFailure":0,"rollingCountFallbackMissing":0,"rollingCountFallbackRejection":0,"rollingCountFallbackSuccess":0,"rollingCountResponsesFromCache":0,"rollingCountSemaphoreRejected":0,"rollingCountShortCircuited":0,"rollingCountSuccess":0,"rollingCountThreadPoolRejected":0,"rollingCountTimeout":0,"currentConcurrentExecutionCount":0,"rollingMaxConcurrentExecutionCount":0,"latencyExecute_mean":0,"latencyExecute":{"0":0,"25":0,"50":0,"75":0,"90":0,"95":0,"99":0,"99.5":0,"100":0},"latencyTotal_mean":0,"latencyTotal":{"0":0,"25":0,"50":0,"75":0,"90":0,"95":0,"99":0,"99.5":0,"100":0},"propertyValue_circuitBreakerRequestVolumeThreshold":20,"propertyValue_circuitBreakerSleepWindowInMilliseconds":5000,"propertyValue_circuitBreakerErrorThresholdPercentage":50,"propertyValue_circuitBreakerForceOpen":false,"propertyValue_circuitBreakerForceClosed":false,"propertyValue_circuitBreakerEnabled":true,"propertyValue_executionIsolationStrategy":"THREAD","propertyValue_executionIsolationThreadTimeoutInMilliseconds":1000,"propertyValue_executionTimeoutInMilliseconds":1000,"propertyValue_executionIsolationThreadInterruptOnTimeout":true,"propertyValue_executionIsolationThreadPoolKeyOverride":null,"propertyValue_executionIsolationSemaphoreMaxConcurrentRequests":10,"propertyValue_fallbackIsolationSemaphoreMaxConcurrentRequests":10,"propertyValue_metricsRollingStatisticalWindowInMilliseconds":10000,"propertyValue_requestCacheEnabled":true,"propertyValue_requestLogEnabled":true,"reportingHosts":1,"threadPool":"cloud-service-member"}

data: {"type":"HystrixThreadPool","name":"cloud-service-member","currentTime":1568819800314,"currentActiveCount":0,"currentCompletedTaskCount":1,"currentCorePoolSize":10,"currentLargestPoolSize":1,"currentMaximumPoolSize":10,"currentPoolSize":1,"currentQueueSize":0,"currentTaskCount":1,"rollingCountThreadsExecuted":0,"rollingMaxActiveThreads":0,"rollingCountCommandRejections":0,"propertyValue_queueSizeRejectionThreshold":5,"propertyValue_metricsRollingStatisticalWindowInMilliseconds":10000,"reportingHosts":1}
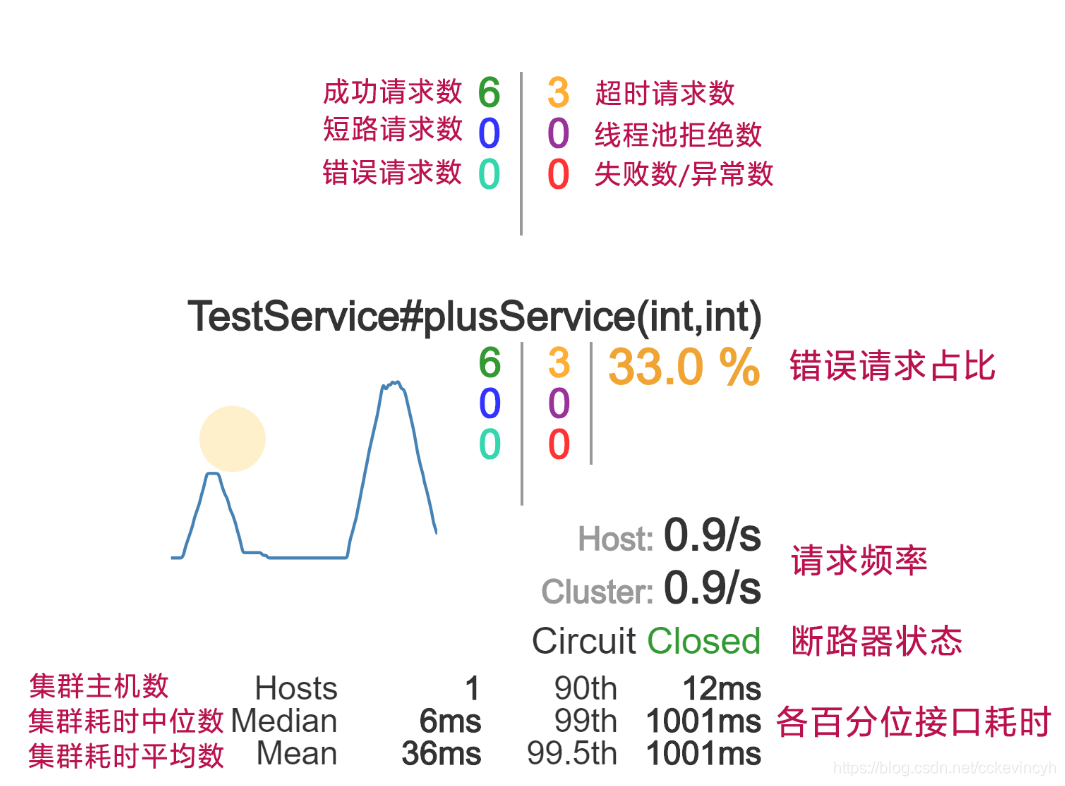
这是因为系统会不断地刷新以获得实时的监控数据。Hystrix的监控指标非常全面,例如HystrixCommand的名称、group名称、断路器状态、错误率、错误数等。
使用Hystrix Dashboard可视化监控数据
前面讨论了Hystrix的监控,但访问/hystrix.stream端点获得的数据是以文字形式展示的。
很难通过这些数据,一眼看出系统当前的运行状态。
可使用Hystrix Dashboard,从让监控数据图形化、可视化。
我们新建一个module,命名为cloud-hystrix-dashboard
然后我们加入hystrix-dashboard的pom依赖:
 <dependencies>
        <dependency>
            <groupId>org.springframework.cloud</groupId>
            <artifactId>spring-cloud-starter-netflix-hystrix-dashboard</artifactId>
        </dependency>
    </dependencies>
spring cloud 2.x之后spring-cloud-starter-hystrix-dashboard和spring-cloud-starter-hystrix都标志为过期。参考:13、如何使用断路器监控Hystrix Dashboard
推荐使用<artifactId>spring-cloud-starter-netflix-hystrix-dashboard</artifactId>
然后加上application.yml的配置
server:
  port: 8766
spring:
  application:
    name: cloud-hystrix-dashboard
最后是启动类上加上@EnableHystrixDashboard注解
package com.cc.cloud;

import org.springframework.boot.SpringApplication;
import org.springframework.boot.autoconfigure.SpringBootApplication;
import org.springframework.cloud.netflix.hystrix.dashboard.EnableHystrixDashboard;

@SpringBootApplication
@EnableHystrixDashboard
public class HystrixDashboard {

    public static void main(String[] args) {
        SpringApplication.run(HystrixDashboard.class, args);
    }
}
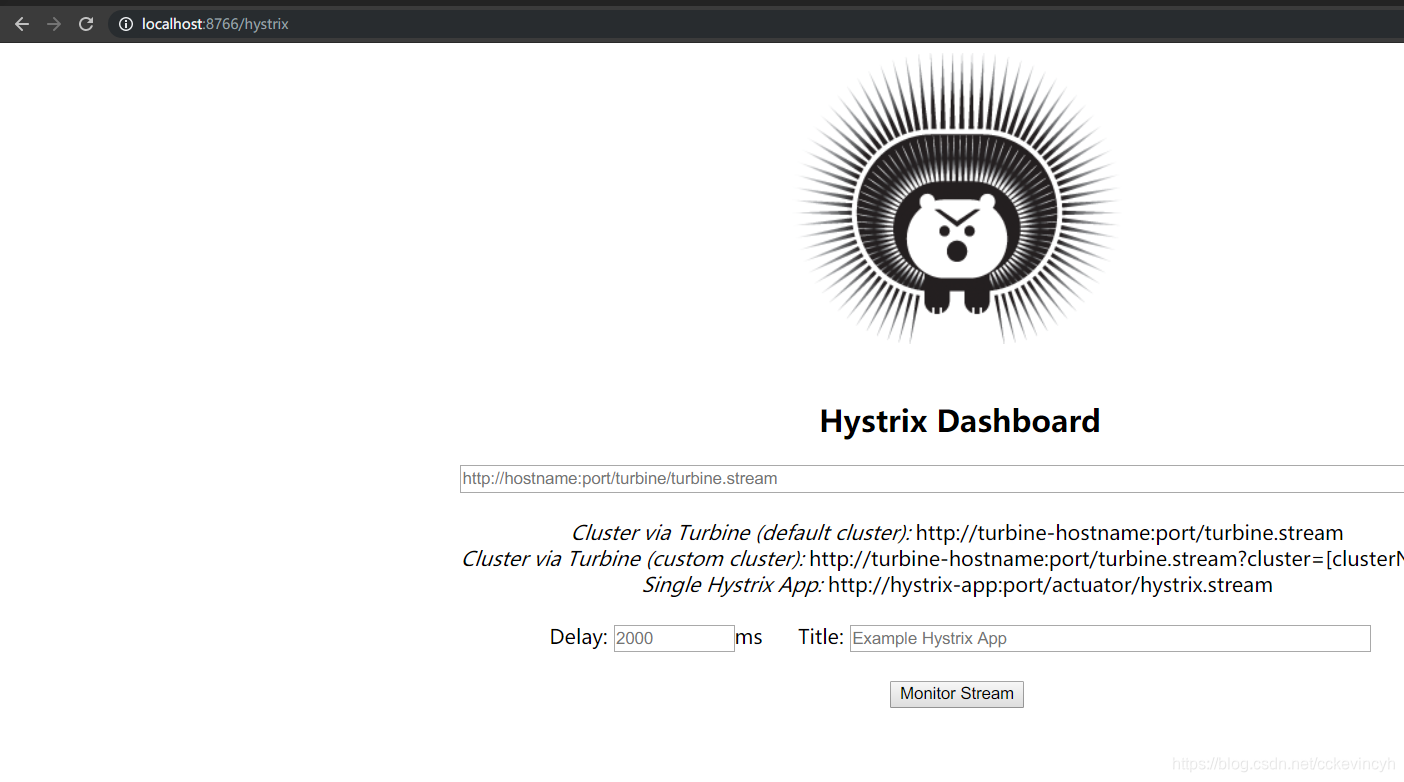
最后启动项目之后访问http://localhost:8766/hystrix即可看到如下画面:
在URL一栏输入http://localhost:8762/actuator/hystrix.stream,随意设置一个Title
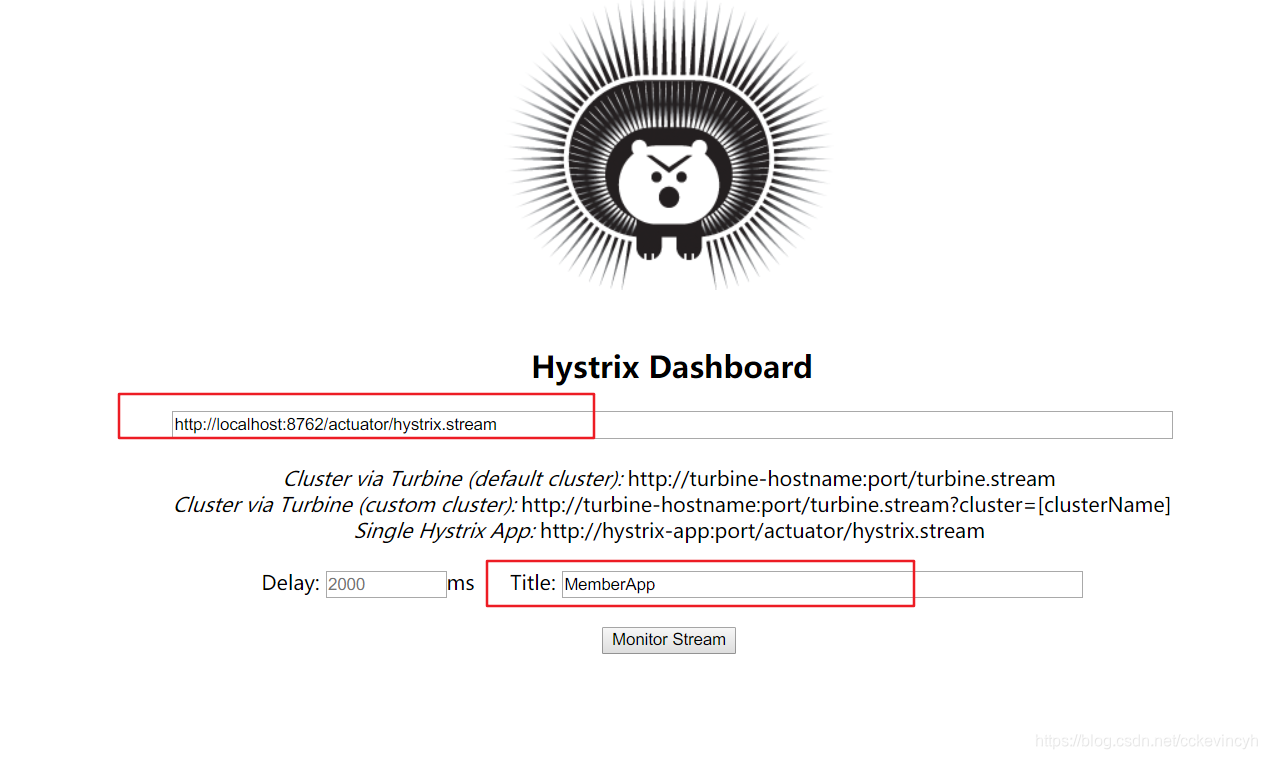
并点击Monitor Stream按钮后,即可看到如下界面。
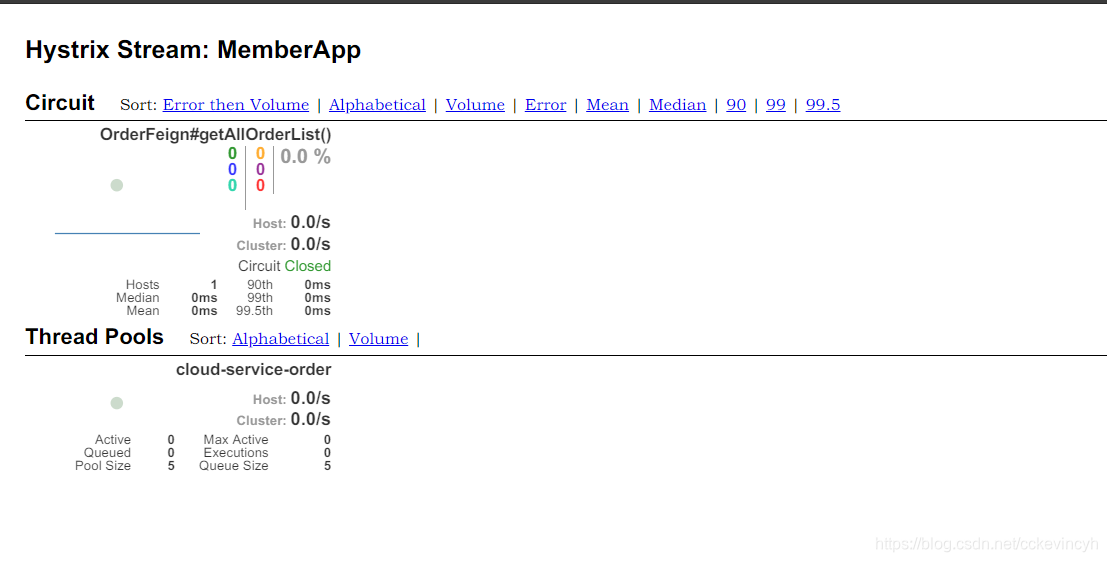
然后我们请求一下:http://localhost:8762/member/orders,可以看到dashboard界面发生了变化。
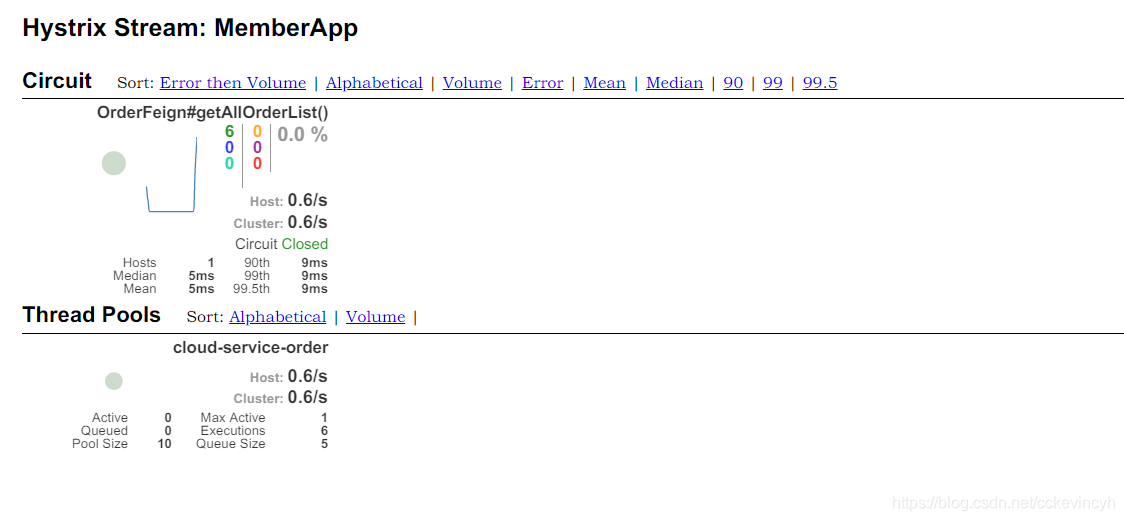
用别人的一个图简单解释一下这个图的含义。参考Spring Cloud 入门教程5、服务容错监控:Hystrix Dashboard,
也可以在最下面的参考中的链接找到相关的资料。
参考
感谢下面的博文或者资料在我学习过程中提供了帮助,感谢~
SpringCloud与Docker微服务架构实战-完整版.pdf
SpringCloud与Docker学习之SpringBoot Actuator介绍
Spring boot 2.0 Actuator 的健康检查
一起来学SpringBoot | 第十四篇:强大的 actuator 服务监控与管理
一起来学SpringBoot | 第十四篇:强大的 actuator 服务监控与管理
spring cloud学习笔记 Spring Boot2.0中Actuator变化
Spring Boot 2.x中的management.security.enabled=false无效问题
Spring Cloud构建微服务架构:服务容错保护(Hystrix服务降级)【Dalston版】
spring boot 2.0.3+spring cloud (Finchley)4、熔断器Hystrix
史上最简单的SpringCloud教程 | 第四篇:断路器(Hystrix)
Spring Cloud(五):Hystrix 监控面板【Finchley 版】
Spring Cloud 入门教程5、服务容错监控:Hystrix Dashboard
13 hystrix dashboard Unable to connect to Command Metric Stream解决办法
源代码
https://gitee.com/cckevincyh/spring-cloud-demo/tree/hystrix-dashboard
