1)项目中作为项目依赖,安装到项目当中(注意必须要结合echars)
npm install echarts vue-echarts--save
npm install echarts-liquidfill --save
2)在需要使用水晶球的组件里引入liquidFill.js
import 'echarts-liquidfill/src/liquidFill.js'; //在这里引入
3)在模板中加入挂载水晶球的DOM节点
 <div id="echarts" :style="{width: '340px', height: '220px',}"></div>

4)在方法methods中添加liquidFill调用方法,如
initWhater() {
var value = this.score
let myChart = this.echarts.init(document.getElementById('myChartWhater'))
var data = []
data.push(value)
data.push(value)
data.push(value)
myChart.setOption({
backgroundColor: 'white', //容器背景颜色
title: {
text: '',
textStyle: {
fontWeight: 'normal',
fontSize: 25,
color: 'rgb(97, 142, 205)'
}
},
series: [
{
type: '
liquidFill',
radius: '80%', //水球的半径
data: data,
backgroundStyle: {
color: 'white'
},
label: {
normal: {
formatter:
(value * 100).toFixed(0) +
'\n' + //换行
'\n' +
this.healthyName, //良好?差?优秀
textStyle: {
fontSize: 50 //字体大小
}
}
},
outline: {
show: true, //是否显示轮廓 布尔值
borderDistance: 0, //外部轮廓与图表的距离 数字
itemStyle: {
borderColor: '#edf2f6', //边框的颜色
borderWidth: 1 //边框的宽度
//shadowBlur: 5 , //外部轮廓的阴影范围 一旦设置了内外都有阴影
//shadowColor: '#000' //外部轮廓的阴影颜色
}
},
color: [
'rgba(118,216,255,0.3)',
'rgba(0,206,255,0.5)',
'rgba(0,148,255,0.3)'
] //水波的颜色 对应的是data里面值
}
]
})
}
})
},
4)在mounted(){}中调用 initWater方法
页面完成效果如: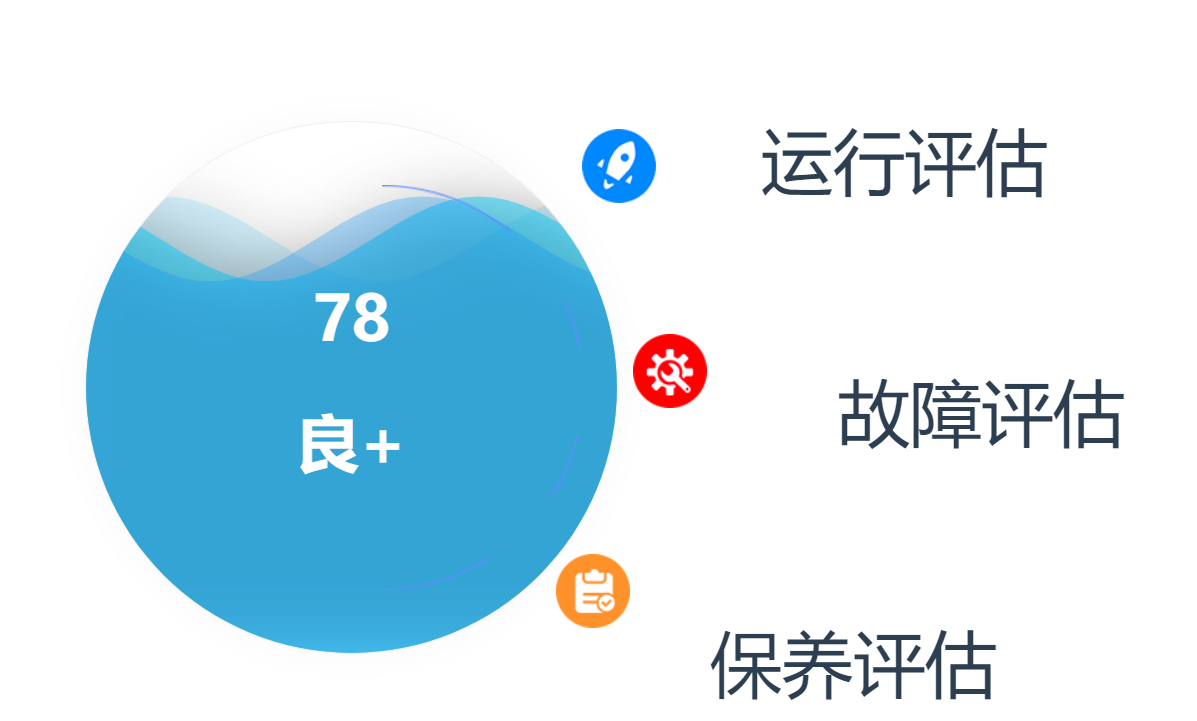
大功告成!!!!