TIPS
本文基于Spring Boot 2.1.4,理论支持Spring Boot 2.x所有版本
众所周知,Spring Boot有个子项目Spring Boot Actuator,它为应用提供了强大的监控能力。从Spring Boot 2.0开始,Actuator将底层改为Micrometer,提供了更强、更灵活的监控能力。Micrometer是一个监控门面,可以类比成监控界的 Slf4j 。
借助Micrometer,应用能够对接各种监控系统,例如:
•AppOptics[1]•Atlas[2]•Datadog[3]•Dynatrace[4]•Elastic[5]•Ganglia[6]•Graphite[7]•Humio[8]•Influx[9]•JMX[10]•KairosDB[11]•New Relic[12]•Prometheus[13]•SignalFx[14]•Simple (in-memory)[15]•StatsD[16]•Wavefront[17]
下面演示如何对接 Prometheus ,并使用 Grafana 实现数据的可视化。
TIPS
童鞋们对Prometheus或Grafana不熟悉也没关系,本文是手把手文章,按步骤操作即可。
编码
编写代码
1 加依赖
<dependency>
  <groupId>org.springframework.boot</groupId>
  <artifactId>spring-boot-starter-actuator</artifactId>
</dependency>
<dependency>
  <groupId>io.micrometer</groupId>
  <artifactId>micrometer-registry-prometheus</artifactId>
</dependency>
这里,我们为应用引入了 micrometer-registry-prometheus ,事实上,你想对接上文列表中的哪款监控系统,就写啥。例如想对接 Influx ,则需添加依赖 micrometer-registry-influx 。
2 写配置
server:
  port: 8080
spring:
  application:
    name: prometheus-test
management:
  endpoints:
    web:
      exposure:
        include: 'prometheus'
  metrics:
    tags:
      application: ${spring.application.name}
如配置所示,指定应用名为 prometheus-test ,并将 Actuator 的 /actuator/prometheus 端点暴露出来;management.metrics.tags.application=prometheus-test 作用是为指标设置一个名为application="prometheus-test" 的Tag,Tag是Prometheus提供的一种能力,从而实现更加灵活的筛选。
测试
1 启动应用
2 访问 http://localhost:8080/actuator/prometheus 可获得类似如下的结果:
# HELP jvm_memory_used_bytes The amount of used memory
# TYPE jvm_memory_used_bytes gauge
jvm_memory_used_bytes{application="prometheus-test",area="heap",id="PS Old Gen",} 2.1193976E7
jvm_memory_used_bytes{application="prometheus-test",area="nonheap",id="Metaspace",} 3.8791688E7
jvm_memory_used_bytes{application="prometheus-test",area="heap",id="PS Survivor Space",} 0.0
jvm_memory_used_bytes{application="prometheus-test",area="nonheap",id="Compressed Class Space",} 5303976.0
jvm_memory_used_bytes{application="prometheus-test",area="heap",id="PS Eden Space",} 8.2574816E7
jvm_memory_used_bytes{application="prometheus-test",area="nonheap",id="Code Cache",} 8693824.0
# HELP tomcat_global_received_bytes_total
# TYPE tomcat_global_received_bytes_total counter
tomcat_global_received_bytes_total{application="prometheus-test",name="http-nio-8080",} 0.0
# HELP jvm_threads_daemon_threads The current number of live daemon threads
# TYPE jvm_threads_daemon_threads gauge
jvm_threads_daemon_threads{application="prometheus-test",} 20.0
# HELP tomcat_sessions_alive_max_seconds
# TYPE tomcat_sessions_alive_max_seconds gauge
tomcat_sessions_alive_max_seconds{application="prometheus-test",} 0.0
# HELP jvm_buffer_memory_used_bytes An estimate of the memory that the Java virtual machine is using for this buffer pool
# TYPE jvm_buffer_memory_used_bytes gauge
jvm_buffer_memory_used_bytes{application="prometheus-test",id="mapped",} 0.0
jvm_buffer_memory_used_bytes{application="prometheus-test",id="direct",} 90112.0
# HELP jvm_threads_states_threads The current number of threads having NEW state
# TYPE jvm_threads_states_threads gauge
jvm_threads_states_threads{application="prometheus-test",state="runnable",} 9.0
jvm_threads_states_threads{application="prometheus-test",state="new",} 0.0
jvm_threads_states_threads{application="prometheus-test",state="terminated",} 0.0
jvm_threads_states_threads{application="prometheus-test",state="blocked",} 0.0
jvm_threads_states_threads{application="prometheus-test",state="waiting",} 12.0
jvm_threads_states_threads{application="prometheus-test",state="timed-waiting",} 3.0
# HELP process_cpu_usage The "recent cpu usage" for the Java Virtual Machine process
# TYPE process_cpu_usage gauge
process_cpu_usage{application="prometheus-test",} 0.0030590633504868434
# HELP logback_events_total Number of error level events that made it to the logs
# TYPE logback_events_total counter
logback_events_total{application="prometheus-test",level="info",} 7.0
logback_events_total{application="prometheus-test",level="warn",} 0.0
logback_events_total{application="prometheus-test",level="trace",} 0.0
logback_events_total{application="prometheus-test",level="debug",} 0.0
logback_events_total{application="prometheus-test",level="error",} 0.0
# HELP tomcat_global_sent_bytes_total
# TYPE tomcat_global_sent_bytes_total counter
tomcat_global_sent_bytes_total{application="prometheus-test",name="http-nio-8080",} 195356.0
# HELP process_files_max_files The maximum file descriptor count
# TYPE process_files_max_files gauge
process_files_max_files{application="prometheus-test",} 10240.0
# HELP tomcat_threads_busy_threads
# TYPE tomcat_threads_busy_threads gauge
tomcat_threads_busy_threads{application="prometheus-test",name="http-nio-8080",} 1.0
# HELP process_files_open_files The open file descriptor count
# TYPE process_files_open_files gauge
process_files_open_files{application="prometheus-test",} 101.0
# HELP tomcat_sessions_active_current_sessions
# TYPE tomcat_sessions_active_current_sessions gauge
tomcat_sessions_active_current_sessions{application="prometheus-test",} 0.0
# HELP jvm_classes_unloaded_classes_total The total number of classes unloaded since the Java virtual machine has started execution
# TYPE jvm_classes_unloaded_classes_total counter
jvm_classes_unloaded_classes_total{application="prometheus-test",} 2.0
# HELP jvm_memory_committed_bytes The amount of memory in bytes that is committed for the Java virtual machine to use
# TYPE jvm_memory_committed_bytes gauge
jvm_memory_committed_bytes{application="prometheus-test",area="heap",id="PS Old Gen",} 1.5466496E8
jvm_memory_committed_bytes{application="prometheus-test",area="nonheap",id="Metaspace",} 4.1418752E7
jvm_memory_committed_bytes{application="prometheus-test",area="heap",id="PS Survivor Space",} 1.6252928E7
jvm_memory_committed_bytes{application="prometheus-test",area="nonheap",id="Compressed Class Space",} 5767168.0
jvm_memory_committed_bytes{application="prometheus-test",area="heap",id="PS Eden Space",} 1.73539328E8
jvm_memory_committed_bytes{application="prometheus-test",area="nonheap",id="Code Cache",} 8716288.0
# HELP http_server_requests_seconds
# TYPE http_server_requests_seconds summary
http_server_requests_seconds_count{application="prometheus-test",exception="None",method="GET",outcome="SUCCESS",status="200",uri="/actuator/prometheus",} 16.0
http_server_requests_seconds_sum{application="prometheus-test",exception="None",method="GET",outcome="SUCCESS",status="200",uri="/actuator/prometheus",} 0.326299973
http_server_requests_seconds_count{application="prometheus-test",exception="None",method="GET",outcome="SUCCESS",status="200",uri="/**/favicon.ico",} 3.0
http_server_requests_seconds_sum{application="prometheus-test",exception="None",method="GET",outcome="SUCCESS",status="200",uri="/**/favicon.ico",} 0.028434427
# HELP http_server_requests_seconds_max
# TYPE http_server_requests_seconds_max gauge
http_server_requests_seconds_max{application="prometheus-test",exception="None",method="GET",outcome="SUCCESS",status="200",uri="/actuator/prometheus",} 0.120627904
http_server_requests_seconds_max{application="prometheus-test",exception="None",method="GET",outcome="SUCCESS",status="200",uri="/**/favicon.ico",} 0.015596512
# HELP tomcat_global_error_total
# TYPE tomcat_global_error_total counter
tomcat_global_error_total{application="prometheus-test",name="http-nio-8080",} 0.0
# HELP jvm_gc_max_data_size_bytes Max size of old generation memory pool
# TYPE jvm_gc_max_data_size_bytes gauge
jvm_gc_max_data_size_bytes{application="prometheus-test",} 2.863661056E9
# HELP jvm_gc_live_data_size_bytes Size of old generation memory pool after a full GC
# TYPE jvm_gc_live_data_size_bytes gauge
jvm_gc_live_data_size_bytes{application="prometheus-test",} 2.1193976E7
# HELP system_load_average_1m The sum of the number of runnable entities queued to available processors and the number of runnable entities running on the available processors averaged over a period of time
# TYPE system_load_average_1m gauge
system_load_average_1m{application="prometheus-test",} 3.9423828125
# HELP process_uptime_seconds The uptime of the Java virtual machine
# TYPE process_uptime_seconds gauge
process_uptime_seconds{application="prometheus-test",} 173.424
# HELP tomcat_sessions_expired_sessions_total
# TYPE tomcat_sessions_expired_sessions_total counter
tomcat_sessions_expired_sessions_total{application="prometheus-test",} 0.0
# HELP jvm_gc_pause_seconds Time spent in GC pause
# TYPE jvm_gc_pause_seconds summary
jvm_gc_pause_seconds_count{action="end of minor GC",application="prometheus-test",cause="Metadata GC Threshold",} 1.0
jvm_gc_pause_seconds_sum{action="end of minor GC",application="prometheus-test",cause="Metadata GC Threshold",} 0.012
jvm_gc_pause_seconds_count{action="end of major GC",application="prometheus-test",cause="Metadata GC Threshold",} 1.0
jvm_gc_pause_seconds_sum{action="end of major GC",application="prometheus-test",cause="Metadata GC Threshold",} 0.045
# HELP jvm_gc_pause_seconds_max Time spent in GC pause
# TYPE jvm_gc_pause_seconds_max gauge
jvm_gc_pause_seconds_max{action="end of minor GC",application="prometheus-test",cause="Metadata GC Threshold",} 0.012
jvm_gc_pause_seconds_max{action="end of major GC",application="prometheus-test",cause="Metadata GC Threshold",} 0.045
# HELP jvm_gc_memory_promoted_bytes_total Count of positive increases in the size of the old generation memory pool before GC to after GC
# TYPE jvm_gc_memory_promoted_bytes_total counter
jvm_gc_memory_promoted_bytes_total{application="prometheus-test",} 1.06878E7
# HELP jvm_gc_memory_allocated_bytes_total Incremented for an increase in the size of the young generation memory pool after one GC to before the next
# TYPE jvm_gc_memory_allocated_bytes_total counter
jvm_gc_memory_allocated_bytes_total{application="prometheus-test",} 7.8713648E7
# HELP tomcat_global_request_seconds
# TYPE tomcat_global_request_seconds summary
tomcat_global_request_seconds_count{application="prometheus-test",name="http-nio-8080",} 19.0
tomcat_global_request_seconds_sum{application="prometheus-test",name="http-nio-8080",} 0.432
# HELP jvm_threads_live_threads The current number of live threads including both daemon and non-daemon threads
# TYPE jvm_threads_live_threads gauge
jvm_threads_live_threads{application="prometheus-test",} 24.0
# HELP jvm_buffer_count_buffers An estimate of the number of buffers in the pool
# TYPE jvm_buffer_count_buffers gauge
jvm_buffer_count_buffers{application="prometheus-test",id="mapped",} 0.0
jvm_buffer_count_buffers{application="prometheus-test",id="direct",} 11.0
# HELP process_start_time_seconds Start time of the process since unix epoch.
# TYPE process_start_time_seconds gauge
process_start_time_seconds{application="prometheus-test",} 1.556017153576E9
# HELP tomcat_threads_config_max_threads
# TYPE tomcat_threads_config_max_threads gauge
tomcat_threads_config_max_threads{application="prometheus-test",name="http-nio-8080",} 200.0
# HELP system_cpu_count The number of processors available to the Java virtual machine
# TYPE system_cpu_count gauge
system_cpu_count{application="prometheus-test",} 8.0
# HELP tomcat_threads_current_threads
# TYPE tomcat_threads_current_threads gauge
tomcat_threads_current_threads{application="prometheus-test",name="http-nio-8080",} 10.0
# HELP jvm_memory_max_bytes The maximum amount of memory in bytes that can be used for memory management
# TYPE jvm_memory_max_bytes gauge
jvm_memory_max_bytes{application="prometheus-test",area="heap",id="PS Old Gen",} 2.863661056E9
jvm_memory_max_bytes{application="prometheus-test",area="nonheap",id="Metaspace",} -1.0
jvm_memory_max_bytes{application="prometheus-test",area="heap",id="PS Survivor Space",} 1.6252928E7
jvm_memory_max_bytes{application="prometheus-test",area="nonheap",id="Compressed Class Space",} 1.073741824E9
jvm_memory_max_bytes{application="prometheus-test",area="heap",id="PS Eden Space",} 1.395654656E9
jvm_memory_max_bytes{application="prometheus-test",area="nonheap",id="Code Cache",} 2.5165824E8
# HELP jvm_threads_peak_threads The peak live thread count since the Java virtual machine started or peak was reset
# TYPE jvm_threads_peak_threads gauge
jvm_threads_peak_threads{application="prometheus-test",} 29.0
# HELP jvm_classes_loaded_classes The number of classes that are currently loaded in the Java virtual machine
# TYPE jvm_classes_loaded_classes gauge
jvm_classes_loaded_classes{application="prometheus-test",} 7936.0
# HELP tomcat_sessions_active_max_sessions
# TYPE tomcat_sessions_active_max_sessions gauge
tomcat_sessions_active_max_sessions{application="prometheus-test",} 0.0
# HELP tomcat_global_request_max_seconds
# TYPE tomcat_global_request_max_seconds gauge
tomcat_global_request_max_seconds{application="prometheus-test",name="http-nio-8080",} 0.161
# HELP tomcat_sessions_created_sessions_total
# TYPE tomcat_sessions_created_sessions_total counter
tomcat_sessions_created_sessions_total{application="prometheus-test",} 0.0
# HELP tomcat_sessions_rejected_sessions_total
# TYPE tomcat_sessions_rejected_sessions_total counter
tomcat_sessions_rejected_sessions_total{application="prometheus-test",} 0.0
# HELP jvm_buffer_total_capacity_bytes An estimate of the total capacity of the buffers in this pool
# TYPE jvm_buffer_total_capacity_bytes gauge
jvm_buffer_total_capacity_bytes{application="prometheus-test",id="mapped",} 0.0
jvm_buffer_total_capacity_bytes{application="prometheus-test",id="direct",} 90112.0
# HELP system_cpu_usage The "recent cpu usage" for the whole system
# TYPE system_cpu_usage gauge
system_cpu_usage{application="prometheus-test",} 0.2523364485981308
该端点返回的数据结构是Prometheus需要使用的。对照注释,相信大家能看懂每一项的含义。例如:
# HELP jvm_memory_used_bytes The amount of used memory
# TYPE jvm_memory_used_bytes gauge
jvm_memory_used_bytes{application="prometheus-test",area="heap",id="PS Old Gen",} 2.1193976E7表示:prometheus-test 应用堆内存中的 PS Old Gen 区域占用的空间是 2.1193976E7字节。
对接Prometheus
Prometheus是一款开源的监控 + 时序数据库 + 报警软件,由SoundCloud公司开发的。目前在CNCF基金会托管,并已成功孵化。
官方网站
•Prometheus官方网站[18]•Prometheus GitHub[19]
安装Prometheus
TIPS
简单期间,本文使用Docker方式安装,其他方式安装请详见 Prometheus安装说明[20]。
1 准备配置文件,命名为prometheus.yml
scrape_configs:
# 任意写,建议英文,不要包含特殊字符
- job_name: 'spring'
  # 多久采集一次数据
  scrape_interval: 15s
  # 采集时的超时时间
  scrape_timeout: 10s
  # 采集的路径是啥
  metrics_path: '/actuator/prometheus'
  # 采集服务的地址,设置成上面Spring Boot应用所在服务器的具体地址。
  static_configs:
  - targets: ['30.1.229.89:8080']
这样配置后,Prometheus服务器就会自动每隔15秒请求 http://30.1.229.89:8080/actuator/prometheus 。更多配置项详见 Prometheus Configuration官方文档[21]
2 在prometheus.yml 文件所在目录执行如下命令,即可启动Prometheus
docker run -d -p 9090:9090 \
    -v $(pwd)/prometheus.yml:/etc/prometheus/prometheus.yml \
    prom/prometheus --config.file=/etc/prometheus/prometheus.yml
测试
1 访问http://localhost:9090 ,可看到类似如下的界面

2 点击 Insert metric at cursor ,即可选择监控指标;点击 Graph ,即可让指标以图表方式展示;点击Execute 按钮,即可看到类似下图的结果:

Grafana可视化
至此,已经用Prometheus实现了监控数据的可视化,然而使用体验并不好。下面来用Grafana实现更友好、更贴近生产的监控可视化。
Grafana是一个开源的跨平台度量分析和可视化 + 告警工具。
官方网站
•Grafana官方网站[22]•Grafana GitHub[23]
安装Grafana
TIPS
简单期间,本文使用Docker方式安装,其他方式安装请详见 Grafana安装说明[24] 。
启动
docker run -d -p 3000:3000 grafana/grafana配置
1 登录:访问 http://localhost:3000/login ,初始账号/密码为:admin/admin ,登录后,即可看到类似如下的界面

2 点击Add data source ,即可看到类似如下的界面:
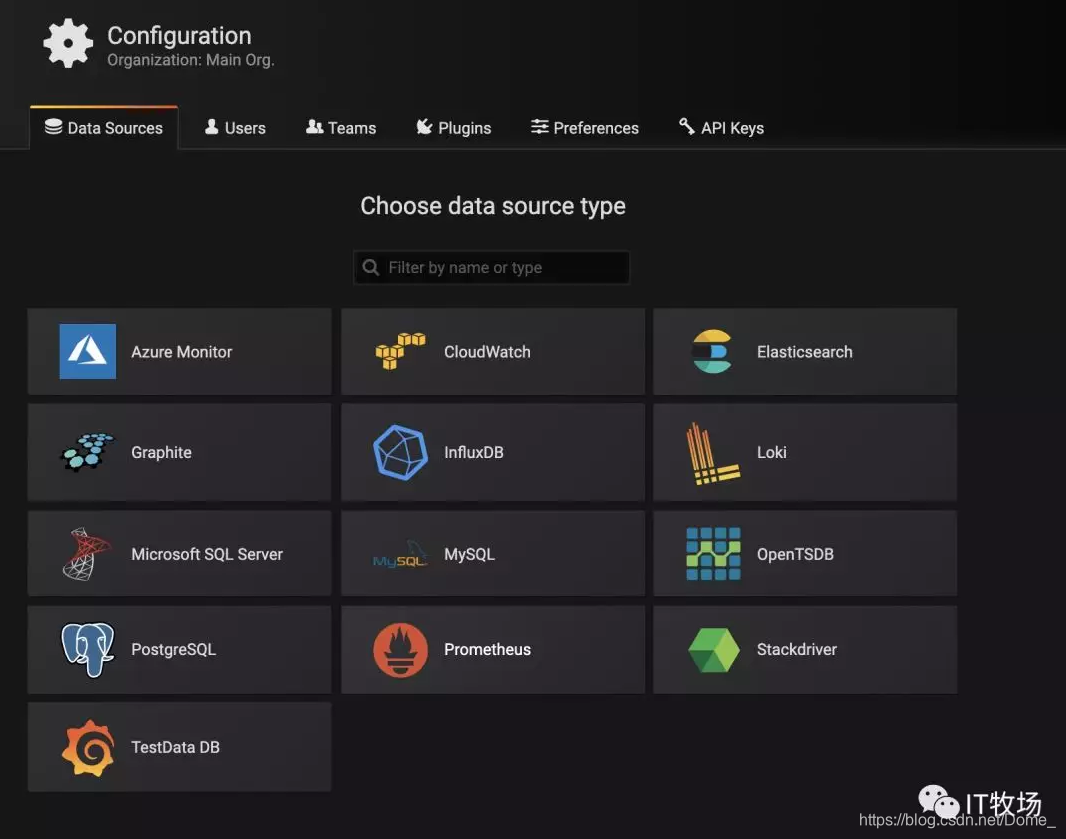
3 点击Prometheus,即可看到类似如下界面:
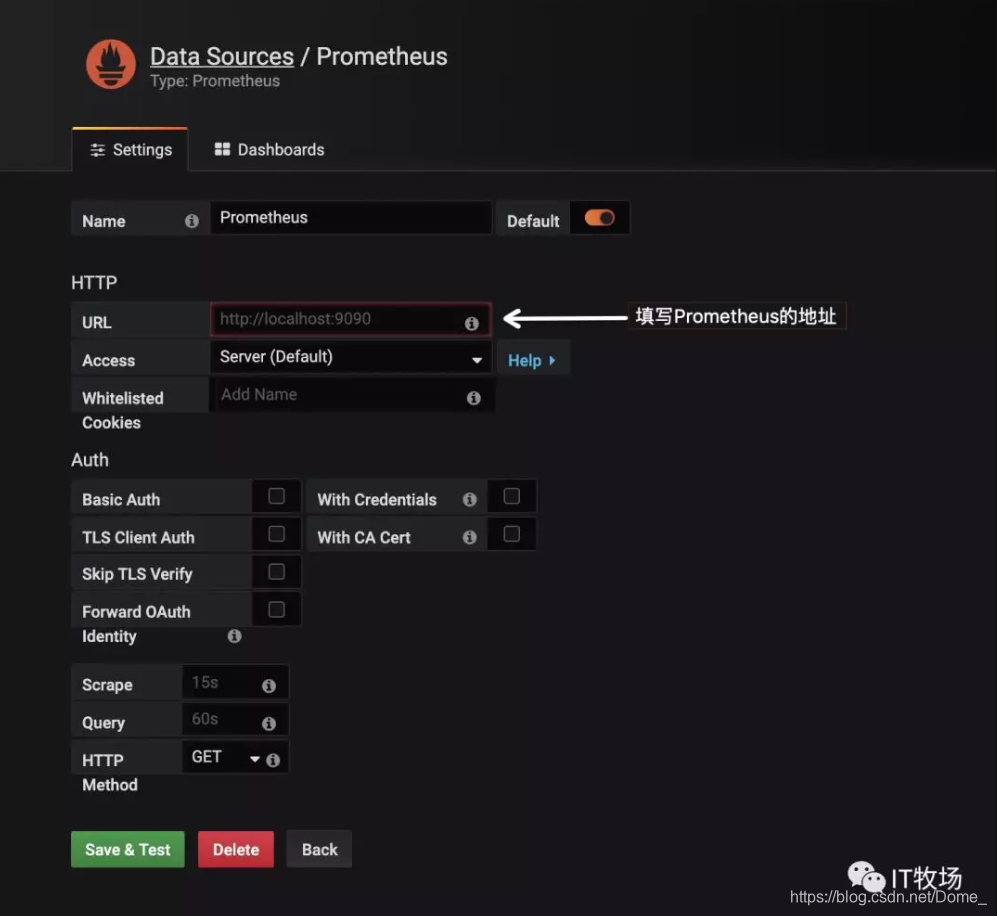
4 填写Prometheus的首页地址,并点击 Save & Test
创建监控Dashboard
1 点击导航栏上的 + 按钮,并点击Dashboard,将会看到类似如下的界面:
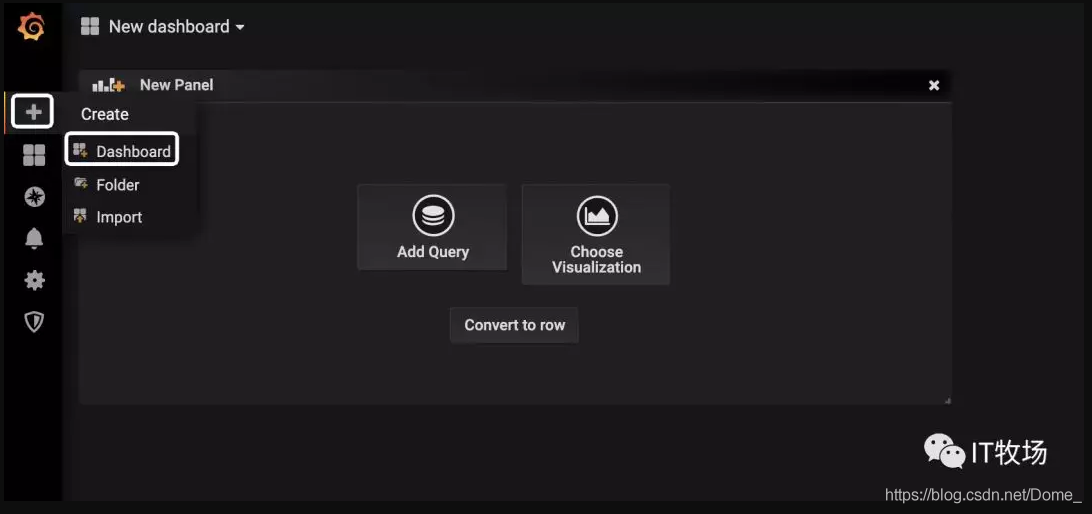
2 点击 Add Query ,即可看到类似如下的界面:

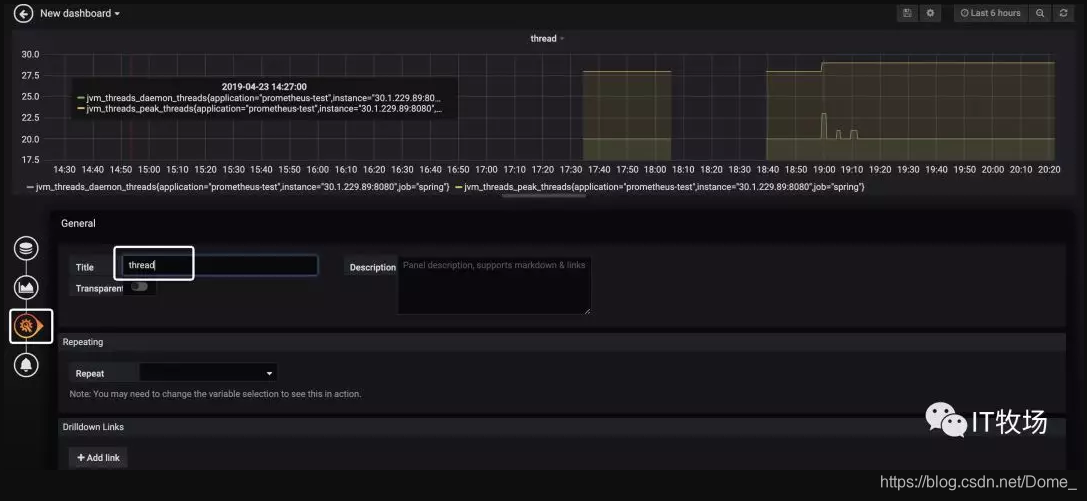
在白框标记的位置输入指标,指标的取值详见Spring Boot应用的 /actuator/prometheus 端点,例如jvm_memory_used_bytes 、jvm_threads_states_threads、jvm_threads_live_threads 等,Grafana会给你较好的提示,并且支持较为复杂的计算,例如聚合、求和、平均等。如果想要绘制多个线条,可点击Add Query 按钮,如上图所示,笔者为图表绘制了两条线,分别代表daemon以及peak线程。
3 点击下图的按钮,并填入Title,即可设置图表标题。
4 按下图步骤操作,即可为Dashboard添加新的图表。

Dashboard市场
至此,已可用Grafana实现较为丰富的图表展示——可将关心的监控指标放置到Dashboard上,并且非常灵活!然而,这个配置的操作虽然不难,但还是挺费时间的……
那么是否有配置好的又强大、又通用、拿来即用的Dashboard呢?答案是肯定的!前往 Grafana Lab - Dashboards[25] ,输入关键词即可搜索指定Dashboard。
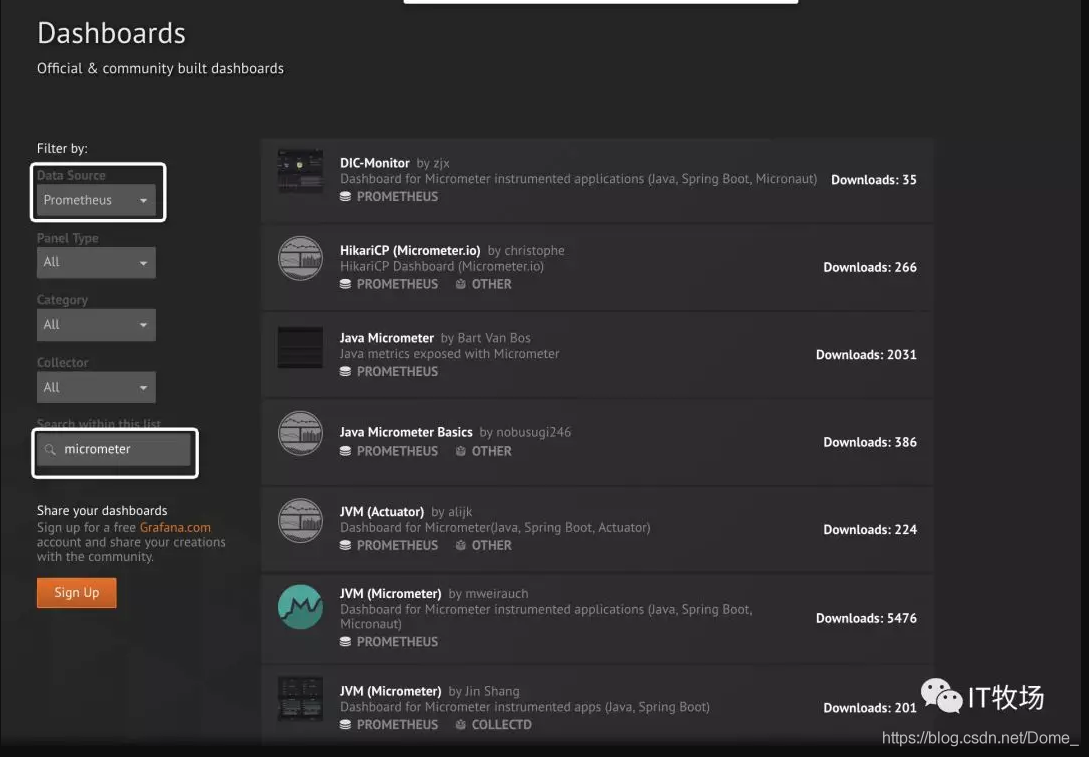
如上图所示,可以找到若干款以 Prometheus 作为数据源,支持Micrometer的Dashboard!下面,来演示如何使用 JVM(Micrometer) 这个Dashboard。
其他Dashboard使用方式大同小异,建议使用前先点击了解下详情,一般Dashboard中都会有说明。
1 点击 JVM(Micrometer) 进入Dashboard详情介绍页,如下图所示:
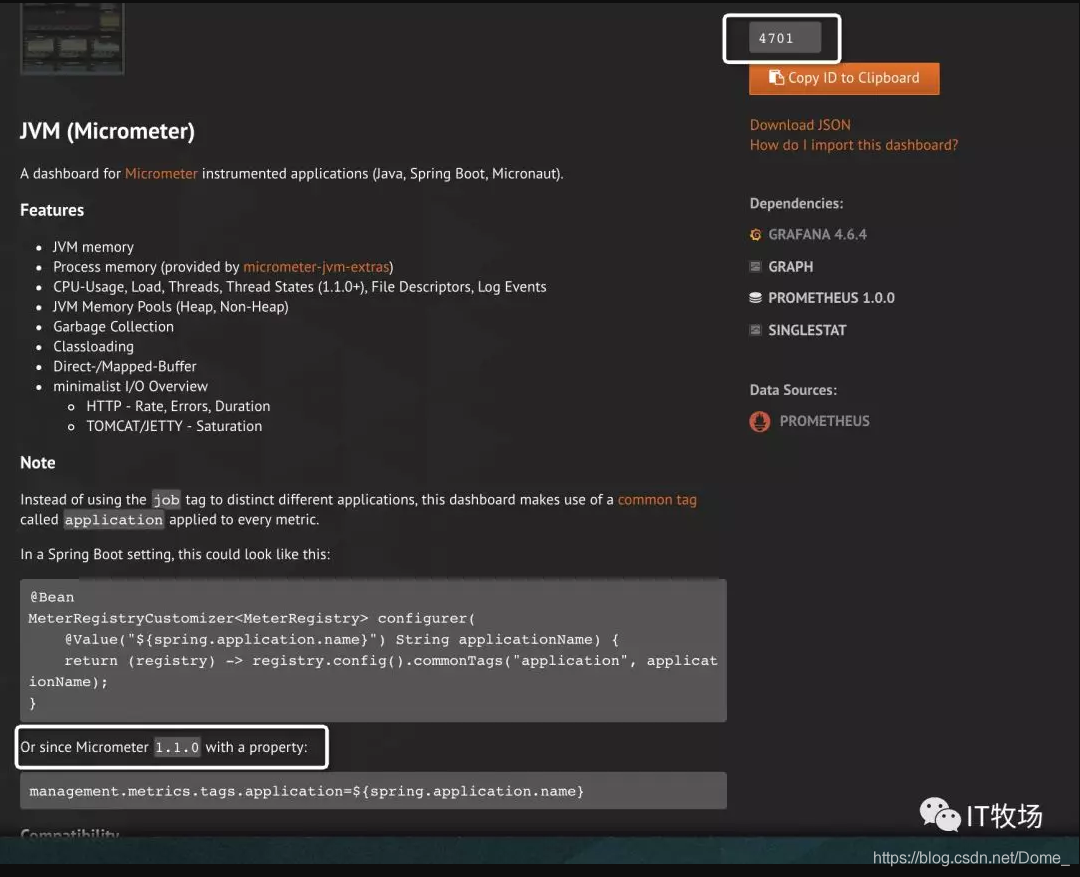
如图已详细描述了该Dashboard的特性、配置。其中的management.metrics.tags.application ,前面已经配置过了;本例也不打算演示 Process memory 特性,所以 micrometer-jvm-extras 怎么用也不打算引入了(这是该Dashboard作者为Micrometer提供的增强包,有兴趣的童鞋可自行点击过去研究)。
细心的童鞋会发现,该页的右上角有个 4701 这是一个非常重要的数字!
2 访问http://localhost:3000 ,按下图步骤操作:
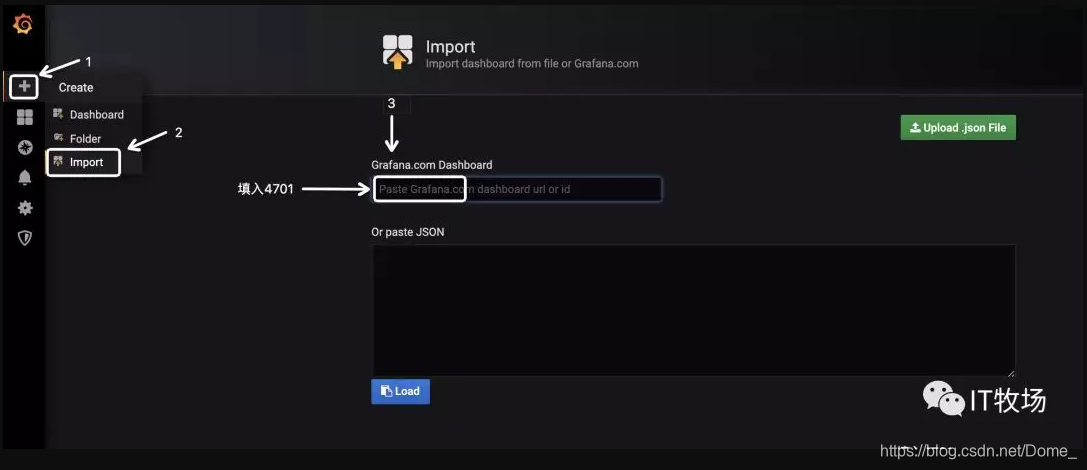
3 输入后即可看到类似如下的界面,选择数据源,并点击Import。
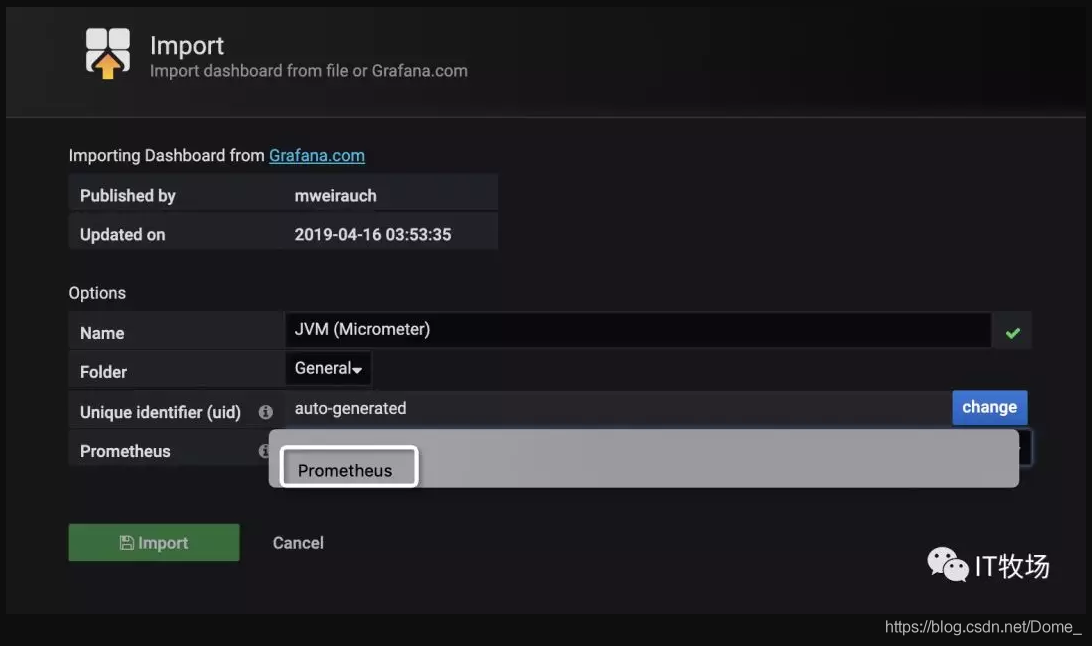
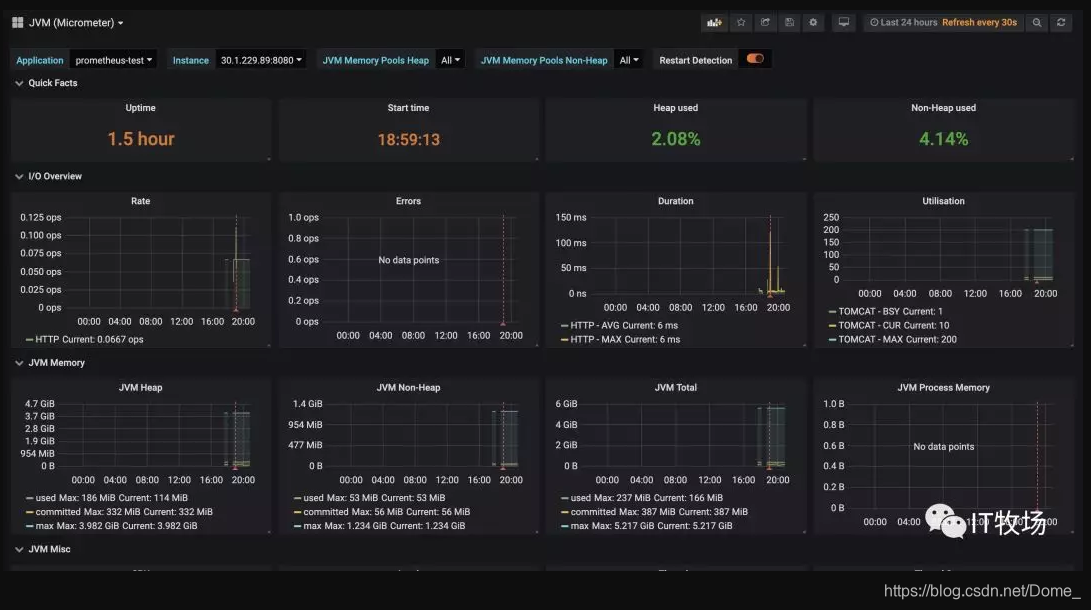
4 此时,即可看到类似如下的界面,如图所示,我们常关心的指标该Dashboard均已支持!
比较好用的Dashboard
•JVM (Micrometer)[26]•JVM (Actuator)[27]•Spring Boot Statistics[28] ,注:该Dashboard可能有Bug,笔者未能直接测试成功,做了一些改动后才能正常显示。
以上三款是笔者亲测较为全面、好用的Dashboard,仅供参考。
告警
Grafana支持的告警渠道非常丰富,例如邮件、钉钉、Slack、Webhook等,非常实用!比较简单,各位看官自行研究下吧。
配套代码
•GitHub[29]•Gitee[30]
其中 prometheus+grafana 目录已提供Docker一键部署Prometheus + Grafana的Shell
References
[1] AppOptics: https://docs.spring.io/spring-boot/docs/2.1.4.RELEASE/reference/htmlsingle/#production-ready-metrics-export-appoptics[2] Atlas: https://docs.spring.io/spring-boot/docs/2.1.4.RELEASE/reference/htmlsingle/#production-ready-metrics-export-atlas[3] Datadog: https://docs.spring.io/spring-boot/docs/2.1.4.RELEASE/reference/htmlsingle/#production-ready-metrics-export-datadog[4] Dynatrace: https://docs.spring.io/spring-boot/docs/2.1.4.RELEASE/reference/htmlsingle/#production-ready-metrics-export-dynatrace[5] Elastic: https://docs.spring.io/spring-boot/docs/2.1.4.RELEASE/reference/htmlsingle/#production-ready-metrics-export-elastic[6] Ganglia: https://docs.spring.io/spring-boot/docs/2.1.4.RELEASE/reference/htmlsingle/#production-ready-metrics-export-ganglia[7] Graphite: https://docs.spring.io/spring-boot/docs/2.1.4.RELEASE/reference/htmlsingle/#production-ready-metrics-export-graphite[8] Humio: https://docs.spring.io/spring-boot/docs/2.1.4.RELEASE/reference/htmlsingle/#production-ready-metrics-export-humio[9] Influx: https://docs.spring.io/spring-boot/docs/2.1.4.RELEASE/reference/htmlsingle/#production-ready-metrics-export-influx[10] JMX: https://docs.spring.io/spring-boot/docs/2.1.4.RELEASE/reference/htmlsingle/#production-ready-metrics-export-jmx[11] KairosDB: https://docs.spring.io/spring-boot/docs/2.1.4.RELEASE/reference/htmlsingle/#production-ready-metrics-export-kairos[12] New Relic: https://docs.spring.io/spring-boot/docs/2.1.4.RELEASE/reference/htmlsingle/#production-ready-metrics-export-newrelic[13] Prometheus: https://docs.spring.io/spring-boot/docs/2.1.4.RELEASE/reference/htmlsingle/#production-ready-metrics-export-prometheus[14] SignalFx: https://docs.spring.io/spring-boot/docs/2.1.4.RELEASE/reference/htmlsingle/#production-ready-metrics-export-signalfx[15] Simple (in-memory): https://docs.spring.io/spring-boot/docs/2.1.4.RELEASE/reference/htmlsingle/#production-ready-metrics-export-simple[16] StatsD: https://docs.spring.io/spring-boot/docs/2.1.4.RELEASE/reference/htmlsingle/#production-ready-metrics-export-statsd[17] Wavefront: https://docs.spring.io/spring-boot/docs/2.1.4.RELEASE/reference/htmlsingle/#production-ready-metrics-export-wavefront[18] Prometheus官方网站: https://prometheus.io/[19] Prometheus GitHub: https://github.com/prometheus[20] Prometheus安装说明: https://prometheus.io/docs/prometheus/latest/installation/[21] Prometheus Configuration官方文档: https://prometheus.io/docs/prometheus/latest/configuration/configuration/[22] Grafana官方网站: https://grafana.com/[23] Grafana GitHub: https://github.com/grafana/grafana[24] Grafana安装说明: https://grafana.com/docs/installation/[25] Grafana Lab - Dashboards: https://grafana.com/dashboards[26] JVM (Micrometer): https://grafana.com/dashboards/4701[27] JVM (Actuator): https://grafana.com/dashboards/9568[28] Spring Boot Statistics: https://grafana.com/dashboards/6756[29] GitHub: https://github.com/eacdy/spring-boot-study/tree/master/spring-boot-actuator-prometheus-grafana[30] Gitee: https://gitee.com/itmuch/spring-boot-study/tree/master/spring-boot-actuator-prometheus-grafana